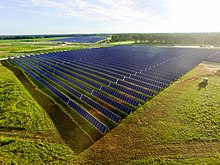
Solar power in Georgia (U.S. state)

Last updated
Solar roof, Murray Elementary School, Fort Stewart Murray Elementary School 140404-A-SL877-217 (cropped).jpg
Solar roof, Murray Elementary School, Fort Stewart

Solar power in Georgia on rooftops can provide 31% of all electricity used in Georgia. [1]

Contents

Net metering is limited to 100 kW for non-residential consumers and 10 kW for residential consumers, up to 0.2% of previous years peak demand. Georgia was given an F for net metering. [2] [3] Georgia is not a Net Metering State. [4]

Old Midville solar project, Millen Harwood 000575 166989 511428 4578 (36965570405).jpg
Old Midville solar project, Millen

The state's first solar community is located at Weatherford Place in Roswell. [5] [6] All homes are LEED Certified Platinum and monitored. The solar generation is compared to GP totals each month. The past 6 years of data monitoring show that GP meter consistently records less produced power. GP does not pay "time of day rates" as do many other states and also requires the homeowner to sign over all "environmental attributes" [solar renewable energy credits or SRECs] if the homeowner chooses to sell back all solar energy. Similar results are being seen at a Zero Net Energy home [the architectural design and training was a pro-bono project of Cadmus Design-Build [7] and is being monitored by UGA] located in Tifton, GA. In other states such as California, New Jersey, New York, North Carolina, Pennsylvania, etc.] the accumulated SRECs can be sold by the owner of the system. Georgia does not allow the sale of SRECs. Georgia Power is also charging the homeowner tax on the solar energy that is sold back to GP. According to the Database of State Incentives for Renewable Energy, [8] Renewable energy is not taxable.

Solar panels, Georgia Tech Aquatic Center Georgia Tech Aquatic Center Solar Panels.jpg
Solar panels, Georgia Tech Aquatic Center

Georgia Power has a solar purchase program, SP-1, for up to 100 kW systems which pays 17¢/kWh. A second meter is installed for the solar generation, all of which is purchased by Georgia Power. The consumer then purchases back any electricity consumed as if they did not have solar power. The program has an aggregate limit of 4.4 MW and is fully subscribed, but will be expanded as consumers purchase "Premium Green Energy", for an additional $5.00/100kWh. Once a consumer enters the program there is no reason to also purchase green energy, as doing so would reduce the 17 cent payment to 12 cents. [9] [10] By comparison, Ontario paid 80¢Canadian/kWh, and Germany €34.05¢/kWh, both with 20 year contracts, vs. the 5-year contract from Georgia Power. Long term power agreements are essential to renewable energy projects, as you pay upfront for 25 years of electricity - the "fuel", the sun or wind, is free, and most of the cost of wind power or solar power is the installation cost. [11]

Approved by the state's Public Service Commission in 2012 and significantly expanded in the following year, Georgia Power's 'Advanced Solar Initiative' is expected to bring online 865 MW of solar capacity by the end of 2016. [12] [13]

In 1982 the country's largest industrial solar installation was completed, the 400 kW Solar Total Energy Project, which operated until 1991. [14]

The $5 million 1 MW Spectro PowerCap on the Hickory Ridge Landfill near Atlanta was one of Georgia's largest solar arrays, when it was completed in October 2011. [15] Another 1MW solar farm in Blairsville was completed in January 2011. [16]

A 30 MW solar farm is being developed in Social Circle, and is expected to be completed in 2015. [17] [18] [19]

In 2011, Georgia was one of three states being considered for a 400 MW solar park, to consist of 20 20 MW sections. Other states being considered were Florida and North Carolina. [20] Gadsden County, Florida, was chosen. The company, National Solar, is planning 3,000 MW of solar farms in the Southeast. [21] [22]

Statistics

Solar power in Georgia (U.S. state)
Source: NREL [23]
Grid-connected PV capacity (MWp) [24] [25] [26] [27] [28] [29]
YearCapacityInstalled % Change
20080.1
20090.20.1100%
20101.81.6800%
20116.95.1283%
201221.48.2210%
2013109.988.5414%
20141605046%
2015370209131%
20161,4701,100297%
20171,555855.7%
20181,568130.8%
20192,448.1880.156%
20202,757.9309.812.7%
20214,268.51,510.6 %
20225,033764.5 %
Utility-scale solar generation in Georgia (GWh) [30]
YearTotalJanFebMarAprMayJunJulAugSepOctNovDec
201311000000000056
20141208811111311111291187
2015129899101312131299817
2016880253443485957668297115121133
20171,98813414816019822518321418817914113187
20181,99513610816520219421620620318817410994
20192,16213198194205242209217200198150155163
20203,901182224281350414379414417348340281271
20213,451254267408497582489491463

See also

Related Research Articles

<span class="mw-page-title-main">Solar power in Massachusetts</span> Overview of solar power in the U.S. state of Massachusetts

Solar power in Massachusetts has been increasing rapidly, due to Section 1603 grants for installations that began before December 31, 2011, and the sale of SRECs for $0.30/kWh, which allows payback for the system within 5 or 6 years, and generates income for the life of the system. For systems installed after December 31, 2011, and before December 31, 2016, the 30% tax grant becomes a 30% tax credit. There has been an appeal to the Congress to extend the 1603 program, the grant program, for an additional year.

<span class="mw-page-title-main">Solar power in Connecticut</span> Overview of solar power in the U.S. state of Connecticut

Solar power in Connecticut establishes Connecticut as the second state in the US to reach grid parity, after Hawaii, due to the high average cost of electricity. Installing solar panels for a home provides an estimated 15.6% return on investment.

<span class="mw-page-title-main">Solar power in New York</span> Overview of solar power in the U.S. state of New York

As of mid-2023, New York has over 4,717 MW of solar power installed, generating almost 5% of the state's electricity.

<span class="mw-page-title-main">Solar power in Washington (state)</span>

As of the first quarter of 2023, Washington State has 604 MW of solar power electricity generation. This is an increase from about 300 MW in 2021 and 27 MW in 2013.

<span class="mw-page-title-main">Solar power in Wyoming</span>

Solar power in Wyoming has the potential to generate 72 million MWh/yr. Wyoming used 12 million MWh in 1999. Net metering is available to all consumers generating up to 25 kW. The state has an installed capacity of 146 MW as of 2022.

<span class="mw-page-title-main">Solar power in Indiana</span> Overview of solar power in the U.S. state of Indiana

Solar power in Indiana has been growing in recent years due to new technological improvements and a variety of regulatory actions and financial incentives, particularly a 30% federal tax credit for any size project.

<span class="mw-page-title-main">Solar power in West Virginia</span> Electricity from sunlight in one U.S. state

Solar power in West Virginia on rooftops can provide 23% of all electricity used in West Virginia from 6,300 MW of solar panels, but West Virginia will be the last state in the United States to reach grid parity - the point where solar panels are cheaper than grid electricity - without incentives, due to the low cost of electricity - about $0.062/kWh. The point where grid parity is reached is a product of the average insolation and the average cost of electricity. At $0.062/kWh and 4.3 sun-hours/day, solar panels would need to come down to ~$1,850/kW installed to achieve grid parity. The first state in the US to achieve grid parity was Hawaii. Solar power's favorable carbon footprint compared to fossil fuels is a major motivation for expanding renewable energy in the state, especially when compared to coal to generate electrical power.

<span class="mw-page-title-main">Solar power in Iowa</span> Overview of solar power in the U.S. state of Iowa

Solar power in Iowa is limited but growing, with 137 megawatts (MW) installed by the end of 2019 and 27 MW installed during that year, ranking the state 40th among U.S. states. Iowa also generated 0.23% of the state's total electricity production in 2019 from solar energy; an amount sufficient to power over 17,000 Iowa homes. The state's early position as a major wind-power provider may have limited early large-scale solar investment.

Solar power in North Dakota has been a little-used resource. The state ranks last on installed solar power in the United States, with .47 MW of installed capacity. Solar on rooftops can provide 24.6% of all electricity used in North Dakota from 3,300 MW of solar panels. The most cost effective application for solar panels is for pumping water at remote wells where solar panels can be installed for $800 vs. running power lines for $15,000/mile.

<span class="mw-page-title-main">Solar power in Maine</span> Overview of solar power in the U.S. state of Maine

Solar power in Maine on rooftops, utilizing 6,300 megawatts (MW) of solar panels, can provide 60% of the electricity used in Maine according to a 2016 U.S. Department of Energy study. Maine and Vermont are tied for the second highest rooftop solar potential in the country, only behind the state of California. A 2020 estimate suggests that a typical 5.6 kilowatt (kW) residential system will pay for itself in 6-7 years and generate a profit of $45,000 over the rest of its 25-year life from the tax credits and utility savings.

<span class="mw-page-title-main">Solar power in Oklahoma</span> Overview of solar power in the U.S. state of Oklahoma

Solar power in Oklahoma can provide 44.1% of all electricity used in Oklahoma from 19,300 MW of rooftop solar panels. This scenario is extremely unlikely though because the cost of electricity in Oklahoma is among the lowest in the nation.

<span class="mw-page-title-main">Solar power in Arkansas</span> Overview of solar power in the U.S. state of Arkansas

Solar power in Arkansas on rooftops can provide 33.3% of all electricity used in Arkansas from 12,200 MW of solar panels.

<span class="mw-page-title-main">Solar power in Alabama</span> Overview of solar power in the U.S. state of Alabama

Solar power in Alabama on rooftops could theoretically provide 29.8% of all electricity used in Alabama, with 20,400 MW of solar panels potentially installed on rooftops.

Solar power in Illinois has been increasing, as the cost of photovoltaics has decreased. As of the end of 2020, Illinois had 465 megawatts (MW) of installed photovoltaic and concentrated solar power capacity combined employing over 5,200 jobs. Illinois adopted a net metering rule which allows customers generating up to 40 kW to use net metering, with the kilowatt hour surplus rolled over each month, and lost at the end of either April or October, as selected by the customer. In 2011, the limit was raised to 2 MW, but is not net metering, as the term is commonly known, as it uses two meters for systems larger than 40 kW.

<span class="mw-page-title-main">Solar power in Maryland</span> Overview of solar power in the U.S. state of Maryland

Solar power in Maryland is supported by the state's legislation regarding the Renewable Portfolio Standard and Solar Renewable Energy Credit (SREC) program. The target for renewable energy as of 2017 is 20% by 2020, including 2% from solar power.
<span class="mw-page-title-main">Solar power in Idaho</span> Solar power in Idaho

Solar power in Idaho comprised 550 MW in 2019. A 2016 report by the National Renewable Energy Laboratory estimated that rooftops alone have the potential to host 4,700 MW of solar panels, and thus provide 26.4% of all electricity used in Idaho. A large increase in the state's solar generating capacity began starting year 2015 when 461 MW of solar power was contracted to be built in Idaho.

<span class="mw-page-title-main">Solar power in Montana</span> Overview of solar power in the U.S. state of Montana

Solar power in Montana on rooftops could provide 28% of all electricity used in Montana from 3,200 MW of solar panels.

<span class="mw-page-title-main">Solar power in New Hampshire</span> Overview of solar power in the U.S. state of New Hampshire

Solar power in New Hampshire provides a small percentage of the state's electricity. State renewable requirements and declining prices have led to some installations. Photovoltaics on rooftops can provide 53.4% of all electricity used in New Hampshire, from 5,300 MW of solar panels, and 72% of the electricity used in Concord, New Hampshire. A 2016 estimate suggests that a typical 5 kW system costing $25,000 before credits and utility savings will pay for itself in 9 years, and generate a profit of $34,196 over the rest of its 25-year life. A loan or lease provides a net savings each year, including the first year. New Hampshire has a rebate program which pays $0.75/W for residential systems up to 5 kW, for up to 50% of the system cost, up to $3,750. However, New Hampshire's solar installation lagged behind nearby states such as Vermont and New York, which in 2013 had 10 times and 25 times more solar, respectively.

<span class="mw-page-title-main">Solar power in Vermont</span> Overview of solar power in the U.S. state of Vermont

Solar power in Vermont provides almost 11% of the state's in-state electricity production as of 2018. A 2009 study indicated that distributed solar on rooftops can provide 18% of all electricity used in Vermont. A 2012 estimate suggests that a typical 5 kW system costing $25,000 before credits and utility savings will pay for itself in 10 years, and generate a profit of $34,956 over the rest of its 25-year life.

<span class="mw-page-title-main">Solar power in Virginia</span>

Solar power in Virginia on rooftops is estimated to be capable of providing 32.4% of electricity used in Virginia using 28,500 MW of solar panels. Installing solar panels provides a 6.8% return on investment in Virginia, and a 5 kW array would return a profit of $16,041 over its 25 year life.

References

  1. Witkin, Jim (30 October 2009). "Report Argues for a Decentralized System of Renewable Power Generation".
  2. Freeing the Grid
  3. "2019 Guide to Georgia Home Solar Incentives, Rebates, and Tax Credits".
  4. https://twitter.com/timechols/status/333978655875280896 GA PCS member Tim Echols' Net Metering tweet
  5. "Journal of Green Building -". pinnacle-secure.allenpress.com. doi:10.3992/1943-4618-9.2.3.
  6. "Weatherford Place New LEED Platinum Solar home construction Roswell GA". Weatherford Place.
  7. "CADMUS". www.cadmusconstruction.com.
  8. "Database of State Incentives for Renewables & Efficiency®". DSIRE.
  9. Georgia Power - Solar Buyback Program Archived 2013-04-14 at archive.today
  10. Georgia Power Solar Buy Back Archived 2013-01-18 at the Wayback Machine
  11. "Comparing Feed-In-Tariff Programs from Ontario and Germany - d-bits".
  12. Kristi E. Swartz (2014-04-15). "Solar gains ground in Southeast as programs in Ga. and S.C. build momentum". Environment & Energy Publishing. Retrieved 2014-08-15.
  13. Mark Vanderhoek (2014-07-25). "Solar set to make big inroads across Middle Georgia". The Telegraph. Retrieved 2014-08-15.
  14. Ap (11 May 1982). "Solar Plant Dedicated" via NYTimes.com.
  15. "Republic Services installs landfill cap system integrated with 1MW of solar PV near Atlanta". PV Tech.
  16. "ESA Renewables Commissions Georgia's Largest Ground Mounted Solar Photovoltaic System". PRWeb.
  17. "Projects".
  18. "First big Ga. Power solar project comes online in Upson". macon.
  19. "Home". Simon Solar.
  20. GA in race for site of "world's largest solar farm."
  21. National Solar Power to Establish a 200 MW Solar Farm in Hardee County Archived 2012-08-04 at the Wayback Machine
  22. Florida’s Gadsden County, “Big Bend” Region Win Southeast’s Largest Solar Farm Project Archived 2012-08-04 at the Wayback Machine
  23. "PV Watts". NREL. Retrieved 12 June 2012.
  24. Sherwood, Larry (July 2014). "U.S. Solar Market Trends 2013" (PDF). Interstate Renewable Energy Council (IREC). p. 29. Retrieved 2014-07-16.
  25. Sherwood, Larry (July 2012). "U.S. Solar Market Trends 2012" (PDF). Interstate Renewable Energy Council (IREC). p. 16. Retrieved 2013-10-11.
  26. Sherwood, Larry (August 2012). "U.S. Solar Market Trends 2011" (PDF). Interstate Renewable Energy Council (IREC). Archived from the original (PDF) on 2012-09-06. Retrieved 2012-08-16.
  27. Sherwood, Larry (June 2011). "U.S. Solar Market Trends 2010" (PDF). Interstate Renewable Energy Council (IREC). p. 20. Retrieved 2011-06-29.
  28. Sherwood, Larry (July 2010). "U.S. Solar Market Trends 2009" (PDF). Interstate Renewable Energy Council (IREC). p. 23. Archived from the original (PDF) on 2010-09-25. Retrieved 2010-07-28.
  29. Georgia Solar Archived 2014-12-27 at the Wayback Machine
  30. "Electricity Data Browser". U.S. Department of Energy. March 28, 2018. Retrieved October 12, 2021.