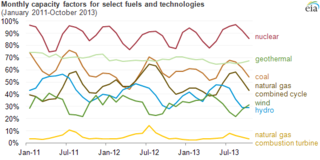
The net capacity factor is the unitless ratio of actual electrical energy output over a given period of time to the theoretical maximum electrical energy output over that period. The theoretical maximum energy output of a given installation is defined as that due to its continuous operation at full nameplate capacity over the relevant period. The capacity factor can be calculated for any electricity producing installation, such as a fuel consuming power plant or one using renewable energy, such as wind or the sun. The average capacity factor can also be defined for any class of such installations, and can be used to compare different types of electricity production.
Wind power in California had initiative and early development during Governor Jerry Brown's first two terms in the late 1970s and early 1980s. The state's wind power capacity has grown by nearly 350% since 2001, when it was less than 1,700 MW. In 2016, wind energy supplied about 6.9% of California's total electricity needs, or enough to power more than 1.3 million households. Most of California's wind generation is found in the Tehachapi area of Kern County, California, with some large projects in Solano, Contra Costa and Riverside counties as well. California is among the states with the largest amount of installed wind power capacity. In recent years, California has lagged behind other states when it comes to the installation of wind power. It was ranked 4th overall for wind power electrical generation at the end of 2016 behind Texas, Iowa, and Oklahoma. As of 2019, California had 5,973 megawatts (MW) of wind power generating capacity installed.
The Titan Wind Project is 25MW wind farm which had a proposed expansion to 5,050 MW, formerly known as Rolling Thunder, based in South Dakota. The project developers, Clipper Windpower and BP Alternative Energy, expected to build Titan in several phases and, when completed, it would have been one of the largest wind farms in the world.

At the end of 2015, the installed capacity of wind power in Washington was 3,075 megawatts (MW) with wind power accounting for 7,101 GWh. In 2016, it reached a generation of 8,041 GWh, comprising 7.1% of the electricity generated in the state. In 2019, it had a capacity of 3,085 MW, responsible for 7.33% of generation.

Wyoming has one of the highest wind power potentials of any state in the United States. In 2019, Wyoming had wind powered electricity generating capacity of 1,589 MW, which produced 9.85% of its electric generation, with an additional 3,753 MW under construction. However, the wind generation in that year was Wyoming's third-lowest in the 2010s. By 2020, wind capacity increased to 2738 MW and 8448 gigawatt-hours of electricity were produced from wind in 2021, more than double 2019 production. Additional wind capacity and needed transmission lines are under construction or planned, despite political headwinds from Wyoming's strong coal and oil sectors.

At the end of 2016, the installed capacity for wind power in Minnesota was 3,500 megawatts (MW). Wind power generated nearly 18 percent of Minnesota’s electricity in 2016, ranking sixth in the nation for wind energy as a share of total electricity generation.

Wind power in Illinois provided nearly 10% of the state's generated electrical power in 2020 powering 1,231,900 homes. At the end of 2020, Illinois had 6,300 megawatts (MW) of wind power installed, ranking fifth among states for installed wind turbine capacity. An additional 1,100 MW of wind power was under construction across the state at the end of 2020.

Wind power in Montana is a growing industry. Montana had over 695 MW of wind generation capability by 2016, responsible for 7.6% of in-state electricity generation.
Wind power in Indiana was limited to a few small water-pumping windmills on farms until 2008 with construction of Indiana's first utility-scale wind power facility, Goodland with a nameplate capacity of 130 MW. As of September 2017, Indiana had a total of 1897 MW of wind power capacity installed, ranking it 12th among U.S. states. Wind power was responsible for 4.8% of in-state electricity production in 2016.
The Dry Lake Wind Power Project in Navajo County is the first and the largest utility-scale wind farm in the U.S. state of Arizona. Starting in 2009, it was constructed in two phases having a total generating capacity of 128.1 megawatts (MW), and is selling the electricity to the Salt River Power District (SRP).
In 2016, Arizona had 268 megawatts (MW) of wind powered electricity generating capacity, producing 0.5% of in-state generated electricity.

The US state of Colorado has vast wind energy resources and the installed electricity capacity and generation from wind power in Colorado has been growing significantly in recent years. The growth has been sustained due to a combination of falling costs, continuing federal incentives, and the state's aggressive renewable portfolio standard that requires 30% of the state's electricity to come from renewable sources by 2020.

Solar power in Florida has been increasing, as the cost of solar power systems using photovoltaics (PV) has decreased in recent years. Florida has low electricity costs compared with other states, which makes individual solar investment less attractive. Florida ranks ninth nationally in solar resource strength according to the National Renewable Energy Laboratory and tenth in solar generation by the Solar Energy Industries Association.

Wind power in Michigan is a developing industry. The industrial base from the automotive industry has led to a number of companies producing wind turbine parts in the state. The development of wind farms in the state, however, has lagged behind. In January 2021, there were a total of 1,481 wind turbines in the state with a nameplate capacity of 2,549 MW. The nameplate total exceeded 2,000 MW when Pine River came online in March 2019. Wind provided 4.2% of the state's electricity in 2016.

The U.S. State of Oklahoma has high potential capacity for wind power in the western half of the state. In 2021, Oklahoma's installed wind generation capacity was almost 10,500 megawatts, supplying over 40% of the state's generated electricity and 85% of Oklahoma's total generating capacity from all renewable resources.

Wind power in Idaho could generate more energy than the state uses.

Wind power in Hawaii has the potential to provide all of the electricity generation in the electricity sector in Hawaii. The 132 commercial wind turbines in the state have a total capacity of 236 MW. In 2015, wind turbines produced 6.4% of Hawaii's electricity. In 2012, Hawaii generated 367 million kWh from wind power.


