
Solar power in Nevada is growing due to a Renewable Portfolio Standard which requires 50% renewable energy by 2030. The state has abundant open land areas and some of the best solar potential in the country. [1]
Solar power in Nevada is growing due to a Renewable Portfolio Standard which requires 50% renewable energy by 2030. The state has abundant open land areas and some of the best solar potential in the country. [1]

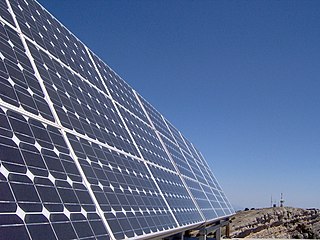
The number and size of photovoltaic power stations in Nevada has been growing rapidly since about 2010. As of 2018, the largest is the 552 MW Copper Mountain Solar Facility near Boulder City, which is a group of co-located units, each sized up to 250 MW. [2] [3] [4] [5] Another 250 MW unit has been approved for construction, which could make it the largest solar facility in the United States. [6] [7] Earlier notable solar facilities in the state include the 14.2 megawatt (MW-peak), 140 acre Nellis Solar Power Plant, and the 64 MW, 400 acre concentrating solar thermal power plant Nevada Solar One, which both began operation in 2007.
Nevada has also been a leader in low-cost solar electricity generation, establishing several milestones. The Nellis plant was able to provide Nellis Air Force Base with electricity for only 2.2 cents/kWh—compared to the 9 cents they were paying Nevada Power—by selling renewable energy credits (RECs). [8] In 2015, the 100 MW Playa Solar 2 project—to be constructed by First Solar with a 20-year power purchase agreement with NV Energy - was proposed for $0.0378 per kilowatt-hour. This was below the lowest price of $0.046 available the previous year from the 100 MW Boulder Solar plant. [9] In 2018, the 300 megawatt (MWAC) Eagle Shadow Mountain Solar Farm was approved for construction with flat rate of $0.02376 per kilowatt-hour throughout its 25-year PPA term, which could establish a new record. [10] [11] [12]
Solar photovoltaic and/or thermal power has also been proposed to augment some geothermal power plants in the region—which struggle to meet demand during mid-day peak hours due to their higher bottom of the thermodynamic cycle—since the solar plants will peak at that time. [13] [14] [15]
As of February 2022, there are 26 large proposed projects in Nevada, totaling over 21 GW of capacity, or five times the state's existing solar capacity. These projects also include more than 17 GW of energy storage. [16] Half of these were proposed in Nye County, which would be enabled by two new transmission lines, though some are close to Death Valley National Park. [17]

Prominent Nevada-based solar installation companies include 702 Energy Savers, Radiant Solar, Summerlin Energy, Bombard Renewable Energy, and Hamilton Solar. [18]
Nevada had 129 MW in private installations of rooftop solar in 2015. [19]
The federal Residential Energy Efficient Property Credit (income tax credit on IRS Form 5695) for residential PV and solar thermal was extended in December 2015 to remain at 30% of system cost (parts and installation). There is no maximum cap on the credit, and the credit can be applied toward the Alternative Minimum Tax, and any excess credit (greater than that year's tax liability) can be rolled into the following year. [20] [21]
Net energy metering rules were changed in December 2015, unfavorably for homeowners having or considering rooftop solar, and were applied even to existing installations. Some major installers, including SolarCity, Vivint, and SunRun, withdrew from the Nevada market.
After a public outcry, the earlier favorable rules were grandfathered for up to 32,000 customers whose systems were active or had a pending application by December 31, 2015. [22] [23] [24] [25] [26] [27] The Public Utilities Commission of Nevada approved bill AB405 in 2017 to restore net metering. [28]
| Year | Photovoltaics | CSP | ||||
|---|---|---|---|---|---|---|
| Capacity | Installed | % Change | Capacity | Installed | % Change | |
| 2007 | 18.8 | 15.9 | 548% | 64 | ||
| 2008 | 34.2 | 14.9 | 82% | 64 | ||
| 2009 | 36.4 | 2.5 | 6% | 64 | ||
| 2010 | 104.7 | 68.3 | 188% | 64 | ||
| 2011 | 124.1 | 19.4 | 19% | 64 | ||
| 2012 | 349.7 | 225.6 | 182% | 64 | ||
| 2013 | 424.0 | 74.3 | 21% | 64 | ||
| 2014 | 823 | 399 | 94% | 64 | ||
| 2015 | 1,240 | 417 | 51% | 184 | 120 | |
| 2016 | 2,241.9 | 1,001.9 | 81% | 184 | 0 | |
| 2017 | 2,421.3 | 179.4 | 8% | 184 | 0 | |
| 2018 | 2,951.3 | 530 | 21% | 184 | 0 | |
| 2019 | 3,556.2 | 604.9 | 20% | 184 | 0 | |
| 2020 | 3,871.7 | 315.5 | 8% | 184 | 0 | |
| 2021 | 4,510.8 | 639.1 | % | |||
| 2022 | 5,366 | 855.2 | % | |||


| Year | Generation (GWh) | Generation (% of NV total) | Generation (% of US Solar) |
|---|---|---|---|
| 2010 | 217 | 0.6% | 17.9% |
| 2011 | 290 | 0.9% | 16% |
| 2012 | 473 | 1.3% | 10.9% |
| 2013 | 749 | 2.1% | 8.2% |
| 2014 | 1,028 | 2.8% | 5.6% |
| 2015 | 1,658 | 4.2% | 6.6% |
| 2016 | 3,124 | 7.85% | 8.67% |
| 2017 | 3,966 | 10.38% | 7.44% |
| 2018* | 4,344 | 10.88% | 6.52% |
(*) Preliminary data from Electric Power Monthly.
Beginning with the 2014 data year, Energy Information Administration has estimated distributed solar photovoltaic generation and distributed solar photovoltaic capacity. These non-utility scale estimates project that, Nevada, generated the following additional solar energy.
| Year | Summer capacity (MW) | Electric energy (GWh or M kWh) |
|---|---|---|
| 2014 | 49 | 86 |
| 2015 | 120.4 | 186 |
| 2016 | 209.5 | 372 |
| 2017 | 227.3 | 412 |
| 2018* | 299.1 | 493 |

Solar power in New Mexico in 2016 generated 2.8% of the state's total electricity consumption, despite a National Renewable Energy Laboratory (NREL) projection suggesting a potential contribution three orders of magnitude larger.

Solar power in Arizona has the potential to, according to then-Governor Janet Napolitano, make Arizona "the Persian Gulf of solar energy". In 2012, Arizona had 1,106 MW of photovoltaic (PV) solar power systems, and 6 MW of concentrated solar power (CSP), bringing the total to over 1,112 megawatts (MW) of solar power. As an example, the Solana Generating Station, a 280 MW parabolic trough solar plant, when commissioned in 2013, was the largest parabolic trough plant in the world and the first U.S. solar plant with molten salt thermal energy storage.

Solar power in Colorado has grown rapidly, partly because of one of the most favorable net metering laws in the country, with no limit on the number of users. The state was the first in the nation to establish a Renewable Portfolio Standard for its electric utilities.

Solar power in Florida has been increasing, as the cost of solar power systems using photovoltaics (PV) has decreased in recent years. Florida has low electricity costs compared with other states, which makes individual solar investment less attractive. Florida ranks ninth nationally in solar resource strength according to the National Renewable Energy Laboratory and tenth in solar generation by the Solar Energy Industries Association.

Solar power in Texas, a portion of total energy in Texas, includes utility-scale solar power plants as well as local distributed generation, mostly from rooftop photovoltaics. The western portion of the state especially has abundant open land areas, with some of the greatest solar and wind potential in the country. Development activities there are also encouraged by relatively simple permitting and significant available transmission capacity.

Solar power has been increasing rapidly in the U.S. state of North Carolina, from less than 1 MW (megawatts) in 2007 to 6,152 MW in 2019, when it had the second-largest installed PV capacity of all states.

Solar power in Nebraska is used for only a very small percentage of the state's electricity, although it is rapidly becoming competitive with grid electricity, due to the decrease in cost and the eight-year extension to the 30% tax credit, which can be used to install systems of any size. In 2015, the state ranked 47th among the 50 U.S. states with 1.1 MW of installed capacity.

Solar power in Ohio has been increasing, as the cost of photovoltaics has decreased. Ohio installed 10 MW of solar in 2015. Ohio adopted a net metering rule which allows any customer generating up to 25 kW to use net metering, with the kilowatt hour surplus rolled over each month, and paid by the utility once a year at the generation rate upon request. For hospitals there is no limit on size, but two meters are required, one for generation, the other for utility supplied power.
Solar power in Rhode Island has become economical due to new technological improvements and a variety of regulatory actions and financial incentives, particularly a 30% federal tax credit, available through 2016, for any size project. A typical residential installation could pay for itself in utility bill savings in 14 years, and generate a profit for the remainder of its 25 year life. Larger systems, from 10 kW to 5 MW, receive a feed-in tariff of up to 33.45¢/kWh.

Solar power in Indiana has been growing in recent years due to new technological improvements and a variety of regulatory actions and financial incentives, particularly a 30% federal tax credit for any size project.

Solar power in West Virginia on rooftops can provide 23% of all electricity used in West Virginia from 6,300 MW of solar panels, but West Virginia will be the last state in the United States to reach grid parity - the point where solar panels are cheaper than grid electricity - without incentives, due to the low cost of electricity - about $0.062/kWh. The point where grid parity is reached is a product of the average insolation and the average cost of electricity. At $0.062/kWh and 4.3 sun-hours/day, solar panels would need to come down to ~$1,850/kW installed to achieve grid parity. The first state in the US to achieve grid parity was Hawaii. Solar power's favorable carbon footprint compared to fossil fuels is a major motivation for expanding renewable energy in the state, especially when compared to coal to generate electrical power.
Solar power in North Dakota has been a little-used resource. The state ranks last on installed solar power in the United States, with .47 MW of installed capacity. Solar on rooftops can provide 24.6% of all electricity used in North Dakota from 3,300 MW of solar panels. The most cost effective application for solar panels is for pumping water at remote wells where solar panels can be installed for $800 vs. running power lines for $15,000/mile.

Mississippi has substantial potential for solar power, though it remains an underutilized generation method. The rate of installations has increased in recent years, reaching 438 MW of installed capacity in early 2023, ranking 36th among the states. Rooftop photovoltaics could provide 31.2% of all electricity used in Mississippi from 11,700 MW if solar panels were installed on every available roof.

Solar power in Oklahoma can provide 44.1% of all electricity used in Oklahoma from 19,300 MW of rooftop solar panels. This scenario is extremely unlikely though because the cost of electricity in Oklahoma is among the lowest in the nation.

Solar power in Alabama on rooftops could theoretically provide 29.8% of all electricity used in Alabama, with 20,400 MW of solar panels potentially installed on rooftops.
Solar power in Illinois has been increasing, as the cost of photovoltaics has decreased. As of the end of 2020, Illinois had 465 megawatts (MW) of installed photovoltaic and concentrated solar power capacity combined employing over 5,200 jobs. Illinois adopted a net metering rule which allows customers generating up to 40 kW to use net metering, with the kilowatt hour surplus rolled over each month, and lost at the end of either April or October, as selected by the customer. In 2011, the limit was raised to 2 MW, but is not net metering, as the term is commonly known, as it uses two meters for systems larger than 40 kW.
Solar power in Missouri has been a growing industry since the early 2010s. Solar power is capable of generating 42.7% of the electricity used in Missouri from rooftop solar panels totaling 28,300 MW.
Solar power in Idaho comprised 550 MW in 2019. A 2016 report by the National Renewable Energy Laboratory estimated that rooftops alone have the potential to host 4,700 MW of solar panels, and thus provide 26.4% of all electricity used in Idaho. A large increase in the state's solar generating capacity began starting year 2015 when 461 MW of solar power was contracted to be built in Idaho.

Solar power in Montana on rooftops could provide 28% of all electricity used in Montana from 3,200 MW of solar panels.

Solar power in Vermont provides almost 11% of the state's in-state electricity production as of 2018. A 2009 study indicated that distributed solar on rooftops can provide 18% of all electricity used in Vermont. A 2012 estimate suggests that a typical 5 kW system costing $25,000 before credits and utility savings will pay for itself in 10 years, and generate a profit of $34,956 over the rest of its 25-year life.
Instead, we can turn to 8minutenergy's 300-megawatt Eagle Shadow Mountain Solar Farm, which clocks in at a flat rate of $23.76 per megawatt-hour throughout its 25-year PPA term.
{{cite web}}: CS1 maint: multiple names: authors list (link)