
Solar power in New Mexico in 2016 generated 2.8% [1] of the state's total electricity consumption, [2] despite a National Renewable Energy Laboratory (NREL) projection suggesting a potential contribution three orders of magnitude larger. [3]
Solar power in New Mexico in 2016 generated 2.8% [1] of the state's total electricity consumption, [2] despite a National Renewable Energy Laboratory (NREL) projection suggesting a potential contribution three orders of magnitude larger. [3]

The New Mexico Renewable Portfolio Standard calls for 20% renewable energy by 2020, and 4% from solar power from investor owned utilities, and 10% renewable from rural electric cooperatives. Renewable Energy Certificates, (RECs), may be sold through the Western Renewable Energy Generation Information System (WREGIS). [4]

| New Mexico Solar Capacity (MWp) [5] [6] [7] [8] [9] | ||||||
|---|---|---|---|---|---|---|
| Year | Photovoltaics | |||||
| Capacity | Installed | % Change | ||||
| 2007 | 0.5 | 0.2 | 67% | |||
| 2008 | 1.0 | 0.6 | 100% | |||
| 2009 | 2.4 | 1.4 | 140% | |||
| 2010 | 43.3 | 40.9 | 1704% | |||
| 2011 | 165.5 | 122.1 | 282% | |||
| 2012 | 203.4 | 37.9 | 23% | |||
| 2013 | 256.6 | 49.1 | 24% | |||
| 2014 | 325 | 68.4 | 27% | |||
| 2015 | 365 | 41 | 13% | |||
| 2016 | 630 | 265 | 73% | |||
| 2017 | 695 | 65 | 10% | |||
| 2018 | 792 | 97 | 14% | |||
| 2019 | 905.4 | 113.4 | 14% | |||
| 2020 | 1,196.9 | 291.5 | 32% | |||
| 2021 | 1,270.4 | 73.5 | % | |||
| 2022 | 1,483 | 212.6 | % | |||
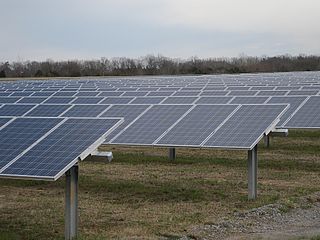
The 30 MW Cimarron Solar Facility became the largest solar farm in the state in 2011. It was surpassed by the 52 MW Macho Springs Solar Facility in 2014, and by the combined 140 MW Roswell and Chavez County Solar Energy Centers in 2016.
As of July 29, 2008, New Mexico has one of the most generous metering laws in the country, and covers all systems up to 80 MW. Excess generation of less than $50 is rolled over to the next month; over that is paid to the consumer. [10]
As of January 2012, no concentrated solar power (CSP) plants are currently planned for New Mexico since the addition of the first 6 MW in the state in 2011. Though NREL claims the state has the "technical potential" to install 4,860,000 MW of CSP covering 47% of the area of the state, at 2017 prices such a proposal would require a total overnight cost of $18,992,880,000,000 ($18 trillion), [11] or 3,392 times the state's annual budget. [12] Even if such a feat were financially feasible, critics note New Mexico would remain dependent on burning coal and "natural gas" (fossil fuel methane) to compensate for the loss of solar at night and during cloudy weather. Thermal storage permits CSP generation to be stored and used as needed, but with a round-trip efficiency of only 38% [13] it is not currently cost-effective at a scale necessary to maintain grid reliability. [14]
Parabolic trough solar systems have been determined to be the most cost effective large systems[ citation needed ], and in July 2008 New Mexico's utilities combined to release an RFP for a parabolic trough solar system to generate from 211,000 and 375,000 megawatt-hours (MW·h) per year by 2012. [15] [16]
Sandia National Laboratories has been testing solar thermal devices at Sandia’s National Solar Thermal Test Facility (NSTTF). On January 31, 2008, a Sterling solar dish system set a solar-to-grid system conversion efficiency record of 31.25 percent net efficiency. The previous record was 29.4 percent, set in 1984. [17]
Radio station KTAO, in Taos, is the largest solar powered radio station in the United States. [18]
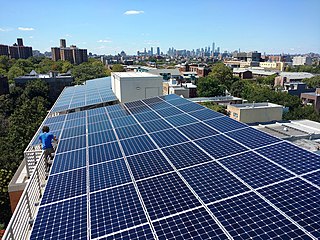
Solar power includes solar farms as well as local distributed generation, mostly on rooftops and increasingly from community solar arrays. In 2022, utility-scale solar power generated 145.6 terawatt-hours (TWh), or 3.4% of electricity in the United States. Total solar generation that year, including estimated small-scale photovoltaic generation, was 204 TWh.
Solar power in Nevada is growing due to a Renewable Portfolio Standard which requires 50% renewable energy by 2030. The state has abundant open land areas and some of the best solar potential in the country.

Solar power in Florida has been increasing, as the cost of solar power systems using photovoltaics (PV) has decreased in recent years. Florida has low electricity costs compared with other states, which makes individual solar investment less attractive. Florida ranks ninth nationally in solar resource strength according to the National Renewable Energy Laboratory and tenth in solar generation by the Solar Energy Industries Association.

Solar power in Texas, a portion of total energy in Texas, includes utility-scale solar power plants as well as local distributed generation, mostly from rooftop photovoltaics. The western portion of the state especially has abundant open land areas, with some of the greatest solar and wind potential in the country. Development activities there are also encouraged by relatively simple permitting and significant available transmission capacity.

Solar power in Connecticut establishes Connecticut as the second state in the US to reach grid parity, after Hawaii, due to the high average cost of electricity. Installing solar panels for a home provides an estimated 15.6% return on investment.

Solar power in Nebraska is used for only a very small percentage of the state's electricity, although it is rapidly becoming competitive with grid electricity, due to the decrease in cost and the eight-year extension to the 30% tax credit, which can be used to install systems of any size. In 2015, the state ranked 47th among the 50 U.S. states with 1.1 MW of installed capacity.

As of the first quarter of 2023, Washington State has 604 MW of solar power electricity generation. This is an increase from about 300 MW in 2021 and 27 MW in 2013.

Solar power in Louisiana is ranked 34th for installed solar PV capacity as of 2017 by the Solar Energy Industry Association. The state's "solar friendliness" according to Solar Power Rocks has fallen to 50th place for 2018 as the state credit program ends and full 1:1 retail net metering is being phased out. Taxpayers still benefit from federal incentive programs such as the 30 percent tax credit, which applies to business and residential solar photovoltaic and thermal energy systems of any size.

Solar power in Kentucky has been growing in recent years due to new technological improvements and a variety of regulatory actions and financial incentives, particularly a 30% federal tax credit, available through 2016, for any size project. Kentucky could generate 10% of all of the electricity used in the United States from land cleared from coal mining in the state. Covering just one-fifth with photovoltaics would supply all of the state's electricity.

Solar power in Ohio has been increasing, as the cost of photovoltaics has decreased. Ohio installed 10 MW of solar in 2015. Ohio adopted a net metering rule which allows any customer generating up to 25 kW to use net metering, with the kilowatt hour surplus rolled over each month, and paid by the utility once a year at the generation rate upon request. For hospitals there is no limit on size, but two meters are required, one for generation, the other for utility supplied power.

Solar power in Indiana has been growing in recent years due to new technological improvements and a variety of regulatory actions and financial incentives, particularly a 30% federal tax credit for any size project.

Solar power in Iowa is limited but growing, with 137 megawatts (MW) installed by the end of 2019 and 27 MW installed during that year, ranking the state 40th among U.S. states. Iowa also generated 0.23% of the state's total electricity production in 2019 from solar energy; an amount sufficient to power over 17,000 Iowa homes. The state's early position as a major wind-power provider may have limited early large-scale solar investment.

Solar power in South Dakota has high potential but little practical application. The state ranked 50th among U.S. states in installed solar polar in 2015 with no utility-scale or large commercial systems. Photovoltaic panels on rooftops can provide 38.7% of all electricity used in South Dakota using 3,800 MW of solar panels. The state is ranked 14th in the country in solar power potential, and 4th in wind potential.

Solar power in Maine on rooftops, utilizing 6,300 megawatts (MW) of solar panels, can provide 60% of the electricity used in Maine according to a 2016 U.S. Department of Energy study. Maine and Vermont are tied for the second highest rooftop solar potential in the country, only behind the state of California. A 2020 estimate suggests that a typical 5.6 kilowatt (kW) residential system will pay for itself in 6-7 years and generate a profit of $45,000 over the rest of its 25-year life from the tax credits and utility savings.

Solar power in Oklahoma can provide 44.1% of all electricity used in Oklahoma from 19,300 MW of rooftop solar panels. This scenario is extremely unlikely though because the cost of electricity in Oklahoma is among the lowest in the nation.

Solar power in Minnesota expanded significantly in the early 2010s as a result of the cost decrease of photovoltaics and favorable policies. By 2016, it began to grow quickly.
Solar power in Idaho comprised 550 MW in 2019. A 2016 report by the National Renewable Energy Laboratory estimated that rooftops alone have the potential to host 4,700 MW of solar panels, and thus provide 26.4% of all electricity used in Idaho. A large increase in the state's solar generating capacity began starting year 2015 when 461 MW of solar power was contracted to be built in Idaho.

Solar power in New Hampshire provides a small percentage of the state's electricity. State renewable requirements and declining prices have led to some installations. Photovoltaics on rooftops can provide 53.4% of all electricity used in New Hampshire, from 5,300 MW of solar panels, and 72% of the electricity used in Concord, New Hampshire. A 2016 estimate suggests that a typical 5 kW system costing $25,000 before credits and utility savings will pay for itself in 9 years, and generate a profit of $34,196 over the rest of its 25-year life. A loan or lease provides a net savings each year, including the first year. New Hampshire has a rebate program which pays $0.75/W for residential systems up to 5 kW, for up to 50% of the system cost, up to $3,750. However, New Hampshire's solar installation lagged behind nearby states such as Vermont and New York, which in 2013 had 10 times and 25 times more solar, respectively.

Solar power in Vermont provides almost 11% of the state's in-state electricity production as of 2018. A 2009 study indicated that distributed solar on rooftops can provide 18% of all electricity used in Vermont. A 2012 estimate suggests that a typical 5 kW system costing $25,000 before credits and utility savings will pay for itself in 10 years, and generate a profit of $34,956 over the rest of its 25-year life.
Solar power in Tennessee is capable of producing much of the state's electricity; however, the industry remains in early stages in the state. With 129 MW of solar power in 2015, Tennessee ranked 20th among states for installed solar capacity.