Solar power in Maine

Last updated
Solar panels As solar firmengebaude.jpg
Solar panels

Solar power in Maine on rooftops, utilizing 6,300 megawatts (MW) of solar panels, can provide 60% of the electricity used in Maine according to a 2016 U.S. Department of Energy study. Maine and Vermont are tied for the second highest rooftop solar potential in the country, only behind the state of California. [1] A 2020 estimate suggests that a typical 5.6 kilowatt (kW) residential system will pay for itself in 6-7 years and generate a profit of $45,000 over the rest of its 25-year life from the tax credits and utility savings. [2]

Contents

Net metering is available to all consumers for up to at least 100 kW generation. Excess generation is rolled over each month but is lost at the end of each year. [3] Maine provides a range of additional programs to incentive efficient energy use, as well as promote the transition to solar and other forms of renewable energy. [4]

Statistics

Installed capacity

Solar insolation in Maine is roughly 33% greater than Germany, the leader in solar installations in 2012.

Solar power in Maine
Source: NREL [5]
Grid-Connected PV Capacity (MW) [6] [7] [8] [9] [10] [11] [12] [13] [14]
YearCapacityInstalled% Change
20070.2
20080.30.150%
20090.30%
20100.50.267%
20111.10.6120%
20122.81.7154%
20135.32.589%
201412.77.4140%
201519.46.753%
201624.14.724%
201742.518.476%
201867.725.259%
201985.217.526%
2020170.785.5100%
2021440.5269.8135%
2022622181.5 %

Utility-scale generation

Utility-scale solar generation in Maine (GWh) [15]
YearTotalJanFebMarAprMayJunJulAugSepOctNovDec
20175000001111100
201811011111111111
20197001111111000
202028002330333254
202111566111113242123

Net-metering policy revisions

In early 2017, the Maine Public Utilities Commission (PUC) made a decision to phase out solar credits over 15 years. Current customers and new customers up until January 1, 2018 would be grandfathered and receive the current incentives and terms as of 2017. The policy applied to residential solar customers only, not large-scale or community projects. The decision was the result of the commission effort to find a middle ground between solar supporters and opponents of net metering. [16] [17]

Maine Gov. Paul LePage "lambasted the utility regulators" in a "rare press conference." He said he wants all three commissioners replaced immediately because of their decision. (He appointed all three of them to their seats). He also said that he wants to possibly expand the commission from three seats to five seats. [17]

The net-metering policy in force prior to 2017 was restored in April 2019 under Maine Gov. Janet Mills. [18]

Notable and large installations

In October 2007, Maine's largest solar array was the 15.12 kW solar array installed at Maple Hill Farm in Hallowell for $166,000, [19] which through June 11, 2012 has generated 73,416 kWh. [20] Since then average solar costs have dropped substantially, and continue to decline.

In 2011 Maine's largest solar array, 41 kW, was installed on the roof of a new, LEED Platinum grocery store in Augusta. [21] [22] A 500 kW system is proposed for otherwise unusable land at the former Loring Air Force Base. [23]

A 9.9 MW solar farm was proposed for Monroe, to be built in 2016. [24]

In November 2021 a 76.5 MW solar array opened in Farmington as the largest in New England. [25]

See also

Related Research Articles

<span class="mw-page-title-main">Solar power in Kentucky</span>

Solar power in Kentucky has been growing in recent years due to new technological improvements and a variety of regulatory actions and financial incentives, particularly a 30% federal tax credit, available through 2016, for any size project. Kentucky could generate 10% of all of the electricity used in the United States from land cleared from coal mining in the state. Covering just one-fifth with photovoltaics would supply all of the state's electricity.

<span class="mw-page-title-main">Solar power in Ohio</span> Overview of solar power in the U.S. state of Ohio

Solar power in Ohio has been increasing, as the cost of photovoltaics has decreased. Ohio installed 10 MW of solar in 2015. Ohio adopted a net metering rule which allows any customer generating up to 25 kW to use net metering, with the kilowatt hour surplus rolled over each month, and paid by the utility once a year at the generation rate upon request. For hospitals there is no limit on size, but two meters are required, one for generation, the other for utility supplied power.

<span class="mw-page-title-main">Solar power in Rhode Island</span> Overview of solar power in the U.S. state of Rhode Island

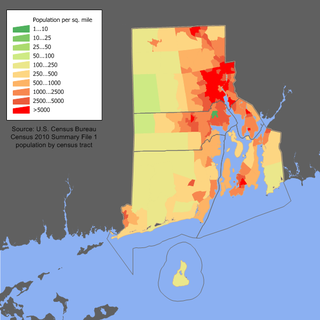
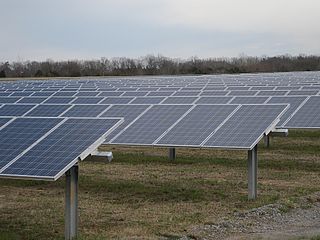
Solar power in Rhode Island has become economical due to new technological improvements and a variety of regulatory actions and financial incentives, particularly a 30% federal tax credit, available through 2016, for any size project. A typical residential installation could pay for itself in utility bill savings in 14 years, and generate a profit for the remainder of its 25 year life. Larger systems, from 10 kW to 5 MW, receive a feed-in tariff of up to 33.45¢/kWh.

<span class="mw-page-title-main">Solar power in Indiana</span> Overview of solar power in the U.S. state of Indiana

Solar power in Indiana has been growing in recent years due to new technological improvements and a variety of regulatory actions and financial incentives, particularly a 30% federal tax credit for any size project.

<span class="mw-page-title-main">Solar power in Kansas</span> Overview of solar power in the U.S. state of Kansas

Solar power in Kansas has been growing in recent years due to new technological improvements and a variety of regulatory actions and financial incentives.

<span class="mw-page-title-main">Solar power in West Virginia</span> Electricity from sunlight in one U.S. state

Solar power in West Virginia on rooftops can provide 23% of all electricity used in West Virginia from 6,300 MW of solar panels, but West Virginia will be the last state in the United States to reach grid parity - the point where solar panels are cheaper than grid electricity - without incentives, due to the low cost of electricity - about $0.062/kWh. The point where grid parity is reached is a product of the average insolation and the average cost of electricity. At $0.062/kWh and 4.3 sun-hours/day, solar panels would need to come down to ~$1,850/kW installed to achieve grid parity. The first state in the US to achieve grid parity was Hawaii. Solar power's favorable carbon footprint compared to fossil fuels is a major motivation for expanding renewable energy in the state, especially when compared to coal to generate electrical power.

<span class="mw-page-title-main">Solar power in Oklahoma</span> Overview of solar power in the U.S. state of Oklahoma

Solar power in Oklahoma can provide 44.1% of all electricity used in Oklahoma from 19,300 MW of rooftop solar panels. This scenario is extremely unlikely though because the cost of electricity in Oklahoma is among the lowest in the nation.

<span class="mw-page-title-main">Solar power in Arkansas</span> Overview of solar power in the U.S. state of Arkansas

Solar power in Arkansas on rooftops can provide 33.3% of all electricity used in Arkansas from 12,200 MW of solar panels.

<span class="mw-page-title-main">Solar power in Alabama</span> Overview of solar power in the U.S. state of Alabama

Solar power in Alabama on rooftops could theoretically provide 29.8% of all electricity used in Alabama, with 20,400 MW of solar panels potentially installed on rooftops.

<span class="mw-page-title-main">Solar power in Minnesota</span> Overview of solar power in the U.S. state of Minnesota

Solar power in Minnesota expanded significantly in the early 2010s as a result of the cost decrease of photovoltaics and favorable policies. By 2016, it began to grow quickly.

<span class="mw-page-title-main">Solar power in Maryland</span> Overview of solar power in the U.S. state of Maryland

Solar power in Maryland is supported by the state's legislation regarding the Renewable Portfolio Standard and Solar Renewable Energy Credit (SREC) program. The target for renewable energy as of 2017 is 20% by 2020, including 2% from solar power.

<span class="mw-page-title-main">Solar power in Missouri</span> Overview of solar power in the U.S. state of Missouri

Solar power in Missouri has been a growing industry since the early 2010s. Solar power is capable of generating 42.7% of the electricity used in Missouri from rooftop solar panels totaling 28,300 MW.

<span class="mw-page-title-main">Solar power in Idaho</span> Solar power in Idaho

Solar power in Idaho comprised 550 MW in 2019. A 2016 report by the National Renewable Energy Laboratory estimated that rooftops alone have the potential to host 4,700 MW of solar panels, and thus provide 26.4% of all electricity used in Idaho. A large increase in the state's solar generating capacity began starting year 2015 when 461 MW of solar power was contracted to be built in Idaho.

<span class="mw-page-title-main">Solar power in Montana</span> Overview of solar power in the U.S. state of Montana

Solar power in Montana on rooftops could provide 28% of all electricity used in Montana from 3,200 MW of solar panels.

<span class="mw-page-title-main">Solar power in New Hampshire</span> Overview of solar power in the U.S. state of New Hampshire

Solar power in New Hampshire provides a small percentage of the state's electricity. State renewable requirements and declining prices have led to some installations. Photovoltaics on rooftops can provide 53.4% of all electricity used in New Hampshire, from 5,300 MW of solar panels, and 72% of the electricity used in Concord, New Hampshire. A 2016 estimate suggests that a typical 5 kW system costing $25,000 before credits and utility savings will pay for itself in 9 years, and generate a profit of $34,196 over the rest of its 25-year life. A loan or lease provides a net savings each year, including the first year. New Hampshire has a rebate program which pays $0.75/W for residential systems up to 5 kW, for up to 50% of the system cost, up to $3,750. However, New Hampshire's solar installation lagged behind nearby states such as Vermont and New York, which in 2013 had 10 times and 25 times more solar, respectively.

<span class="mw-page-title-main">Solar power in Vermont</span> Overview of solar power in the U.S. state of Vermont

Solar power in Vermont provides almost 11% of the state's in-state electricity production as of 2018. A 2009 study indicated that distributed solar on rooftops can provide 18% of all electricity used in Vermont. A 2012 estimate suggests that a typical 5 kW system costing $25,000 before credits and utility savings will pay for itself in 10 years, and generate a profit of $34,956 over the rest of its 25-year life.

<span class="mw-page-title-main">Solar power in Wisconsin</span> Overview of solar power in the U.S. state of Wisconsin

Solar power in Wisconsin In 2026, Wisconsin rooftops can accommodate approximately 37 GWs of solar capacity and produce 44,183 GWh of electricity, nearly 70% of the statewide generation in 2019. Net metering is available for systems up to at least 20 kW, and excess generation is credited at retail rate to customers next bill. Some utilities allow net metering up to 100 kW. For Xcel customers, kilowatt credits are rolled over monthly and are reconciled annually at avoided cost. Best practices recommend no limits, either individually or aggregate, and perpetual roll over of kilowatt credits.

<span class="mw-page-title-main">Solar power in Delaware</span>

Solar power in Delaware is small industry. Delaware had 150 MW of total installed capacity in 2020. The largest solar farms in the state included the 10 MW Dover Sun Park and the 12 MW Milford Solar Farm.

<span class="mw-page-title-main">Solar power in Pennsylvania</span> Overview of solar power in the U.S. state of Pennsylvania

Solar power in Pennsylvania currently provides less than 1% of the state's electricity, but there are many policies in place to regulate and incentivize its use. Pennsylvania mandates the use of solar power through a renewable portfolio standard, which requires a percentage of electricity from each providers to come from solar, and net metering, which compensates small-scale solar generation through net metering. By 2021, Pennsylvania was required to have 0.5% of its electricity from solar. Their following goal is 10% by 2030. Solar power could theoretically provide over 30% of the state's electricity, but growth in solar generation has slowed due to a reduction in solar grants and the low price of solar energy credits. Efforts have also seen blowback from citizens, most notably from Mount Joy Township. Although, Pennsylvania has ruled solar as a legal use, meaning local governments can only restrict size and placement, but can't disband the projects.

<span class="mw-page-title-main">Solar power in Tennessee</span> Overview of solar power in the U.S. state of Tennessee

Solar power in Tennessee is capable of producing much of the state's electricity; however, the industry remains in early stages in the state. With 129 MW of solar power in 2015, Tennessee ranked 20th among states for installed solar capacity.

References

  1. Pieter Gagnon, Robert Margolis, Jennifer Melius, Caleb Phillips, and Ryan Elmore (January 31, 2016). "Rooftop Solar Photo voltaic Technical Potential in the United States" (PDF). National Renewable Energy Laboratory.{{cite web}}: CS1 maint: multiple names: authors list (link)
  2. "Solar Reviews - Maine". www.solarreviews.com. Retrieved 2020-12-30.
  3. "Maine Public Utilities Commission Regulatory Rule - Customer Net Energy Billing" (PDF). www.maine.gov. Retrieved 2020-12-30. This rule was approved as to form and legality by the Attorney General on December 15, 1998. It was filed with the Secretary of State on December 15, 1998 and will be effective on December 20, 1998.
  4. "Maine energy programs". www.dsireusa.org. Retrieved 2020-12-30. DSIRE is the most comprehensive source of information on incentives and policies that support renewables and energy efficiency in the United States. Established in 1995, DSIRE is operated by the N.C. Clean Energy Technology Center at N.C. State University and receives support from EnergySage.
  5. "PV Watts". NREL. Retrieved 11 June 2012.
  6. Sherwood, Larry (August 2012). "U.S. Solar Market Trends 2011" (PDF). Interstate Renewable Energy Council (IREC). p. 16. Archived from the original (PDF) on 2012-09-06. Retrieved 2012-08-16.
  7. Sherwood, Larry (June 2011). "U.S. Solar Market Trends 2010" (PDF). Interstate Renewable Energy Council (IREC). Retrieved 2011-06-29.
  8. Sherwood, Larry (July 2010). "U.S. Solar Market Trends 2009" (PDF). Interstate Renewable Energy Council (IREC). Archived from the original (PDF) on 2010-09-25. Retrieved 2010-07-28.
  9. Sherwood, Larry (July 2009). "U.S. Solar Market Trends 2008" (PDF). Interstate Renewable Energy Council (IREC). Archived from the original (PDF) on 2009-11-23. Retrieved 2010-07-24.
  10. Sherwood, Larry (August 2008). "U.S. Solar Market Trends 2007" (PDF). Interstate Renewable Energy Council (IREC). Retrieved 2010-07-24.[ permanent dead link ]
  11. Sherwood, Larry (July 2009). "U.S. Solar Market Trends 2008" (PDF). Interstate Renewable Energy Council (IREC). p. 16. Archived from the original (PDF) on 2009-11-23. Retrieved 2010-07-24.
  12. Sherwood, Larry (July 2012). "U.S. Solar Market Trends 2012" (PDF). Interstate Renewable Energy Council (IREC). p. 16. Retrieved 2013-10-11.
  13. Sherwood, Larry (July 2014). "U.S. Solar Market Trends 2013" (PDF). Interstate Renewable Energy Council (IREC). Retrieved 2014-09-26.
  14. Maine Solar
  15. "Electricity Data Browser". U.S. Department of Energy. March 28, 2018. Retrieved October 8, 2021.
  16. "Maine PUC approves revisions to net energy billing that impact rooftop solar". Daily Energy Insider. 2017-01-31. Retrieved 2017-02-22.
  17. 1 2 "Maine Gov. LePage calls for utility regulators to resign over solar net metering decision". Utility Dive. Retrieved 2017-02-22.
  18. "Governor Mills Signs Legislation to Restore Net Metering & Incentivize Growth of Solar Power in Maine". www.maine.gov/governor. 2019-04-02.
  19. Maine’s Largest Solar Array Built at Maple Hill Farm in Hallowell
  20. Solar Savings
  21. Hannaford set to open greenest grocery store
  22. LEED Platinum Hannaford in Augusta, Maine
  23. Loring officials envision solar farm on otherwise unusable brownfield
  24. Maine’s largest solar farm expected to go online in 2016
  25. "New England's biggest solar project is catching some rays". AP NEWS. 2021-11-21. Retrieved 2022-09-26.