
In geography, latitude is a geographic coordinate that specifies the north–south position of a point on the Earth's surface. Latitude is an angle which ranges from 0° at the Equator to 90° at the poles. Lines of constant latitude, or parallels, run east–west as circles parallel to the equator. Latitude is used together with longitude to specify the precise location of features on the surface of the Earth. On its own, the term latitude should be taken to be the geodetic latitude as defined below. Briefly, geodetic latitude at a point is the angle formed by the vector perpendicular to the ellipsoidal surface from that point, and the equatorial plane. Also defined are six auxiliary latitudes that are used in special applications.

The Mercator projection is a cylindrical map projection presented by Flemish geographer and cartographer Gerardus Mercator in 1569. It became the standard map projection for navigation because it is unique in representing north as up and south as down everywhere while preserving local directions and shapes. The map is thereby conformal. As a side effect, the Mercator projection inflates the size of objects away from the equator. This inflation is very small near the equator but accelerates with increasing latitude to become infinite at the poles. So, for example, landmasses such as Greenland and Antarctica appear far larger than they actually are relative to landmasses near the equator, such as Central Africa.

In mathematics, a spherical coordinate system is a coordinate system for three-dimensional space where the position of a point is specified by three numbers: the radial distance of that point from a fixed origin, its polar angle measured from a fixed zenith direction, and the azimuthal angle of its orthogonal projection on a reference plane that passes through the origin and is orthogonal to the zenith, measured from a fixed reference direction on that plane. It can be seen as the three-dimensional version of the polar coordinate system.

A geographic coordinate system (GCS) is a coordinate system associated with positions on Earth. A GCS can give positions:
In cartography, a map projection is a way to flatten a globe's surface into a plane in order to make a map. This requires a systematic transformation of the latitudes and longitudes of locations from the surface of the globe into locations on a plane. All projections of a sphere on a plane necessarily distort the surface in some way and to some extent. Depending on the purpose of the map, some distortions are acceptable and others are not; therefore, different map projections exist in order to preserve some properties of the sphere-like body at the expense of other properties. The study of map projections is the characterization of the distortions. There is no limit to the number of possible map projections. Projections are a subject of several pure mathematical fields, including differential geometry, projective geometry, and manifolds. However, "map projection" refers specifically to a cartographic projection.

In geometry, the stereographic projection is a particular mapping (function) that projects a sphere onto a plane. The projection is defined on the entire sphere, except at one point: the projection point. Where it is defined, the mapping is smooth and bijective. It is conformal, meaning that it preserves angles at which curves meet. It is neither isometric nor area-preserving: that is, it preserves neither distances nor the areas of figures.

Earth radius is the distance from the center of Earth to a point on its surface. Its value ranges from 6,378 km (3,963 mi) at the equator to 6,357 km (3,950 mi) at a pole. A nominal Earth radius is sometimes used as a unit of measurement in astronomy and geophysics, denoted in astronomy by the symbol R⊕. In other contexts, it is denoted or sometimes .

In navigation, a rhumb line, rhumb, or loxodrome is an arc crossing all meridians of longitude at the same angle, that is, a path with constant bearing as measured relative to true or magnetic north.
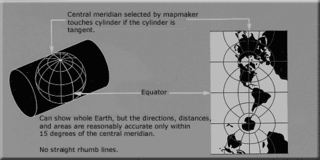
The transverse Mercator map projection is an adaptation of the standard Mercator projection. The transverse version is widely used in national and international mapping systems around the world, including the Universal Transverse Mercator. When paired with a suitable geodetic datum, the transverse Mercator delivers high accuracy in zones less than a few degrees in east-west extent.

The use of orthographic projection in cartography dates back to antiquity. Like the stereographic projection and gnomonic projection, orthographic projection is a perspective projection, in which the sphere is projected onto a tangent plane or secant plane. The point of perspective for the orthographic projection is at infinite distance. It depicts a hemisphere of the globe as it appears from outer space, where the horizon is a great circle. The shapes and areas are distorted, particularly near the edges.

The azimuthal equidistant projection is an azimuthal map projection. It has the useful properties that all points on the map are at proportionally correct distances from the center point, and that all points on the map are at the correct azimuth (direction) from the center point. A useful application for this type of projection is a polar projection which shows all meridians as straight, with distances from the pole represented correctly. The flag of the United Nations contains an example of a polar azimuthal equidistant projection.

The scale of a map is the ratio of a distance on the map to the corresponding distance on the ground. This simple concept is complicated by the curvature of the Earth's surface, which forces scale to vary across a map. Because of this variation, the concept of scale becomes meaningful in two distinct ways.

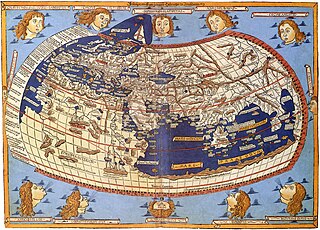
The equirectangular projection is a simple map projection attributed to Marinus of Tyre, who Ptolemy claims invented the projection about AD 100. The projection maps meridians to vertical straight lines of constant spacing, and circles of latitude to horizontal straight lines of constant spacing. The projection is neither equal area nor conformal. Because of the distortions introduced by this projection, it has little use in navigation or cadastral mapping and finds its main use in thematic mapping. In particular, the plate carrée has become a standard for global raster datasets, such as Celestia and NASA World Wind, because of the particularly simple relationship between the position of an image pixel on the map and its corresponding geographic location on Earth.
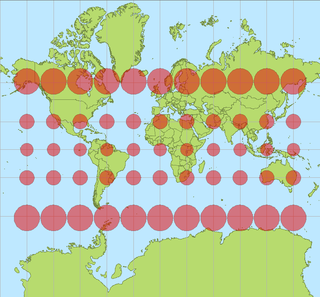
In cartography, a Tissot's indicatrix is a mathematical contrivance presented by French mathematician Nicolas Auguste Tissot in 1859 and 1871 in order to characterize local distortions due to map projection. It is the geometry that results from projecting a circle of infinitesimal radius from a curved geometric model, such as a globe, onto a map. Tissot proved that the resulting diagram is an ellipse whose axes indicate the two principal directions along which scale is maximal and minimal at that point on the map.

A Lambert conformal conic projection (LCC) is a conic map projection used for aeronautical charts, portions of the State Plane Coordinate System, and many national and regional mapping systems. It is one of seven projections introduced by Johann Heinrich Lambert in his 1772 publication Anmerkungen und Zusätze zur Entwerfung der Land- und Himmelscharten.

The Lambert azimuthal equal-area projection is a particular mapping from a sphere to a disk. It accurately represents area in all regions of the sphere, but it does not accurately represent angles. It is named for the Swiss mathematician Johann Heinrich Lambert, who announced it in 1772. "Zenithal" being synonymous with "azimuthal", the projection is also known as the Lambert zenithal equal-area projection.
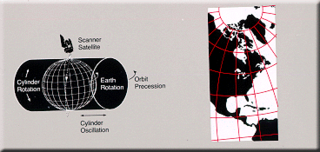
Space-oblique Mercator projection is a map projection devised in the 1970s for preparing maps from Earth-survey satellite data. It is a generalization of the oblique Mercator projection that incorporates the time evolution of a given satellite ground track to optimize its representation on the map. The oblique Mercator projection, on the other hand, optimizes for a given geodesic.

The Cassini projection is a map projection described by César-François Cassini de Thury in 1745. It is the transverse aspect of the equirectangular projection, in that the globe is first rotated so the central meridian becomes the "equator", and then the normal equirectangular projection is applied. Considering the earth as a sphere, the projection is composed of the operations:
In cartography, a conformal map projection is one in which every angle between two curves that cross each other on Earth is preserved in the image of the projection, i.e. the projection is a conformal map in the mathematical sense. For example, if two roads cross each other at a 39° angle, then their images on a map with a conformal projection cross at a 39° angle.

The Gall stereographic projection, presented by James Gall in 1855, is a cylindrical projection. It is neither equal-area nor conformal but instead tries to balance the distortion inherent in any projection.


