Vancouver Centre

Last updated

Vancouver Centre
Flag of British Columbia.svg British Columbia electoral district
Vancouver Centre (Canadian electoral district).svg
Vancouver Centre in relation to other electoral districts in the Vancouver area
Federal electoral district
Legislature House of Commons
MP


Hedy Fry
Liberal
District created1914
First contested 1917
Last contested 2021
District webpage profile, map
Demographics
Population (2021) [1] 126,995
Electors (2021)91,276
Area (km²) [2] 11.20
Pop. density (per km²)11,338.8
Census division(s) Metro Vancouver
Census subdivision(s) Vancouver

Vancouver Centre (French : Vancouver-Centre) is a federal electoral district in British Columbia, Canada, that has been represented in the House of Commons of Canada since 1917. It is the riding with the biggest Japanese community in Canada. As per the 2021 census, 2.4% of the population of Vancouver-Centre is Japanese. [3]

Contents

Geography

The riding includes the neighbourhoods of Yaletown, the West End, Coal Harbour, Downtown Vancouver, western Strathcona, eastern Kitsilano, and False Creek South. The heavily urbanized electoral district is by far the most densely populated in Western Canada, with most of its residents living in mid and high rise apartments. The riding has a diverse, multi-generational demographic.

Demographics

According to the Canada 2021 Census
Panethnic groups in Vancouver Centre (2011−2021)
Panethnic
group
2021 [5] 2016 [6] 2011 [7]
Pop. %Pop.%Pop.%
European [lower-alpha 1] 70,67071,34565,120
East Asian [lower-alpha 2] 21,98519,50517,065
Middle Eastern [lower-alpha 3] 8,4556,6805,765
South Asian 6,2754,1502,990
Latin American 5,6503,4602,605
Southeast Asian [lower-alpha 4] 4,2653,5203,470
Indigenous 2,6152,3051,740
African 1,7301,3001,005
Other [lower-alpha 5] 2,8251,9301,275
Total responses124,475114,190101,040
Total population126,995116,443102,480
Notes: Totals greater than 100% due to multiple origin responses.
Demographics based on 2012 Canadian federal electoral redistribution riding boundaries.

History

The electoral district was created in 1914 from parts of Vancouver City riding.

Canada's longest-serving female Member of Parliament, Hedy Fry, has represented Vancouver Centre since 1993. Another high-profile MP was Kim Campbell, who served as Prime Minister for 132 days before being defeated by Fry.

The 2012 federal electoral boundaries redistribution concluded that the electoral boundaries of Vancouver Centre should be adjusted, and a modified electoral district of the same name will be contested in future elections. [8] The redefined Vancouver Centre loses a portion of its current territory from its southern end to the new district of Vancouver Granville. These new boundaries were legally defined in the 2013 representation order, which came into effect upon the call of the 42nd Canadian federal election, scheduled for October 2015. [9]

Members of Parliament

This riding has elected the following Members of Parliament:

ParliamentYearsMemberParty
Vancouver Centre
Riding created from Vancouver City
13th  1917–1921   Henry Herbert Stevens Government (Unionist)
14th  1921–1925   Conservative
15th  1925–1926
16th  1926–1930
17th  1930–1935   Ian Alistair Mackenzie Liberal
18th  1935–1940
19th  1940–1945
20th  1945–1948
 1948–1949   Rodney Young Co-operative Commonwealth
21st  1949–1953   Ralph Campney Liberal
22nd  1953–1957
23rd  1957–1958   Douglas Jung Progressive Conservative
24th  1958–1962
25th  1962–1963   John Robert Nicholson Liberal
26th  1963–1965
27th  1965–1968
28th  1968–1972 Ron Basford
29th  1972–1974
30th  1974–1979
31st  1979–1980 Art Phillips
32nd  1980–1984   Pat Carney Progressive Conservative
33rd  1984–1988
34th  1988–1993 Kim Campbell
35th  1993–1997   Hedy Fry Liberal
36th  1997–2000
37th  2000–2004
38th  2004–2006
39th  2006–2008
40th  2008–2011
41st  2011–2015
42nd  2015–2019
43rd  2019–2021
44th  2021–present

Current Member of Parliament

Its current Member of Parliament is Hedy Fry, a former physician. She was first elected in 1993, and is a member of the Liberal Party of Canada.

Election results

Graph of election results in Vancouver Centre (minor parties that never got 2% of the vote or didn't run consistently are omitted)
2021 Canadian federal election
PartyCandidateVotes%±%Expenditures
Liberal Hedy Fry 20,87340.44-1.74$87,773.26
New Democratic Breen Ouellette15,86930.74+7.00$80,950.83
Conservative Harry Cockell11,16221.62+2.35$20,505.00
Green Alaric Paivarinta2,0303.93-8.59$8,967.42
People's Taylor Singleton-Fookes1,6833.27+1.98$3,574.44
Total valid votes/expense limit51,61799.19$119,443.50
Total rejected ballots4220.81+0.16
Turnout52,03957.01-4.04
Eligible voters91,276
Liberal hold Swing -4.37
Source: Elections Canada [10] [11]
2019 Canadian federal election
PartyCandidateVotes%±%Expenditures
Liberal Hedy Fry 23,59942.18-13.90$90,613.92
New Democratic Breen Ouellette13,28023.74+3.72$35,726.92
Conservative David Cavey10,78219.27+2.36$32,539.03
Green Jesse Brown7,00212.52+6.71$28,503.30
People's Louise Kierans7241.29$4,907.84
Libertarian John Clarke3790.68-0.38$0.00
Independent Lily Bowman1420.25none listed
Independent Imtiaz Popat380.07$0.00
Total valid votes/expense limit55,94699.35
Total rejected ballots3640.65+0.22
Turnout56,31061.05-4.85
Eligible voters92,243
Liberal hold Swing -8.81
Source: Elections Canada [12] [13]
2015 Canadian federal election
PartyCandidateVotes%±%Expenditures
Liberal Hedy Fry 32,55456.08+25.06$126,090.21
New Democratic Constance Barnes11,61820.01-6.34$102,184.82
Conservative Elaine Allan9,81816.91-9.14$84,492.99
Green Lisa Barrett3,3705.81-9.27$45,728.01
Libertarian John Clarke6141.06+0.53
Marxist–Leninist Michael Hill740.13+0.02
Total valid votes/expense limit58,04899.58 $224,575.59
Total rejected ballots2470.42
Turnout58,29565.89
Eligible voters88,470
Liberal hold Swing +15.70
Source: Elections Canada [14] [15]
2011 federal election redistributed results [16]
PartyVote %
  Liberal 12,89431.02
  New Democratic 10,95226.35
  Conservative 10,82826.05
  Green 6,26715.08
 Others6221.50
2011 Canadian federal election
PartyCandidateVotes%±%
Liberal Hedy Fry 18,26031.03-3.47
New Democratic Karen Shillington15,32526.04+4.73
Conservative Jennifer Clarke15,32326.04+0.95
Green Adriane Carr 9,08915.44-2.87
Libertarian John Clarke3130.53-0.07
Progressive Canadian Michael Huenefeld2850.48
Pirate Travis McCrea1920.33
Marxist–Leninist Michael Hill620.11-0.05
Total valid votes58,849100.0  
Total rejected ballots1340.23
Turnout58,98359.23
Eligible voters99,527
Liberal hold Swing -4.10
2008 Canadian federal election
PartyCandidateVotes%±%Expenditures
Liberal Hedy Fry 19,50634.50-9.37$80,974
Conservative Lorne Mayencourt 14,18825.09+4.73$91,239
New Democratic Michael Byers 12,04721.31-7.34$85,957
Green Adriane Carr 10,35418.31+12.43$82,713
Libertarian John Clarke3400.60+0.07$0
Marxist–Leninist Michael Hill940.16
Total valid votes/expense limit56,529100.0   $94,404
Liberal hold Swing -7.05
2006 Canadian federal election
PartyCandidateVotes%±%Expenditures
Liberal Hedy Fry 25,01343.80+3.50$77,826
New Democratic Svend Robinson 16,37428.67-3.62$84,170
Conservative Tony Fogarassy11,68420.46+1.26$86,591
Green Jared Evans3,3405.84-0.94$1,008
Libertarian John Clarke3040.53-0.04
Marijuana HeathCliff Dion Campbell2590.45$115
Christian Heritage Joe Pal1300.22-0.24$389
Total valid votes57,104100.0  
Total rejected ballots1630.28-0.15
Turnout57,26762.06+0.59
Liberal hold Swing +3.56
2004 Canadian federal election
PartyCandidateVotes%±%Expenditures
Liberal Hedy Fry 21,28040.30-2.00$66,619
New Democratic Kennedy Stewart 17,05032.29+20.25$57,675
Conservative Gary Mitchell10,13919.20-18.70$73,789
Green Robbie Mattu3,5806.78+2.85$2,440
Libertarian John Clarke3040.57$60
Christian Heritage Joe Pal2430.46$389
Canadian Action Alexander Frei1010.19-1.08$100
Communist Kimball Cariou960.18+0.01$389
Total valid votes52,793100.0  
Total rejected ballots2260.43-0.05
Turnout53,01961.470.97
Liberal hold Swing -11.12
Change for the Conservatives is based on the combined totals of the Canadian Alliance and the Progressive Conservatives.
2000 Canadian federal election
PartyCandidateVotes%±%Expenditures
Liberal Hedy Fry 24,55342.30+1.54$69,017
Alliance John Mortimer15,17626.14+3.56$68,158
New Democratic Scott Robertson6,99312.04-8.83$8,841
Progressive Conservative Lee Johnson6,82811.76+2.52$4,047
Green Jamie Lee Hamilton 2,2853.93+0.93$3,945
Marijuana Marc Emery 1,1161.92
Canadian Action Jeff Jewell7421.27+0.24$547
Natural Law Valerie Laporte1770.30-0.12$40
Communist Kimball Cariou990.17$189
Marxist–Leninist Joseph Theriault750.12-0.10$364
Total valid votes58,044100.0  
Total rejected ballots2800.48-0.05
Turnout58,32460.50-4.22
Liberal hold Swing -1.01
Change for the Canadian Alliance is based on the Reform Party.
1997 Canadian federal election
PartyCandidateVotes%±%Expenditures
Liberal Hedy Fry 20,87840.76+9.57$54,905
Reform Richard Farbridge11,56722.58+5.12$24,846
New Democratic Bill Siksay 10,69020.87+5.69$27,133
Progressive Conservative Victoria Minnes4,7369.24-15.81$43,121
Green Paul Alexander1,5413.00+2.05$2,154
Independent Joseph Roberts7281.42$6,163
Canadian Action Connie Fogal 5281.03$12,986
Natural Law John Cowhig2170.42-0.62
Independent John Clarke1250.24$2,687
Marxist–Leninist Joseph Theriault1160.22$559
Independent Elvis Flostrand920.17$699
Total valid votes51,218100.0  
Total rejected ballots2720.53
Turnout51,49064.72
Liberal hold Swing +2.22
1993 Canadian federal election
PartyCandidateVotes%±%
Liberal Hedy Fry 19,31031.19+8.38
Progressive Conservative Kim Campbell 15,51025.05-12.19
Reform Ian Isbister10,80817.46+16.08
New Democratic Betty Baxter 9,39715.18-21.63
National Thorsten Ewald4,9497.99
Natural Law John Cowhig6431.04
Green Imtiaz Popat5860.95+0.14
Christian Heritage Darren Lowe2420.39
Libertarian Tunya Audain2200.36+0.11
Independent Brian Godzilla Gnu Salmi1140.18
Independent Scott Adams830.13-0.07
Commonwealth of Canada Lucille Boikoff250.04
Independent Peter C. Nuthall240.04
Total valid votes61,911100.0  
Liberal gain from Progressive Conservative Swing +10.28
1988 Canadian federal election
PartyCandidateVotes%±%
Progressive Conservative Kim Campbell 23,62037.24-5.99
New Democratic Johanna den Hertog23,35136.81+4.38
Liberal Tex Enemark14,46722.81+1.59
Reform Paula Folkard8761.38
Green Murray Gudmundson5140.81-0.25
Rhinoceros Bob Nitestalker Colebrook2620.41-0.56
Libertarian Duane H. Pye1560.25-0.38
Independent Scott Adams1250.20
Independent Dorothy-Jean O'Donnell580.09
Total valid votes63,429100.0  
Progressive Conservative hold Swing -5.18
1984 Canadian federal election
PartyCandidateVotes%±%
Progressive Conservative Pat Carney 21,70443.23+7.96
New Democratic Johanna den Hertog16,28332.43+0.66
Liberal Paul E. Manning10,65421.22-10.20
Green Paul Watson5331.06+0.95
Rhinoceros Danny Tripper Parro4870.97+0.25
Libertarian Paul A. Geddes3160.63
Communist Maurice Rush1350.27-0.16
Confederation of Regions Poldi Meindl980.20
Total valid votes50,210100.0  
Progressive Conservative hold Swing +3.65
1980 Canadian federal election
PartyCandidateVotes%±%
Progressive Conservative Pat Carney 16,46235.27+0.84
New Democratic Ron Johnson14,83031.77+1.80
Liberal Art Phillips 14,66731.42-3.22
Rhinoceros David J. Longworth3370.72
Communist Jack Phillips2000.43+0.18
Independent John Elliot1010.22-0.38
Independent Paul Watson540.12
Marxist–Leninist Greg Corcoran240.05-0.06
Total valid votes46,675100.0  
Progressive Conservative gain from Liberal Swing -0.48
1979 Canadian federal election
PartyCandidateVotes%±%
Liberal Art Phillips 15,43034.64-7.09
Progressive Conservative Pat Carney 15,33534.43-3.10
New Democratic Ron Johnson13,35029.97+10.58
Independent John Elliot2670.60
Communist Bert Ogden1110.25-0.22
Marxist–Leninist Greg Corcoran480.11-0.20
Total valid votes44,541100.0  
Liberal hold Swing -2.00
1974 Canadian federal election
PartyCandidateVotes%±%
Liberal Ron Basford 19,06441.74+0.39
Progressive Conservative Doug Davis17,14337.53+7.27
New Democratic Ron Johnson8,85919.39-7.26
Social Credit Walter Muller2570.56-0.79
Communist Betty Greenwell2130.47
Marxist–Leninist Charles Shrybman1410.31
Total valid votes45,677100.0  
Liberal hold Swing -3.44
1972 Canadian federal election
PartyCandidateVotes%±%
Liberal Ron Basford 19,34141.35-14.75
Progressive Conservative John McDonald14,15630.26+11.89
New Democratic Ron K. Johnson12,47026.66+2.05
Social Credit Nicholas Zambus6321.35
Independent Arnold August770.16
Independent Ray Dodge550.12
Independent Daniel Ivan Fedoruk460.10
Total valid votes46,777100.0  
Liberal hold Swing -13.32
1968 Canadian federal election
PartyCandidateVotes%±%
Liberal Ron Basford 25,42656.10+16.02
New Democratic William Deverell11,15124.60+1.54
Progressive Conservative David W. Kilgour 8,32618.37-9.43
Republican Gerard Guejon [17] 4200.93
Total valid votes45,323100.0  
Liberal hold Swing +7.24
1965 Canadian federal election
PartyCandidateVotes%±%
Liberal Jack R. Nicholson 9,00840.08+0.75
Progressive Conservative Douglas Jung 6,24827.80-2.73
New Democratic Lyle Kristiansen 5,18423.07-1.13
Social Credit William John McIntyre1,8068.04+2.10
Independent Social CreditJames B. Wisbey2281.01
Total valid votes22,474100.0  
Liberal hold Swing +1.74
1963 Canadian federal election
PartyCandidateVotes%±%
Liberal Jack R. Nicholson 9,47239.33+3.73
Progressive Conservative Douglas Jung 7,35330.53-0.94
New Democratic Margaret Erickson5,82624.19+0.54
Social Credit Bevis Walters1,4305.94-2.29
Total valid votes24,081100.0  
Liberal hold Swing +2.34
1962 Canadian federal election
PartyCandidateVotes%±%
Liberal Jack R. Nicholson 7,69735.61+18.43
Progressive Conservative Douglas Jung 6,80331.47-29.95
New Democratic Margaret Erickson5,11323.65+9.73
Social Credit F. George J. Hahn1,7798.23+3.60
Independent Burton V. White2241.04
Total valid votes21,616100.0  
Liberal gain from Progressive Conservative Swing +24.19
Change for the New Democrats is based on the Co-operative Commonwealth.
1958 Canadian federal election
PartyCandidateVotes%±%
Progressive Conservative Douglas Jung 14,04461.43+19.92
Liberal Lyon Ward3,92717.18-7.29
Co-operative Commonwealth Alan Judge3,18313.92+3.80
Social Credit Cyril White1,0594.63-16.87
Labor–Progressive Maurice Rush6502.84+0.43
Total valid votes22,863100.0  
Progressive Conservative hold Swing +13.60
1957 Canadian federal election
PartyCandidateVotes%±%
Progressive Conservative Douglas Jung 9,08741.50+32.86
Liberal Ralph Campney 5,35724.47-16.37
Social Credit Cyril White4,70721.50-2.96
Co-operative Commonwealth William James Dennison2,21610.12-12.21
Labor–Progressive Maurice Rush5282.41-1.33
Total valid votes21,895100.0  
Progressive Conservative gain from Liberal Swing +24.62
1953 Canadian federal election
PartyCandidateVotes%±%
Liberal Ralph Campney 8,25940.83-1.73
Social Credit Leslie R. Peterson 4,94624.45
Co-operative Commonwealth Rodney Young 4,51622.33-4.05
Progressive Conservative Wendell Willard Wright1,7498.65-16.02
Labor–Progressive Ernest Lawrie7563.74-0.20
Total valid votes20,226100.0  
Liberal hold Swing -13.09
1949 Canadian federal election
PartyCandidateVotes%±%
Liberal Ralph Campney 10,29942.56+8.90
Co-operative Commonwealth Rodney Young 6,38226.37-17.22
Progressive Conservative Henry Herbert Stevens 5,97024.67+1.93
Labor–Progressive Maurice Rush9523.93
Independent Harold Meade Young5952.46
Total valid votes24,198100.0  
Liberal gain from Co-operative Commonwealth Swing +13.06
Canadian federal by-election, 8 June 1948
On Ian Mackenzie being called to the Senate, 19 January 1948
PartyCandidateVotes%±%
Co-operative Commonwealth Rodney Young 9,51843.60+16.27
Liberal Ralph Campney 7,34833.66+3.90
Progressive Conservative Hilliard Lyle Jestley4,96522.74-3.73
Total valid votes21,831100.0  
Co-operative Commonwealth gain from Liberal Swing +6.18
1945 Canadian federal election
PartyCandidateVotes%±%
Liberal Ian Alistair Mackenzie 9,95929.76-9.39
Co-operative Commonwealth George Alfred Isherwood9,14527.33+0.06
Progressive Conservative Ernest Garfield Sherwood8,85926.47-3.75
Labor–Progressive James Swanson Thompson3,75011.21
Social Credit Erich Charles Martin 1,0423.11
Democratic William Richard Nathaniel Smith3931.17
Socialist Labour Robert Gordon McQuillan3190.95
Total valid votes33,467100.0  
Liberal hold Swing -4.72
1940 Canadian federal election
PartyCandidateVotes%±%
Liberal Ian Alistair Mackenzie 12,10039.15+5.10
National Government Ernest Garfield Sherwood9,33830.22+7.16
Co-operative Commonwealth Wallis Walter Lefeaux8,42727.27-6.18
Independent Paul McDowell Kerr6302.04
Nationalist Norman Lee Glozier4081.32
Total valid votes30,903100.0  
Liberal hold Swing -1.03
1935 Canadian federal election
PartyCandidateVotes%±%
Liberal Ian Alistair Mackenzie 7,65834.05-20.57
Co-operative Commonwealth Wallis Walter Lefeaux7,52233.45
Conservative Ernest Garfield Sherwood5,18723.06-22.32
Reconstruction Lilette Julia Caroline Mahon1,8728.32
Socialist John David Taylor2511.12
Total valid votes22,490100.0  
Liberal hold Swing -27.01
1930 Canadian federal election
PartyCandidateVotes%±%
Liberal Ian Alistair Mackenzie 12,06454.62+10.78
Conservative Henry Herbert Stevens 10,02345.38-8.06
Total valid votes22,087100.0  
Liberal gain from Conservative Swing +9.42
1926 Canadian federal election
PartyCandidateVotes%±%
Conservative Henry Herbert Stevens 10,32653.44+4.96
Liberal Dugald Donaghy 8,47143.84+1.42
Labour Eugene Thorton Kingsley 5272.73-6.38
Total valid votes19,324100.0  
Conservative hold Swing +1.77
1925 Canadian federal election
PartyCandidateVotes%±%
Conservative Henry Herbert Stevens 9,45848.47-10.03
Liberal Gerald Grattan McGeer8,27742.42+11.54
Labour Wallis Walter Lefeaux1,7779.11
Total valid votes19,512100.0  
Conservative hold Swing -10.78
1921 Canadian federal election
PartyCandidateVotes%±%
Conservative Henry Herbert Stevens 10,49358.50-9.24
Liberal Robert Henry Gale5,53830.88+3.51
Independent Thomas O'Connor1,86610.40
Progressive Cadwallader Flagg Batson390.22
Total valid votes17,936100.0  
Conservative hold Swing -6.38
1917 Canadian federal election
PartyCandidateVotes%
Government (Unionist) Henry Herbert Stevens 13,72267.74
Opposition (Laurier Liberals) William Wallace Burns McInnes5,54327.36
Labour William Arthur Pritchard 9924.90
Total valid votes20,257100.0  
This riding was created from parts of Vancouver City, where Conservative Henry Herbert Stevens was the incumbent.

Student Vote Results

2019

2019 Canadian federal election
PartyCandidateVotes%
New Democratic Breen Ouellette37637.41
Green Jesse Brown24224.08
Liberal Hedy Fry 19419.30
Conservative David Cavey10810.75
Libertarian John Clarke333.28
Independent Lily Bowman313.08
People's Louise Kierans212.09
Independent Imtiaz Popat00.0
Total valid votes/expense limit1,005100.0
Source: Student Vote Canada [18] [19]

See also

Notes

  1. Statistic includes all persons that did not make up part of a visible minority or an indigenous identity.
  2. Statistic includes total responses of "Chinese", "Korean", and "Japanese" under visible minority section on census.
  3. Statistic includes total responses of "West Asian" and "Arab" under visible minority section on census.
  4. Statistic includes total responses of "Filipino" and "Southeast Asian" under visible minority section on census.
  5. Statistic includes total responses of "Visible minority, n.i.e." and "Multiple visible minorities" under visible minority section on census.

Related Research Articles

<span class="mw-page-title-main">Vancouver East</span> Federal electoral district in British Columbia, Canada

Vancouver East is a federal electoral district in British Columbia, Canada, that has been represented in the House of Commons of Canada since 1935. It is currently represented by New Democratic Party MP Jenny Kwan.

<span class="mw-page-title-main">Vancouver Quadra</span> Federal electoral district in British Columbia, Canada

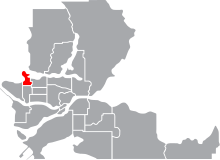
Vancouver Quadra is a federal electoral district in the Metro Vancouver region of British Columbia, Canada. It has been represented in the House of Commons of Canada since 1949. The constituency bears the name of the Spanish explorer who surveyed the area in 1775, Juan Francisco de la Bodega y Quadra. Since 2007, the riding has been represented by Liberal MP Joyce Murray, who has served in the 29th ministry under Prime Minister of Canada Justin Trudeau.

<span class="mw-page-title-main">Yorkton—Melville</span> Federal electoral district in Saskatchewan, Canada

Yorkton—Melville is a federal electoral district in Saskatchewan, Canada, that has been represented in the House of Commons of Canada since 1968.

<span class="mw-page-title-main">Cypress Hills—Grasslands</span> Federal electoral district in Saskatchewan, Canada

Cypress Hills—Grasslands is a federal electoral district in Saskatchewan, Canada, that has been represented in the House of Commons of Canada since 1997.

<span class="mw-page-title-main">Richmond Centre (federal electoral district)</span> Federal electoral district in British Columbia, Canada

Richmond Centre is a federal electoral district in British Columbia, Canada, that has been represented in the House of Commons of Canada since 1988.

Vancouver South is a federal electoral district in British Columbia, Canada, that has been represented in the House of Commons of Canada from 1917 to 1997, and since 2004. It covers the southern portion of the city of Vancouver, British Columbia.

<span class="mw-page-title-main">North Vancouver (federal electoral district)</span> Federal electoral district in British Columbia, Canada

North Vancouver is a federal electoral district in the province of British Columbia, Canada, that has been represented in the House of Commons of Canada since 1988.

<span class="mw-page-title-main">Elmwood—Transcona</span> Federal electoral district in Manitoba, Canada

Elmwood—Transcona is a federal electoral district in Manitoba, Canada, that has been represented in the House of Commons of Canada since 1988. Its population in 2011 was 85,906.

<span class="mw-page-title-main">Kildonan—St. Paul</span> Federal electoral district in Manitoba, Canada

Kildonan—St. Paul is a federal electoral district in the Winnipeg Capital Region of Manitoba, Canada. It has been represented in the House of Commons of Canada since 2004.

<span class="mw-page-title-main">Selkirk—Interlake—Eastman</span> Federal electoral district in Manitoba, Canada

Selkirk—Interlake—Eastman is a federal electoral district in Manitoba, Canada, that has been represented in the House of Commons of Canada from 1976 to 1987, and since 1997.

<span class="mw-page-title-main">Edmonton Centre</span> Federal electoral district in Alberta, Canada

Edmonton Centre is a federal electoral district in Alberta, Canada, that has been represented in the House of Commons of Canada from 1968 to 1979 and since 2004.

<span class="mw-page-title-main">Fleetwood—Port Kells</span> Federal electoral district in British Columbia, Canada

Fleetwood—Port Kells is a federal electoral district in the province of British Columbia, Canada, that has been represented in the House of Commons of Canada since 2004.

<span class="mw-page-title-main">Prince George—Peace River—Northern Rockies</span> Federal electoral district in British Columbia, Canada

Prince George—Peace River—Northern Rockies is a federal electoral district in northern British Columbia, Canada. It has been represented in the House of Commons of Canada since 1968.

<span class="mw-page-title-main">Vancouver Kingsway</span> Federal electoral district in British Columbia, Canada

Vancouver Kingsway is a federal electoral district in British Columbia, Canada, that has been represented in the House of Commons of Canada from 1953 to 1988 and since 1997. It is located in Vancouver.

<span class="mw-page-title-main">Kamloops—Thompson—Cariboo</span> Federal electoral district in British Columbia, Canada

Kamloops—Thompson—Cariboo is a federal electoral district in the province of British Columbia, Canada, that has been represented in the House of Commons of Canada since 2004. While the riding covers a large area, about three quarters of the population in the district live in the city of Kamloops.

<span class="mw-page-title-main">Charleswood—St. James—Assiniboia—Headingley</span> Federal electoral district in Manitoba, Canada

Charleswood—St. James—Assiniboia—Headingley is a federal electoral district in Manitoba, Canada, that has been represented in the House of Commons of Canada since 1997.

<span class="mw-page-title-main">Souris—Moose Mountain</span> Federal electoral district in Saskatchewan, Canada

Souris—Moose Mountain is a federal electoral district in Saskatchewan, Canada, that has been represented in the House of Commons of Canada since 1988.

<span class="mw-page-title-main">Kelowna—Lake Country</span> Federal electoral district in British Columbia, Canada

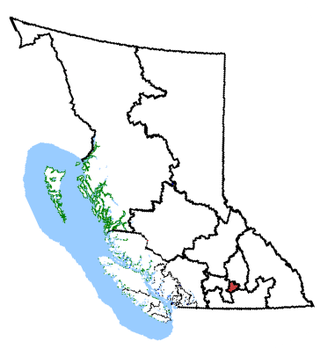
Kelowna—Lake Country is a federal electoral district in the province of British Columbia, Canada, that has been represented in the House of Commons of Canada since 1997.

Port Moody—Coquitlam is a federal electoral district in British Columbia, Canada, that was represented in the House of Commons of Canada from 1997 to 2004 and since 2015.

<span class="mw-page-title-main">Winnipeg Centre</span> Federal electoral district in Manitoba, Canada

Winnipeg Centre is a federal electoral district in Manitoba, Canada, that has been represented in the House of Commons of Canada from 1917 to 1925 and since 1997.

References

  1. Statistics Canada: 2022
  2. Statistics Canada: 2022
  3. "Census Profile, 2021 Census, Statistics Canada - Validation Error".
  4. "Mother Tongue for the Population Excluding Institutional Residents of Canada, Provinces and Territories and Federal Electoral Districts (2013 Representation Order), 2021 Census". December 15, 2022.
  5. Government of Canada, Statistics Canada (October 26, 2022). "Census Profile, 2021 Census of Population". www12.statcan.gc.ca. Retrieved February 16, 2023.
  6. Government of Canada, Statistics Canada (October 27, 2021). "Census Profile, 2016 Census". www12.statcan.gc.ca. Retrieved February 16, 2023.
  7. Government of Canada, Statistics Canada (November 27, 2015). "NHS Profile". www12.statcan.gc.ca. Retrieved February 16, 2023.
  8. Final Report – British Columbia
  9. Timeline for the Redistribution of Federal Electoral Districts
  10. "Confirmed candidates — Vancouver Centre". Elections Canada. September 1, 2021. Retrieved September 6, 2021.
  11. "Candidate Campaign Returns". Elections Canada . Retrieved July 19, 2022.
  12. "List of confirmed candidates". Elections Canada. Retrieved October 4, 2019.
  13. "Official Voting Results". Elections Canada. Retrieved August 8, 2021.
  14. Elections Canada – Confirmed candidates for Vancouver Centre, 30 September 2015
  15. Elections Canada – Preliminary Election Expenses Limits for Candidates
  16. Pundits' Guide to Canadian Elections
  17. Vancouver Sun, June 26, 1968, "Republicans Claim Win", p. 15
  18. "List of confirmed candidates". Elections Canada. Retrieved October 4, 2019.
  19. "Official Voting Results". Student Vote Canada. Retrieved August 27, 2021.
Parliament of Canada
Preceded by Constituency represented by the prime minister
1993
Succeeded by

49°17′N123°07′W / 49.28°N 123.12°W / 49.28; -123.12