Brome—Missisquoi (federal electoral district)

Last updated • 2 min readFrom Wikipedia, The Free Encyclopedia

Brome—Missisquoi
Flag of Quebec.svg Quebec electoral district
Brome-msq.PNG
Brome—Missisquoi in relation to other Eastern Townships ridings
Federal electoral district
Legislature House of Commons
MP


Pascale St-Onge
Liberal
District created1924
First contested 1925
Last contested 2021
District webpage profile, map
Demographics
Population (2021) [1] 113,913
Electors (2021)94,460
Area (km²) [2] 2,779.12
Pop. density (per km²)41
Census division(s) Brome-Missisquoi RCM, Memphrémagog RCM
Census subdivision(s) Magog, Cowansville, Bromont, Farnham, Lac-Brome, Orford, Sutton, Dunham, Bedford, Brigham

Brome—Missisquoi (French pronunciation: [bʁɔmmisiskwa] ; formerly known as Missisquoi) is a federal electoral district in Quebec, Canada, that has been represented in the House of Commons of Canada since 1925. The original electoral district of Missiquoi existed from 1867 to 1925.

Contents

Geography

This riding, in the south of the province, extends along the Canada–US border between Montreal and Sherbrooke, straddling the Quebec regions of Montérégie and Estrie. Its main towns are Cowansville, Magog, and Brome Lake.

The district includes the Regional County Municipality of Brome-Missisquoi, the municipalities of Saint-Sébastien, Henryville, Noyan, Clarenceville, Venise-en-Québec, Bromont, and the Regional County Municipality of Memphrémagog except Stanstead, Ayer's Cliff, North Hatley, Ogden, Sainte-Catherine-de-Hatley, Hatley and Stanstead Canton.

Its population in 2006 was 92,591 and the area is 3,045 km2.

The neighbouring ridings are Saint-Jean, Shefford, Richmond—Arthabaska, and Compton—Stanstead.

History

It was created in 1924 from parts of Brome, Iberville, Missisquoi and Saint-Jean ridings.

The electoral district was abolished in 1966 when it was redistributed between Missisquoi and Saint-Jean ridings. In 1970, Missisquoi was renamed "Brome—Missisquoi".

In 1976, "Brome—Missisquoi" was abolished and became part of a new "Missisquoi riding", which was renamed "Brome—Missisquoi" in 1983.

The 2012 electoral redistribution saw this riding stay mostly the same, but it lost a small fraction of territory to Shefford.

Demographics

Canada census – Huron-Bruce community profile
2021 2016
Population113,913 (10.1% from 2016)103,457 (4.9% from 2011)
Land area2,779.12 km2 (1,073.02 sq mi)2,783.46 km2 (1,074.70 sq mi)
Population density41/km2 (110/sq mi)37.2/km2 (96/sq mi)
Median age52 (M: 51.2, F: 52.8)50.1 (M: 49.3, F: 50.9)
Private dwellings63,116 (total) 58,935 (total) 
Median household income$70,500$57,192
Notes: NHS Profile, Statistics Canada
References: 2021 [3] 2016 [4] earlier [5] [6]
Visible Minorities and Aboriginals [7]
Group2021 Census2016 Census
Population % of totalPopulation % of total
Indigenous2,0451.81,5351.5
Visible Minority2,0101.81,2051.2
All other106,73596.497,64597.3
Total110,790100.0100,385100.0
Population by mother tongue [8]
Group2021 Census2016 Census
Population % of totalPopulation % of total
English13,81512.313,58513.4
French92,98082.983,93082.9
English and French2,3952.11,2951.3
All other3,0202.72,4902.4
Total112,210100.0101,300100.0
Mobility over previous five years
Group2021 Census2016 Census
Population % of totalPopulation % of total
At the same address61,72058.361,67564.5
In the same constituency12,16011.514,25514.9
In the same province30,08028.418,65519.5
From another province9150.94700.5
From another country1,0301.05850.6
Total aged 5 or over105,910100.095,650100.0

Members of Parliament

This riding has elected the following members of Parliament. Its current MP is Pascale St-Onge of the Liberal Party.

ParliamentYearsMemberParty
Brome—Missisquoi
Riding created from Brome, Iberville, Missisquoi and Saint-Jean
15th  1925–1926   William Frederic Kay Liberal
16th  1926–1930
17th  1930–1935   Follin Horace Pickel Conservative
18th  1935–1940   Louis Gosselin Liberal
19th  1940–1945 Maurice Hallé
20th  1945–1949
21st  1949–1952 Henri Gosselin
 1952–1953 Joseph-Léon Deslières
22nd  1953–1957
23rd  1957–1958
24th  1958–1962   Heward Grafftey Progressive Conservative
25th  1962–1963
26th  1963–1965
27th  1965–1968
Missisquoi
28th  1968–1972   Yves Forest Liberal
Brome—Missisquoi
29th  1972–1974   Heward Grafftey Progressive Conservative
30th  1974–1979
Missisquoi
31st  1979–1980   Heward Grafftey Progressive Conservative
32nd  1980–1984   André Bachand Liberal
Brome—Missisquoi
33rd  1984–1988   Gabrielle Bertrand Progressive Conservative
34th  1988–1993
35th  1993–1994   Gaston Péloquin Bloc Québécois
 1995–1997   Denis Paradis Liberal
36th  1997–2000
37th  2000–2004
38th  2004–2006
39th  2006–2008   Christian Ouellet Bloc Québécois
40th  2008–2011
41st  2011–2015   Pierre Jacob New Democratic
42nd  2015–2019   Denis Paradis Liberal
43rd  2019–2021 Lyne Bessette
44th  2021–present Pascale St-Onge

Election results

Graph of election results in Brome—Missisquoi(1924-1966), Missisquoi(1966-1970), Brome—Missisquoi(1970-1976), Missisquoi(1976-1983), and Brome—Missisquoi (1983-present) (1924-, minor parties that never got 2% of the vote or didn't run consistently are omitted)

Brome—Missisquoi, 1984 - present

Graph of election results in Brome—Missisquoi (1983-, minor parties that never got 2% of the vote or didn't run consistently are omitted)
2021 Canadian federal election
PartyCandidateVotes%±%Expenditures
Liberal Pascale St-Onge 21,48835.1-3.1$39,303.15
Bloc Québécois Marilou Alarie21,29134.8+0.4$33,184.64
Conservative Vincent Duhamel9,96116.3+3.8$94,614.82
New Democratic Andrew Panton3,8286.3-1.7$0.45
People's Alexis Stogowski1,9823.2+2.5$0.00
Green Michelle Corcos1,4662.4-3.0$0.00
Free Maryse Richard9611.6N/A$914.14
Veterans Coalition Lawrence Cotton2160.4+0.1$0.00
Independent Dany Desjardins1450.2N/A$0.00
Christian Heritage Susanne Lefebvre1330.2N/A$2.403.25
Total valid votes/expense limit67,47198.2$112,117.88
Total rejected ballots1,1151.8
Turnout62,58666.3
Registered voters94,460
Liberal hold Swing -1.8
Source: Elections Canada [9]
2019 Canadian federal election
PartyCandidateVotes%±%Expenditures
Liberal Lyne Bessette 23,45038.2-5.68none listed
Bloc Québécois Monique Allard21,15234.4+16.93$19,373.49
Conservative Bruno Côté7,69712.5+1.04$17,284.00
New Democratic Sylvie Jetté4,8878.0-16.51$7,266.26
Green Normand Dallaire3,3025.4+3.05$8,943.15
People's François Poulin4560.7none listed
Rhinoceros Steeve Cloutier3100.5none listed
Veterans Coalition Lawrence Cotton1870.3$0.00
Total valid votes/expense limit61,441100.0
Total rejected ballots962
Turnout62,40370.1
Eligible voters89,071
Liberal hold Swing -11.31
Source: Elections Canada [10] [11]
2015 Canadian federal election
PartyCandidateVotes%±%Expenditures
Liberal Denis Paradis 25,74443.88+21.82$77,834.79
New Democratic Catherine Lusson14,38324.51-18.13$45,044.04
Bloc Québécois Patrick Melchior10,25217.47-3.79$48,371.40
Conservative Charles Poulin6,72411.46-0.45
Green Cindy Moynan1,3772.35+0.22
Strength in Democracy Patrick Paine1950.33$639.88
Total valid votes/Expense limit58,67598.8 $223,312.02
Total rejected ballots7161.2
Turnout59,39169.71
Eligible voters85,201
Liberal gain from New Democratic Swing +19.98
Source: Elections Canada [12] [13] [14]
2011 federal election redistributed results [15]
PartyVote %
  New Democratic 22,40442.64
  Liberal 11,58822.06
  Bloc Québécois 11,17121.26
  Conservative 6,25611.91
  Green 1,1202.13
2011 Canadian federal election
PartyCandidateVotes%±%Expenditures
New Democratic Pierre Jacob 22,40742.64+33.59
Liberal Denis Paradis 11,58922.06-10.73
Bloc Québécois Christelle Bogosta11,17321.26-13.95
Conservative Nolan LeBlanc-Bauerle6,25611.91-6.75
Green Benoit Lambert1,1202.13-1.45
Total valid votes/Expense limit52,545100.00
Total rejected ballots5881.05
Turnout53,13366.30
Eligible voters 80,137
New Democratic gain from Bloc Québécois Swing +23.77
2008 Canadian federal election
PartyCandidateVotes%±%Expenditures
Bloc Québécois Christian Ouellet 17,56135.21-3.13$77,380
Liberal Denis Paradis 16,35732.79+4.82$65,529
Conservative Mark Quinlan9,30918.66-1.69$78,614
New Democratic Christelle Bogosta4,5149.05+5.85$4,678
Green Pierre Brassard 1,7843.58+0.02
Independent David Marler3540.71$16,915
Total valid votes/Expense limit 49,879100.00 $83,303
Bloc Québécois hold Swing -3.98
2006 Canadian federal election
PartyCandidateVotes%±%Expenditures
Bloc Québécois Christian Ouellet 18,59638.33-1.33$66,756
Liberal Denis Paradis 13,56927.97-14.12$58,065
Conservative David Marler9,87420.35+9.30$70,771
New Democratic Josianne Jetté2,8395.85+3.19$1,497
Progressive Canadian Heward Grafftey 1,9213.96$69,065
Green Michel Champagne 1,7213.55-1.00$2,460
Total valid votes/Expense limit48,520100.00 $76,646
Bloc Québécois gain from Liberal Swing +6.40
2004 Canadian federal election
PartyCandidateVotes%±%Expenditures
Liberal Denis Paradis 18,60942.08-8.18$56,786
Bloc Québécois Christian Ouellet 17,53739.66+8.49$29,221
Conservative Peter Stastny4,88811.05-6.40$20,193
Green Louise Martineau2,0114.55
New Democratic Piper Huggins1,1772.66+1.54$5
Total valid votes/Expense limit44,222100.00 $74,138
Liberal hold Swing -8.34

Note: Conservative vote is compared to the total of the Canadian Alliance vote and Progressive Conservative vote in 2000 election.

2000 Canadian federal election
PartyCandidateVotes%±%
Liberal Denis Paradis 21,54550.26+7.89
Bloc Québécois André Leroux13,36331.17+3.34
Progressive Conservative Heward Grafftey5,50212.84-15.25
Alliance Jacques Loyer1,9774.61
New Democratic Jeff Itcush4801.12-0.60
Total valid votes42,867100.00
Liberal hold Swing +2.28
1997 Canadian federal election
PartyCandidateVotes%±%
Liberal Denis Paradis 19,26142.37-8.66
Progressive Conservative Claude Boulard12,77028.09+24.79
Bloc Québécois Noël Lacasse12,65227.83-14.33
New Democratic Nicole Guillemet7811.72+0.73
Total valid votes45,464100.00
Canadian federal by-election, 13 February 1995
PartyCandidateVotes%±%
Péloquin's death, 1 September 1994
Liberal Denis Paradis 19,07851.02+14.18
Bloc Québécois Jean-François Bertrand15,76442.16+1.58
Progressive Conservative Guy Lever1,2353.30-13.87
Reform Line Maheux5171.38
New Democratic Paul Vachon 3710.99-0.26
Christian Heritage Jean Blaquière 1260.34
Independent Yvon V. Boulanger1070.29
Green Eric Ferland1010.27
Natural Law Michel Champagne770.21-1.08
Abolitionist John H. Long150.04-1.62
Total valid votes37,391100.00
1993 Canadian federal election
PartyCandidateVotes%±%
Bloc Québécois Gaston Péloquin 17,89440.58
Liberal Joan Kouri16,24336.84+3.95
Progressive Conservative Francine Vincelette7,57117.17-36.80
Abolitionist Jean Guy Peloquin7331.66
Natural Law Yves Décarie5661.28
New Democratic Sean Hutchinson5501.25-11.90
Independent Gary Wightman3810.86
National Edmond Séguin1540.35
Total valid votes44,092100.00
1988 Canadian federal election
PartyCandidateVotes%±%
Progressive Conservative Gabrielle Bertrand 22,54053.97+0.91
Liberal André Bachand 13,73332.88-5.53
New Democratic Paul Vachon 5,48913.14+7.58
Total valid votes41,762100.00
1984 Canadian federal election
PartyCandidateVotes%±%
Progressive Conservative Gabrielle Bertrand 21,67853.07+12.20
Liberal André Bachand 15,69338.42-14.67
New Democratic Gordon J. Hamilton2,2715.56+1.56
Parti nationaliste Yvon Bélair9972.44
Libertarian David Chamberlain1160.28
Commonwealth of Canada Michel Boissonnault960.24
Total valid votes40,851100.00

Missisquoi, 1979 - 1984

Graph of election results in Missisquoi (1976-1983, minor parties that never got 2% of the vote or didn't run consistently are omitted)
1980 Canadian federal election
PartyCandidateVotes%±%
Liberal André Bachand 20,02253.08+9.83
Progressive Conservative Heward Grafftey15,41340.86-7.18
New Democratic Gertrude Lefebvre-Brown1,5084.00+1.38
Rhinoceros Pierre Screwdriver Gingras6871.82
Marxist–Leninist Myriam Portatia890.24
Total valid votes37,719100.00
1979 Canadian federal election
PartyCandidateVotes%±%
Progressive Conservative Heward Grafftey 18,19848.04-3.57
Liberal Gisèle V. Noël16,38343.25+7.49
Social Credit Rolland Cordeau2,0975.54-3.99
New Democratic Gertrude Lefebvre-Brown9912.62-0.49
Union populaire Marcel Forand2120.56
Total valid votes37,881100.00

Brome—Missisquoi, 1972 - 1979

Graph of election results in Brome—Missisquoi (1970-1976, minor parties that never got 2% of the vote or didn't run consistently are omitted)
1974 Canadian federal election
PartyCandidateVotes%±%
Progressive Conservative Heward Grafftey 19,49051.61+10.13
Liberal C. Peter Turner13,50635.76+3.40
Social Credit J.-Marc Duchesneau3,5979.52-14.52
New Democratic Brian Peters1,1723.10+0.99
Total valid votes37,765100.00
1972 Canadian federal election
PartyCandidateVotes%±%
Progressive Conservative Heward Grafftey 15,59341.48+3.25
Liberal Yves Forest12,16532.36-9.79
Social Credit Jean-Paul Lasnier9,03824.04-14.19
New Democratic Jean-Guy Lewis7952.11-14.88
Total valid votes37,591100.00

Note: Social Credit vote is compared to Ralliement créditiste vote in the 1968 election.

Missisquoi, 1968 - 1972

1968 Canadian federal election
PartyCandidateVotes%±%
Liberal Yves Forest 12,90542.15+3.28
Progressive Conservative Heward W. Grafftey11,70538.23-11.76
Ralliement créditiste Roméo Custeau5,20517.00+11.23
New Democratic Willie Fortin8032.62-2.75
Total valid votes30,618100.00

Brome—Missisquoi, 1925 - 1968

Graph of election results in Brome—Missisquoi (1924-1966, minor parties that never got 2% of the vote or didn't run consistently are omitted)
1965 Canadian federal election
PartyCandidateVotes%±%
Progressive Conservative Heward Grafftey 9,66249.99+5.34
Liberal Jean-Louis Cardin7,51238.86+1.15
Ralliement créditiste Hervé Lapointe1,1165.77-7.33
New Democratic James Walker Dawson1,0395.38+0.83
Total valid votes19,329100.00

Note: Ralliement créditiste vote is compared to Social Credit vote in the 1963 election.

1963 Canadian federal election
PartyCandidateVotes%±%
Progressive Conservative Heward Grafftey 8,41144.64+2.81
Liberal Léo Duquette7,10537.71-1.81
Social Credit Normand Ruel2,46813.10-5.54
New Democratic Giles Bisson8564.54
Total valid votes18,840100.00
1962 Canadian federal election
PartyCandidateVotes%±%
Progressive Conservative Heward Grafftey 8,07441.83-19.73
Liberal Marc Hudon7,62939.53+1.09
Social Credit Normand Ruel3,59818.64
Total valid votes19,301100.00
1958 Canadian federal election
PartyCandidateVotes%±%
Progressive Conservative Heward Grafftey 11,36161.56+13.38
Liberal Maurice Halle7,09338.44-13.38
Total valid votes18,454100.00
1957 Canadian federal election
PartyCandidateVotes%±%
Liberal Joseph-Léon Deslières 9,25551.82-11.51
Progressive Conservative William Heward Grafftey8,60548.18+19.42
Total valid votes17,860100.00
1953 Canadian federal election
PartyCandidateVotes%±%
Liberal Joseph-Léon Deslières 9,36263.33+7.55
Progressive Conservative Vincent de Lourdes Leonard4,25228.76-11.20
Co-operative Commonwealth Philip Borgan1,1687.90+3.65
Total valid votes14,782100.00
By-election on 26 May 1952
On Mr. Gosselin's death, 27 January 1952
PartyCandidateVotes%±%
Liberal Joseph-Léon Deslières 8,39455.79-0.19
Progressive Conservative Henri Demers6,01339.96+0.25
Co-operative Commonwealth Philip Borgan6404.25
Total valid votes15,047100.00
1949 Canadian federal election
PartyCandidateVotes%±%
Liberal Henri A. Gosselin 8,83155.97+5.04
Progressive Conservative Vincent de Lourdes Leonard6,26639.71+12.70
Union des électeurs Georges-Aimé Chevalier4022.55
Co-operative Commonwealth Georges-M. St Amour2791.77+0.17
Total valid votes15,778100.00
1945 Canadian federal election
PartyCandidateVotes%±%
Liberal Maurice Halle 7,86050.93-24.89
Progressive Conservative Floyd E. Johnson4,16927.02+2.84
Bloc populaire Maurice Archambault3,08720.00
Co-operative Commonwealth William Henry Freder Jones2461.59
Farmer (independent)Edward Vivian de Lér Orr700.45
Total valid votes15,432100.00

Note: Progressive Conservative vote is compared to "National Government" vote in 1940 election.

1940 Canadian federal election
PartyCandidateVotes%±%
Liberal Maurice Halle 8,30275.82+22.55
National Government Daniel James Murphy2,64724.18-22.55
Total valid votes10,949100.00

Note: "National Government" vote is compared to Conservative vote in 1935 election.

1935 Canadian federal election
PartyCandidateVotes%±%
Liberal Louis Gosselin 8,00753.27+8.34
Conservative Follin Horace Pickel 7,02446.73-8.34
Total valid votes15,031100.00
1930 Canadian federal election
PartyCandidateVotes%±%
Conservative Follin Horace Pickel 8,07055.07+9.34
Liberal William Frederic Kay6,58444.93-9.34
Total valid votes14,654100.00
1926 Canadian federal election
PartyCandidateVotes%±%
Liberal William Frederic Kay 7,12654.27-2.43
Conservative Follin Horace Pickel 6,00545.73+2.43
Total valid votes13,131100.00
1925 Canadian federal election
PartyCandidateVotes%
Liberal William Frederic Kay 6,80456.70
Conservative Follin Horace Pickel 5,19643.30
Total valid votes12,000100.00

See also

Related Research Articles

<span class="mw-page-title-main">1973 Quebec general election</span>

The 1973 Quebec general election was held on October 29, 1973 to elect members to National Assembly of Quebec, Canada. The incumbent Quebec Liberal Party, led by Premier Robert Bourassa, won re-election, defeating the Parti Québécois, led by René Lévesque, and the Union Nationale (UN).

<span class="mw-page-title-main">Mount Royal (electoral district)</span> Federal electoral district in Quebec, Canada

Mount Royal is a federal electoral district in Quebec, Canada, that has been represented in the House of Commons of Canada since 1925. Its population in 2006 was 98,888.

<span class="mw-page-title-main">Louis-Hébert (federal electoral district)</span> Federal electoral district in Quebec, Canada

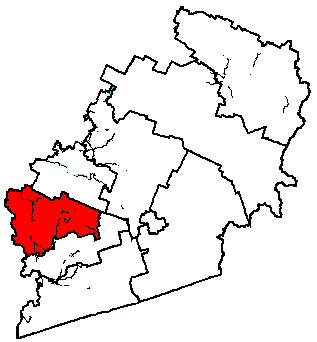
Louis-Hébert is a federal electoral district in the Canadian province of Quebec. Represented in the House of Commons since 1968, its population was certified, according to the detailed statistics of 2001, as 98,156.

<span class="mw-page-title-main">Saint-Hyacinthe—Bagot</span> Federal electoral district in Quebec, Canada

Saint-Hyacinthe—Bagot is a federal electoral district that has been represented in the House of Commons of Canada since 1935. It is located in Quebec, Canada. Its population in 2006 was 95,983. In the 2015 election, the winner received the lowest vote percentage of any winning candidate in the country.

<span class="mw-page-title-main">Papineau (electoral district)</span> Federal electoral district in Quebec, Canada

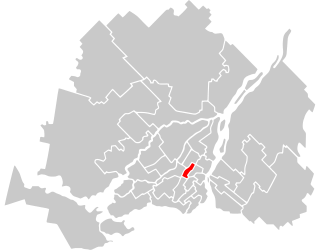
Papineau is a federal electoral district in Montreal, Quebec, Canada, that has been represented in the House of Commons of Canada since 1948. Its population in 2016 was 110,750. Justin Trudeau, the Prime Minister of Canada and Leader of the Liberal Party, has represented the riding since the 2008 federal election. Trudeau became Liberal leader in a 2013 leadership election, succeeding Bob Rae, and prime minister when the Liberals returned to government in the 2015 Canadian federal election, succeeding Conservative leader Stephen Harper.

<span class="mw-page-title-main">Ahuntsic (federal electoral district)</span> Federal electoral district in Quebec, Canada

Ahuntsic was a federal electoral district in Quebec, Canada, that was represented in the House of Commons of Canada from 1968 to 1979 and from 1988 to 2015.

<span class="mw-page-title-main">Longueuil—Saint-Hubert</span> Federal electoral district in Quebec, Canada

Longueuil—Saint-Hubert is a federal electoral district in Quebec, Canada, represented in the House of Commons of Canada from since 2015

<span class="mw-page-title-main">Beauce (electoral district)</span> Federal electoral district in Quebec, Canada

Beauce is a federal electoral district in Quebec, Canada, that has been represented in the House of Commons of Canada since 1867. In 2006, it had a population of 103,617 people, of whom 82,123 were eligible voters.

<span class="mw-page-title-main">Shefford (federal electoral district)</span> Federal electoral district in Quebec, Canada

Shefford is a federal electoral district in Quebec, Canada, that has been represented in the House of Commons of Canada since 1867. Its population in 2006 was 100,000.

<span class="mw-page-title-main">Portneuf—Jacques-Cartier</span> Federal electoral district in Quebec, Canada

Portneuf—Jacques-Cartier is a federal electoral district in Quebec, Canada, that has been represented in the House of Commons of Canada since 1867. Its population in 2001 was 87,141. It is currently represented by Joël Godin of the Conservative Party of Canada.

<span class="mw-page-title-main">Joliette (federal electoral district)</span> Federal electoral district in Quebec, Canada

Joliette is a federal electoral district in Quebec, Canada, that has been represented in the House of Commons of Canada from 1867 to 1935 and since 1968.

Chicoutimi—Le Fjord is a federal electoral district in Quebec, Canada, that has been represented in the House of Commons of Canada since 1925. The riding consists of the northern part of the Chicoutimi borough of Saguenay, as well as the La Baie borough and the municipalities of Ferland-et-Boilleau, L'Anse-Saint-Jean, Petit-Saguenay, Rivière-Éternité and Saint-Félix-d'Otis and the unorganized territory of Lalemant.

<span class="mw-page-title-main">Gatineau (federal electoral district)</span> Federal electoral district in Quebec, Canada

Gatineau is a federal electoral district in Quebec, Canada, represented in the House of Commons of Canada from since 1949. Between 1987 and 1996, it was known as "Gatineau—La Lièvre".

<span class="mw-page-title-main">Beauharnois—Salaberry</span> Federal electoral district in Quebec, Canada

Beauharnois—Salaberry is a former federal electoral district in Quebec, Canada, that was represented in the House of Commons of Canada from 1949 to 2015.

<span class="mw-page-title-main">Compton—Stanstead</span> Federal electoral district in Quebec, Canada

Compton—Stanstead is a federal electoral district in Quebec, Canada, that has been represented in the House of Commons of Canada since 1997.

<span class="mw-page-title-main">Drummond (federal electoral district)</span> Federal electoral district in Quebec, Canada

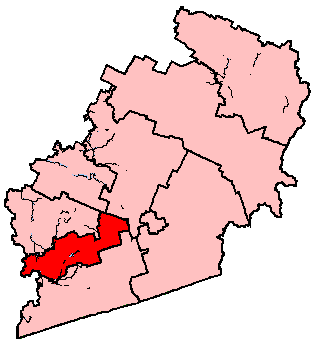
Drummond is a federal electoral district in Quebec, Canada, that has been represented in the House of Commons of Canada since 1968. It was created in 1966 from Drummond—Arthabaska, Nicolet—Yamaska and Richmond—Wolfe.

<span class="mw-page-title-main">Richmond—Arthabaska</span> Federal electoral district in Quebec, Canada

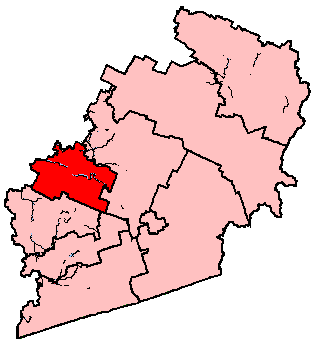
Richmond—Arthabaska is a federal electoral district in Quebec, Canada, that has been represented in the House of Commons of Canada since 1997.

<span class="mw-page-title-main">Saint-Jean (federal electoral district)</span> Federal electoral district in Quebec, Canada

Saint-Jean is a federal electoral district in Quebec, Canada, that has been represented in the House of Commons of Canada since 1968.

<span class="mw-page-title-main">Sherbrooke (federal electoral district)</span> Federal electoral district in Quebec, Canada

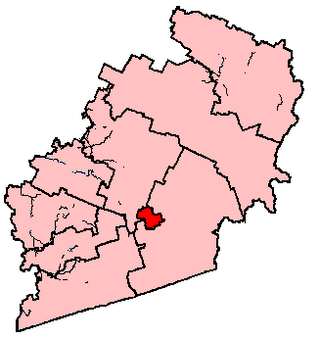
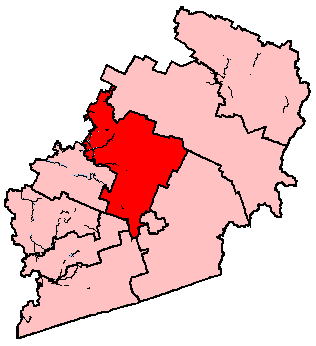
Sherbrooke is a federal electoral district in Quebec, Canada, that has been represented in the House of Commons of Canada since 1925.

Vaudreuil—Soulanges is a federal electoral district in Quebec, Canada, that has been represented in the House of Commons of Canada since 1867.

References

Riding history from the Library of Parliament:

Notes

  1. Statistics Canada: 2022
  2. Statistics Canada: 2022
  3. "2021 Community Profiles". 2021 Canadian census . Statistics Canada. February 4, 2022. Retrieved November 23, 2022.
  4. "2016 Community Profiles". 2016 Canadian census . Statistics Canada. August 12, 2021. Retrieved November 23, 2022.
  5. "2006 Community Profiles". 2006 Canadian census . Statistics Canada. August 20, 2019.
  6. "2001 Community Profiles". 2001 Canadian census . Statistics Canada. July 18, 2021.
  7. in private households
  8. excluding institutional residents
  9. "Confirmed candidates — Brome—Missisquoi". Elections Canada. Retrieved September 20, 2021.
  10. "List of confirmed candidates". Elections Canada. Retrieved October 3, 2019.
  11. "Election Night Results". Elections Canada. Retrieved November 12, 2019.
  12. Elections Canada – Confirmed candidates for Brome—Missisquoi, 30 September 2015
  13. Elections Canada – Preliminary Election Expenses Limits for Candidates Archived 2016-03-04 at the Wayback Machine
  14. "Résultats du soir d'élection - Circonscriptions".
  15. Pundits' Guide to Canadian Elections

45°10′N72°45′W / 45.167°N 72.750°W / 45.167; -72.750