| |||||||||||||||||||||||||||||||||||||||||||||||||||||||||||
20 seats (out of 60 seats) 31 seats needed for a majority | |||||||||||||||||||||||||||||||||||||||||||||||||||||||||||
---|---|---|---|---|---|---|---|---|---|---|---|---|---|---|---|---|---|---|---|---|---|---|---|---|---|---|---|---|---|---|---|---|---|---|---|---|---|---|---|---|---|---|---|---|---|---|---|---|---|---|---|---|---|---|---|---|---|---|---|
|
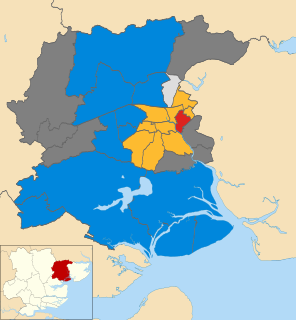
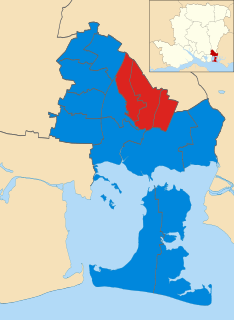
The 2004 Colchester Borough Council election took place on 10 June 2004 to elect members of Colchester Borough Council in Essex, England. This was the same day as the other 2004 United Kingdom local elections and as the 2004 European Parliament Elections. One third of the seats were up for election and the council stayed under no overall control. [1]
Borough status in the United Kingdom is granted by royal charter to local government districts in England, Wales and Northern Ireland. The status is purely honorary, and does not give any additional powers to the council or inhabitants of the district. In Scotland, similarly chartered communities were known as royal burghs, although the status is no longer granted.
Essex is a county in the south-east of England, north-east of London. One of the home counties, it borders Suffolk and Cambridgeshire to the north, Hertfordshire to the west, Kent across the estuary of the River Thames to the south, and London to the south-west. The county town is Chelmsford, the only city in the county. For government statistical purposes Essex is placed in the East of England region.
England is a country that is part of the United Kingdom. It shares land borders with Wales to the west and Scotland to the north-northwest. The Irish Sea lies west of England and the Celtic Sea lies to the southwest. England is separated from continental Europe by the North Sea to the east and the English Channel to the south. The country covers five-eighths of the island of Great Britain, which lies in the North Atlantic, and includes over 100 smaller islands, such as the Isles of Scilly and the Isle of Wight.
After the election, the composition of the council was
The Conservative Party, officially the Conservative and Unionist Party, is a centre-right political party in the United Kingdom. Presently led by Theresa May, it has been the governing party since 2010. It presently has 314 Members of Parliament in the House of Commons, 249 members of the House of Lords, and 18 members of the European Parliament. It also has 31 Members of the Scottish Parliament, 12 members of the Welsh Assembly, eight members of the London Assembly and 9,008 local councillors. One of the major parties of UK politics, it has formed the government on 45 occasions, more than any other party.
The Liberal Democrats are a liberal political party in the United Kingdom. They presently have 11 Members of Parliament in the House of Commons, 96 members of the House of Lords, and one member of the European Parliament. They also have five Members of the Scottish Parliament and a member each in the Welsh Assembly and London Assembly. The party reached the height of its influence in the early 2010s, forming a junior partner in a coalition government from 2010 to 2015. It is presently led by Vince Cable.
The Labour Party is a centre-left political party in the United Kingdom which has been described as an alliance of social democrats, democratic socialists and trade unionists. The party's platform emphasises greater state intervention, social justice and strengthening workers' rights.
The Conservatives gained 4 seats to become the largest party on the council with 28 seats, 3 short of a majority. [2] [3] They overtook the Liberal Democrats who held 23 seats, Labour with 6 seats and 3 independents. [2] Overall turnout at the election was 34.4%. [4]
Voter turnout is the percentage of eligible voters who cast a ballot in an election. Eligibility varies by country, and the voting-eligible population should not be confused with the total adult population. Age and citizenship status are often among the criteria used to determine eligibility, but some countries further restrict eligibility based on sex, race, or religion.
As a result, the Conservatives took all the seats on the council cabinet for the first time since that style of government was introduced in Colchester, with the Conservative group leader John Jowers becoming the new leader of the council. [3]
A Cabinet is a body of high-ranking state officials, typically consisting of the top leaders of the executive branch. Members of a cabinet are usually called Cabinet ministers or secretaries. The function of a Cabinet varies: in some countries it is a collegiate decision-making body with collective responsibility, while in others it may function either as a purely advisory body or an assisting institution to a decision making head of state or head of government. Cabinets are typically the body responsible for the day-to-day management of the government and response to sudden events, whereas the legislative and judicial branches work in a measured pace, in sessions according to lengthy procedures.
Party | Seats | Gains | Losses | Net gain/loss | Seats % | Votes % | Votes | +/− | |
---|---|---|---|---|---|---|---|---|---|
Conservative | 11 | 4 | 0 | +4 | 55 | 40.9 | 13,908 | +0.3 | |
Liberal Democrat | 6 | 0 | 2 | -2 | 30 | 34.2 | 11,619 | +2.2 | |
Labour | 2 | 1 | 0 | +1 | 10 | 18.2 | 6,197 | -1.8 | |
Independent | 1 | 0 | 3 | -4 | 5 | 6.7 | 2,266 | +1.0 |
Party | Candidate | Votes | % | ± | |
---|---|---|---|---|---|
Liberal Democrat | Craig Sutton | 757 | 45.7 | -6.4 | |
Labour | Dave Harris | 504 | 30.5 | +2.3 | |
Conservative | Pauline Hazell | 394 | 23.8 | +4.7 | |
Majority | 253 | 15.3 | -8.6 | ||
Turnout | 1,655 | 28.8 | +4.3 | ||
Liberal Democrat hold | Swing |
Party | Candidate | Votes | % | ± | |
---|---|---|---|---|---|
Liberal Democrat | William Spyvee | 1,185 | 57.9 | +3.5 | |
Conservative | Pauline Lucas | 566 | 27.7 | +3.4 | |
Labour | Malcolm Cannon | 296 | 14.5 | +1.8 | |
Majority | 619 | 30.2 | +0.1 | ||
Turnout | 2,047 | 35.4 | +6.8 | ||
Liberal Democrat hold | Swing |
Party | Candidate | Votes | % | ± | |
---|---|---|---|---|---|
Conservative | John Garnett | 991 | 79.0 | +5.3 | |
Liberal Democrat | Carolyn Catney | 180 | 14.3 | -4.9 | |
Labour | Ian Yates | 84 | 6.7 | -0.4 | |
Majority | 811 | 64.6 | +10.1 | ||
Turnout | 1,255 | 53.7 | +8.7 [lower-alpha 1] | ||
Conservative hold | Swing |
Party | Candidate | Votes | % | ± | |
---|---|---|---|---|---|
Labour | Andrew Raison | 428 | 43.9 | +0.7 | |
Conservative | Patricia Sanderson | 296 | 30.3 | -6.9 | |
Independent | Peter Byham | 159 | 16.3 | +16.3 | |
Liberal Democrat | Barry Woodward | 93 | 9.5 | -10.1 | |
Majority | 132 | 13.5 | +7.5 | ||
Turnout | 976 | 48.9 | +12.9 [lower-alpha 1] | ||
Labour hold | Swing |
Party | Candidate | Votes | % | ± | |
---|---|---|---|---|---|
Liberal Democrat | Justin Knight | 594 | 51.2 | -1.4 | |
Conservative | Susan Harper | 292 | 25.2 | +10.8 | |
Labour | David Canning | 275 | 23.7 | -9.4 | |
Majority | 302 | 26.0 | — | ||
Turnout | 1,161 | 27.2 | -1.8 [lower-alpha 1] | ||
Liberal Democrat hold | Swing |
Party | Candidate | Votes | % | ± | |
---|---|---|---|---|---|
Independent | Beverley Oxford [lower-alpha 2] | 807 | 42.5 | +16.2 | |
Liberal Democrat | Paul Booker | 507 | 26.7 | -4.9 | |
Conservative | Shahid Husain | 423 | 22.3 | -10.0 | |
Labour | Hugh Thomas | 163 | 8.6 | -0.8 | |
Majority | 300 | 15.8 | |||
Turnout | 1,900 | 30.3 | +8.3 | ||
Independent hold | Swing |
Party | Candidate | Votes | % | ± | |
---|---|---|---|---|---|
Conservative | Donald Henshall | 1,194 | 62.3 | ||
Liberal Democrat | Helen Bayliss | 569 | 29.7 | ||
Labour | Alan Trudgian | 154 | 8.0 | ||
Majority | 625 | 32.6 | |||
Turnout | 1,917 | 44.7 | +0.7 [lower-alpha 1] | ||
Conservative hold | Swing |
Party | Candidate | Votes | % | ± | |
---|---|---|---|---|---|
Conservative | Richard Gower | 517 | 61.5 | -3.2 | |
Liberal Democrat | Martin Verran | 134 | 16.0 | +0.7 | |
Labour | John Wood | 106 | 12.6 | -7.4 | |
Independent | Patrick Mead | 83 | 9.9 | +9.9 | |
Majority | 383 | 45.6 | +0.9 | ||
Turnout | 840 | 41.0 | +10.0 [lower-alpha 1] | ||
Conservative hold | Swing |
Party | Candidate | Votes | % | ± | |
---|---|---|---|---|---|
Conservative | Brian Jarvis | 681 | 46.1 | +11.0 | |
Liberal Democrat | Peter Mecklenburg | 631 | 42.7 | -1.6 | |
Labour | Janet Smith | 166 | 11.2 | -1.7 | |
Majority | 50 | 3.4 | |||
Turnout | 1,478 | 28.3 | +2.0 | ||
Conservative hold | Swing |
Party | Candidate | Votes | % | ± | |
---|---|---|---|---|---|
Liberal Democrat | Peter Higgins | 972 | 55.3 | +0.3 | |
Conservative | Glenn Bath | 483 | 27.5 | +4.2 | |
Labour | David Hough | 302 | 17.2 | -2.9 | |
Majority | 489 | 27.8 | -3.9 | ||
Turnout | 1,757 | 28.2 | +5.3 | ||
Liberal Democrat hold | Swing |
Party | Candidate | Votes | % | ± | |
---|---|---|---|---|---|
Conservative | Ron Levy | 1,304 | 49.0 | +5.7 | |
Liberal Democrat | John Gray | 1,151 | 43.2 | -5.1 | |
Labour | Luke Dopson | 208 | 7.8 | -0.6 | |
Majority | 153 | 5.7 | |||
Turnout | 2,663 | 44.8 | +8.6 | ||
Conservative gain from Liberal Democrat | Swing | ||||
Party | Candidate | Votes | % | ± | |
---|---|---|---|---|---|
Labour | Tina Dopson | 823 | 52.8 | -9.4 | |
Liberal Democrat | Ralph Johnston | 378 | 24.3 | +3.7 | |
Conservative | Anne Allan | 357 | 22.9 | +8.8 | |
Majority | 445 | 28.6 | -19.1 | ||
Turnout | 1,558 | 22.3 | +2.6 | ||
Labour gain from Independent | Swing | ||||
Party | Candidate | Votes | % | ± | |
---|---|---|---|---|---|
Liberal Democrat | Helen Chuah | 998 | 54.7 | -3.6 | |
Conservative | Angus Allan | 464 | 25.5 | +6.1 | |
Labour | Robert Fisher | 361 | 19.8 | -0.4 | |
Majority | 534 | 29.3 | -8.9 | ||
Turnout | 1,823 | 28.3 | +5.6 | ||
Liberal Democrat hold | Swing |
Party | Candidate | Votes | % | ± | |
---|---|---|---|---|---|
Liberal Democrat | Paul Smith | 929 | 55.4 | -12.4 | |
Conservative | Derek Smith | 587 | 35.0 | +10.9 | |
Labour | Mike Warner | 160 | 9.5 | +1.4 | |
Majority | 342 | 20.4 | — | ||
Turnout | 1,676 | 40.2 | +4.2 [lower-alpha 1] | ||
Liberal Democrat hold | Swing |
Party | Candidate | Votes | % | ± | |
---|---|---|---|---|---|
Conservative | Roger Buston | 777 | 38.4 | +4.6 | |
Liberal Democrat | Barry James | 737 | 36.4 | +10.4 | |
Labour | Kim Naish | 512 | 25.3 | -12.7 | |
Majority | 40 | 2.0 | |||
Turnout | 2,026 | 34.0 | +9.5 | ||
Conservative hold | Swing |
Party | Candidate | Votes | % | ± | |
---|---|---|---|---|---|
Conservative | Andrew Ellis | 1,027 | 47.7 | +12.9 | |
Liberal Democrat | Gwendoline Ilott | 839 | 39.0 | -13.3 | |
Labour | John Spademan | 285 | 13.2 | +0.5 | |
Majority | 188 | 8.7 | -8.9 | ||
Turnout | 2,151 | 35.3 | +6.5 | ||
Conservative gain from Liberal Democrat | Swing | ||||
Party | Candidate | Votes | % | ± | |
---|---|---|---|---|---|
Conservative | Richard Martin | 925 | 41.0 | +6.0 | |
Independent | John Elliott | 741 | 32.8 | -1.9 | |
Labour | Alan Mogridge | 590 | 26.2 | -0.4 | |
Majority | 184 | 8.2 | +7.9 | ||
Turnout | 2,256 | 37.9 | +11.5 | ||
Conservative gain from Independent | Swing | ||||
Party | Candidate | Votes | % | ± | |
---|---|---|---|---|---|
Conservative | John Bouckley | 1,581 | 71.0 | +8.0 | |
Labour | Audrey Spencer | 329 | 14.8 | -5.6 | |
Liberal Democrat | Ronald Baker | 316 | 14.2 | +0.0 | |
Majority | 1,252 | 56.2 | +13.6 | ||
Turnout | 2,226 | 38.6 | +8.5 | ||
Conservative hold | Swing |
Party | Candidate | Votes | % | ± | |
---|---|---|---|---|---|
Conservative | Eugene Kraft | 420 | 46.4 | -7.0 | |
Liberal Democrat | John Galpin | 356 | 39.3 | +22.1 | |
Labour | Aulay MacKenzie | 129 | 14.3 | -15.1 | |
Majority | 64 | 7.1 | |||
Turnout | 905 | 27.2 | +10.4 | ||
Conservative hold | Swing |
Party | Candidate | Votes | % | ± | |
---|---|---|---|---|---|
Conservative | Ann Quarry | 629 | 36.6 | +7.9 | |
Independent | Robert Newman | 476 | 27.7 | New | |
Labour | Thomas Prosser | 322 | 18.7 | -5.8 | |
Liberal Democrat | Jeremy Jacobs | 293 | 17.0 | New | |
Majority | 153 | 8.9 | +2.0 | ||
Turnout | 1,720 | 43.7 | +8.1 | ||
Conservative gain from Independent | Swing | ||||
A by-election took place on 21 October 2004 in Berechurch after the resignation of Liberal Democrat councillor Susan Brooks. [6] Labour's David Harris took the seat from the Liberal Democrats by a majority of 345. [6]
Berechurch is a village in Colchester, Essex, England.
A Councillor is a member of a local government council.
Party | Candidate | Votes | % | ± | |
---|---|---|---|---|---|
Labour | Dave Harris | 838 | 51.5 | +21.0 | |
Liberal Democrat | Martin Verran | 493 | 30.3 | -15.4 | |
Conservative | Andrew Bright | 296 | 18.2 | -5.6 | |
Majority | 345 | 21.2 | |||
Turnout | 1,627 | 30.0 | |||
Labour gain from Liberal Democrat | Swing | ||||
The 2006 Barnet Council election took place on 4 May 2006 to elect members of Barnet London Borough Council in London, England. The whole council was up for election and the Conservative party stayed in overall control of the council.
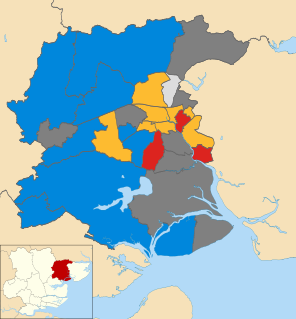
The 2006 Colchester Borough Council election took place on 4 May 2006 to elect members of Colchester Borough Council in Essex, England. One third of the council was up for election and the council stayed under no overall control.
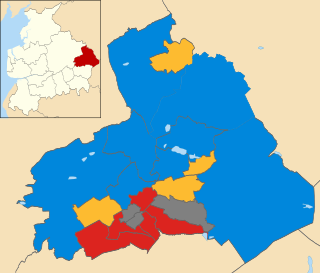
The 2007 Pendle Borough Council election took place on 3 May 2007 to elect members of Pendle Borough Council in Lancashire, England. One third of the council was up for election and the Liberal Democrats stayed in overall control of the council.
The 2004 Basingstoke and Deane Council election took place on 10 June 2004 to elect members of Basingstoke and Deane Borough Council in Hampshire, England. One third of the council was up for election and the council stayed under no overall control.
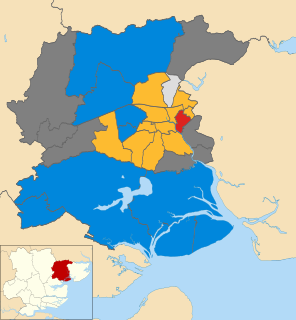
The 2012 Colchester Borough Council election took place on 3 May 2012 to elect members of Colchester Borough Council in Essex, England. One third of the council was up for election and the council stayed under no overall control.
The 2002 Colchester Borough Council election took place on 2 May 2002 to elect members of Colchester Borough Council in Essex, England. This was the same day as the other 2002 local elections in the United Kingdom. Due to boundary changes, every seat was up for election and the council stayed under no overall control.
The 2003 Colchester Borough Council election took place on 1 May 2003 to elect members of Colchester Borough Council in Essex, England. This was the same day as the other 2003 United Kingdom local elections. One third of the seats were up for election and the council stayed under no overall control.
The 2000 Colchester Borough Council election took place on 4 May 2000 to elect members of Colchester Borough Council in Essex, England. One third of the council was up for election and the council stayed under no overall control.
The 2007 Colchester Borough Council election took place on 3 May 2007 to elect members of Colchester Borough Council in Essex, England. One third of the council was up for election and the council stayed under no overall control.
The 2008 Colchester Borough Council election took place on 1 May 2008 to elect members of Colchester Borough Council in Essex, England. One third of the council was up for election and the Conservative party lost overall control of the council to no overall control.
The 2010 Colchester Borough Council election took place on 6 May 2010 to elect members of Colchester Borough Council in Essex, England. One third of the council was up for election and the council stayed under no overall control.
The 2011 Colchester Borough Council election took place on 5 May 2011 to elect members of Colchester Borough Council in Essex, England. One third of the council was up for election and the council stayed under no overall control.
The 2014 Colchester Borough Council election took place on 22 May 2014 to elect members of Colchester Borough Council in Essex, England. One third of the council was up for election and the council stayed under no overall control.
The 2011 Pendle Borough Council election took place on 5 May 2011 to elect members of Pendle Borough Council in Lancashire, England. One third of the council was up for election and the council stayed under no overall control.
The 2012 Pendle Borough Council election took place on 3 May 2012 to elect members of Pendle Borough Council in Lancashire, England. One third of the council was up for election and the council stayed under no overall control.
The 2004 Havant Borough Council election took place on 10 June 2004 to elect members of Havant Borough Council in Hampshire, England. One third of the council was up for election and the Conservative party stayed in overall control of the council.
The 2006 Havant Borough Council election took place on 4 May 2006 to elect members of Havant Borough Council in Hampshire, England. One third of the council was up for election and the Conservative party stayed in overall control of the council.
The 2008 Havant Borough Council election took place on 1 May 2008 to elect members of Havant Borough Council in Hampshire, England. One third of the council was up for election and the Conservative party stayed in overall control of the council.
The 2012 Havant Borough Council election took place on 3 May 2012 to elect members of Havant Borough Council in Hampshire, England. One third of the council was up for election and the Conservative party stayed in overall control of the council.
The 1999 Castle Point Borough Council election took place on 6 May 1999 to elect members of Castle Point Borough Council in Essex, England. The whole council was up for election and the Labour party stayed in overall control of the council.