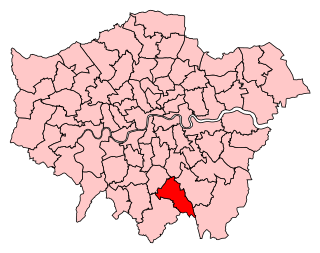
| ||||||||||||||||||||||||||||||||||
All 70 seats to Croydon London Borough Council 36 seats needed for a majority | ||||||||||||||||||||||||||||||||||
---|---|---|---|---|---|---|---|---|---|---|---|---|---|---|---|---|---|---|---|---|---|---|---|---|---|---|---|---|---|---|---|---|---|---|
| ||||||||||||||||||||||||||||||||||
Map of the results of the 2006 Croydon council election. Conservatives in blue and Labour in red. | ||||||||||||||||||||||||||||||||||
|
Elections to Croydon Council in London, England were held on 4 May 2006. The whole council was up for election for the first time since the 2002 election. The Labour Party lost control of the council to the Conservative Party for the first time since 1994.
The London Borough of Croydon is a London borough in south London, England and is part of Outer London. It covers an area of 87 km2 (33.6 sq mi) and is the largest London borough by population. It is the southernmost borough of London. At its centre is the historic town of Croydon from which the borough takes its name. Croydon is mentioned in Domesday Book, and from a small market town has expanded into one of the most populous areas on the fringe of London. Croydon is the civic centre of the borough. The borough is now one of London's leading business, financial and cultural centres, and its influence in entertainment and the arts contribute to its status as a major metropolitan centre.
England is a country that is part of the United Kingdom. It shares land borders with Wales to the west and Scotland to the north-northwest. The Irish Sea lies west of England and the Celtic Sea lies to the southwest. England is separated from continental Europe by the North Sea to the east and the English Channel to the south. The country covers five-eighths of the island of Great Britain, which lies in the North Atlantic, and includes over 100 smaller islands, such as the Isles of Scilly and the Isle of Wight.
The Labour Party is a centre-left political party in the United Kingdom which has been described as an alliance of social democrats, democratic socialists and trade unionists. The party's platform emphasises greater state intervention, social justice and strengthening workers' rights.
Party | Seats | Gains | Losses | Net gain/loss | Seats % | Votes % | Votes | +/− | |
---|---|---|---|---|---|---|---|---|---|
Conservative | 43 | 11 | 0 | +11 | 61.4 | 44.8 | 49,341 | -0.4 | |
Labour | 27 | 0 | 10 | -10 | 38.6 | 25.9 | 28,534 | -12.1 | |
Liberal Democrat | 0 | 0 | 1 | -1 | 0.0 | 13.4 | 14,778 | +1.2 | |
Green | 0 | 0 | 0 | 0 | 0.0 | 9.2 | 10,165 | +8.9 | |
UKIP | 0 | 0 | 0 | 0 | 0.0 | 3.1 | 3,405 | +2.0 | |
BNP | 0 | 0 | 0 | 0 | 0.0 | 1.3 | 1,464 | N/A | |
Independent | 0 | 0 | 0 | 0 | 0.0 | 1.0 | 1,083 | -0.7 | |
Pensions Action Alliance | 0 | 0 | 0 | 0 | 0.0 | 0.4 | 406 | N/A | |
People's Choice | 0 | 0 | 0 | 0 | 0.0 | 0.3 | 281 | -0.9 | |
Croydon Ratepayers Against Croydon Council | 0 | 0 | 0 | 0 | 0 | 0.2 | 229 | N/A | |
Communist | 0 | 0 | 0 | 0 | 0.0 | 0.2 | 177 | N/A |
Party | Seats | Current Council | |||||||||||||||||||||||||||||||||||||||||||||||||||||||||||||||||||||||
---|---|---|---|---|---|---|---|---|---|---|---|---|---|---|---|---|---|---|---|---|---|---|---|---|---|---|---|---|---|---|---|---|---|---|---|---|---|---|---|---|---|---|---|---|---|---|---|---|---|---|---|---|---|---|---|---|---|---|---|---|---|---|---|---|---|---|---|---|---|---|---|---|---|
2002 | 2006 [2] | ||||||||||||||||||||||||||||||||||||||||||||||||||||||||||||||||||||||||
Conservatives | 31 | 43 | |||||||||||||||||||||||||||||||||||||||||||||||||||||||||||||||||||||||
Labour | 37 | 27 | |||||||||||||||||||||||||||||||||||||||||||||||||||||||||||||||||||||||
Lib Dems | 1 | 0 |
Party | Candidate | Votes | % | ± | |
---|---|---|---|---|---|
Conservative | Russell Jackson | 1,973 | |||
Conservative | Andrew Price | 1,948 | |||
Conservative | Maria Garcia de la Huerta | 1,842 | |||
Labour | Sean Fitzsimons | 1,672 | |||
Labour | Amanda Campbell | 1,653 | |||
Labour | Mark Watson | 1,607 | |||
Green | Mario Barnsley | 850 | |||
Liberal Democrat | Paul Rogers | 760 | |||
Turnout | 4,437 | 40.0% | |||
Registered electors | |||||
Conservative gain from Labour | Swing | ||||
Party | Candidate | Votes | % | ± | |
---|---|---|---|---|---|
Conservative | Lindsay Frost | 2,513 | |||
Conservative | Eddy Arram | 2,431 | |||
Conservative | Avril Slipper | 2,390 | |||
Labour | Rona MacDonald | 1,057 | |||
Labour | Peter Spalding | 971 | |||
Labour | Jitinder Singh | 904 | |||
Green | Bernice Golberg | 628 | |||
Liberal Democrat | Nirma Ramful | 550 | |||
UKIP | Jeanette Nathan | 336 | |||
Turnout | 4,324 | 42.7% | |||
Registered electors | |||||
Conservative hold | Swing | ||||
Party | Candidate | Votes | % | ± | |
---|---|---|---|---|---|
Labour | Raj Rajendran | 1,846 | |||
Labour | Paula Shaw | 1,805 | |||
Labour | Greta Sohoye | 1,670 | |||
Conservative | Roger Taylor | 1,117 | |||
Conservative | John Tooze | 861 | |||
Conservative | Alan Winborn | 774 | |||
Green | Susan Parsons | 531 | |||
UKIP | James Feisenberger | 305 | |||
Turnout | 3,407 | 32.9% | |||
Registered electors | |||||
Labour hold | Swing | ||||
Party | Candidate | Votes | % | ± | |
---|---|---|---|---|---|
Labour | Stuart Collins | 1,777 | |||
Labour | Mike Selva | 1,600 | |||
Labour | Manju Shahul-Hameed | 1,576 | |||
Conservative | Ian Parker | 1,076 | |||
Conservative | Patrick Ratnaraja | 1,073 | |||
Conservative | Jill Thomas | 975 | |||
Liberal Democrat | Syed Mohiuddin | 513 | |||
Communist | Peter Latham | 177 | |||
Turnout | 3,426 | 31.5% | |||
Registered electors | |||||
Labour hold | Swing | ||||
Party | Candidate | Votes | % | ± | |
---|---|---|---|---|---|
Conservative | Christopher Wright | 3,393 | |||
Conservative | Brian Udell | 3,321 | |||
Conservative | Terry Lenton | 3,102 | |||
Liberal Democrat | Ian Atkins | 2,124 | |||
Liberal Democrat | Simon Hargrave | 1,817 | |||
Liberal Democrat | Patricia Knight | 1,765 | |||
Turnout | 5,350 | 56.8% | |||
Registered electors | |||||
Conservative gain from Liberal Democrat | Swing | ||||
Conservative hold | Swing | ||||
Party | Candidate | Votes | % | ± | |
---|---|---|---|---|---|
Conservative | David Osland | 2,706 | |||
Conservative | Gavin Barwell | 2,685 | |||
Conservative | Brian Cakebread | 2,640 | |||
Liberal Democrat | Avril Bristow | 775 | |||
Liberal Democrat | Jean Callen | 745 | |||
Liberal Democrat | Brian Glaister | 627 | |||
Labour | Sarah Ward | 481 | |||
Labour | Richard Ackland | 475 | |||
Labour | Lee Findell | 435 | |||
Green | Andrew Lindsay | 429 | |||
The People's Choice | Sheila Lockwood | 168 | |||
Turnout | 4,226 | 42.8% | |||
Registered electors | |||||
Conservative hold | Swing | ||||
Party | Candidate | Votes | % | ± | |
---|---|---|---|---|---|
Conservative | Maria Gatland | 2,590 | |||
Conservative | Michael Neal | 2,418 | |||
Conservative | Jason Perry | 2,378 | |||
Liberal Democrat | Michael Bishopp | 861 | |||
Liberal Democrat | Sheelagh Crampton | 739 | |||
Labour | Laura Doughty | 722 | |||
Labour | Paul Anderson | 697 | |||
Liberal Democrat | Edward Maxfield | 609 | |||
Green | Stephen Harris | 569 | |||
Labour | James Mburu | 566 | |||
UKIP | William Bailey | 206 | |||
The People's Choice | Evelyn Lane | 113 | |||
The People's Choice | Debra Cannam | 112 | |||
The People's Choice | Mark Samuel | 96 | |||
Turnout | 4,460 | 41.4% | |||
Registered electors | 10,785 | ||||
Conservative hold | Swing | ||||
Party | Candidate | Votes | % | ± | |
---|---|---|---|---|---|
Conservative | Vidhi Mohan | 2,070 | |||
Conservative | Susan Winborn | 2,042 | |||
Conservative | David Fitze | 2,010 | |||
Labour | Peter Horah | 870 | |||
Labour | Yvonne Gosling | 834 | |||
Labour | Dominic O'Donnell | 807 | |||
Liberal Democrat | Jill George | 640 | |||
Green | Julia Barnsley | 629 | |||
UKIP | Edwin Wigley | 226 | |||
Monster Raving Loony | John Cartwright | 200 | |||
Turnout | 3,808 | 37.6% | |||
Registered electors | |||||
Conservative hold | Swing | ||||
Party | Candidate | Votes | % | ± | |
---|---|---|---|---|---|
Labour | Simon Hall | 949 | |||
Labour | Carole Bonner | 862 | |||
BNP | Matthew Bedford | 692 | |||
Conservative | Roland Petit | 677 | |||
Conservative | Andrew Stranack | 477 | |||
UKIP | Lynnda Robson | 213 | |||
Turnout | 2,293 | 34.2% | |||
Registered electors | |||||
Labour hold | Swing | ||||
Party | Candidate | Votes | % | ± | |
---|---|---|---|---|---|
Conservative | Margaret Mead | 3,076 | |||
Conservative | Helen Pollard | 2,936 | |||
Conservative | Enley Taylor | 2,749 | |||
Labour | Sarah Jones | 761 | |||
Liberal Democrat | Stephen Cleary | 654 | |||
Labour | Moira O'Donnell | 642 | |||
Labour | Romney Tansley | 598 | |||
Liberal Democrat | Peter Ladanyi | 529 | |||
UKIP | Andrew Paice | 411 | |||
Turnout | 4,405 | 44.7% | |||
Registered electors | |||||
Conservative hold | Swing | ||||
Party | Candidate | Votes | % | ± | |
---|---|---|---|---|---|
Conservative | Jan Buttinger | 2,631 | |||
Conservative | Steve O'Connell | 2,530 | |||
Conservative | Steve Hollands | 2,523 | |||
Liberal Democrat | Angela Catto | 757 | |||
Green | Tom Voute | 729 | |||
Liberal Democrat | Linda Evans | 650 | |||
Labour | Joy Prince | 461 | |||
Labour | Mohammed Mir | 406 | |||
Turnout | 4,367 | 41.7% | |||
Registered electors | |||||
Conservative hold | Swing | ||||
Party | Candidate | Votes | % | ± | |
---|---|---|---|---|---|
Labour | Brenda Kirby | 1,356 | |||
Labour | George Ayres | 1,257 | |||
Conservative | Peter Kirby | 1,046 | |||
Conservative | Anthony Pearson | 1,040 | |||
BNP | Clifford May | 772 | |||
UKIP | Ian Edwards | 256 | |||
Liberal Democrat | Stephanie Offer | 139 | |||
Turnout | 3,228 | 44.8% | |||
Registered electors | |||||
Labour hold | Swing | ||||
Party | Candidate | Votes | % | ± | |
---|---|---|---|---|---|
Labour | Maggie Mansell | 2,434 | |||
Labour | Shafi Khan | 2,428 | |||
Labour | Sherwan Chowdhury | 2,333 | |||
Conservative | Gloria Hutchens | 1,751 | |||
Conservative | Tirena Gunter | 1,679 | |||
Conservative | Adam Kellett | 1,557 | |||
Liberal Democrat | Leo Held | 553 | |||
Green | Michael O'Sullivan | 511 | |||
Turnout | 4,784 | 43.6% | |||
Registered electors | |||||
Labour hold | Swing | ||||
Party | Candidate | Votes | % | ± | |
---|---|---|---|---|---|
Conservative | Graham Bass | 2,768 | |||
Conservative | Derek Millard | 2,631 | |||
Conservative | Donald Speakman | 2,488 | |||
Liberal Democrat | Kathleen Austin | 786 | |||
Labour | Colin Bagnall | 700 | |||
Liberal Democrat | Gordon Burnett | 670 | |||
Green | Simon Desorgher | 599 | |||
Labour | Maria Khan | 528 | |||
Labour | Suren Pandita | 495 | |||
UKIP | Kathleen Garner | 280 | |||
Turnout | 4,159 | 41.0% | |||
Registered electors | |||||
Conservative hold | Swing | ||||
Party | Candidate | Votes | % | ± | |
---|---|---|---|---|---|
Conservative | Lynne Hale | 3,567 | |||
Conservative | Timothy Pollard | 3,470 | |||
Conservative | Yvette Hopley | 3,447 | |||
Liberal Democrat | Anne Howard | 570 | |||
Liberal Democrat | Susan Gauge | 562 | |||
Labour | Daniel Harvey | 429 | |||
Labour | Barry Buttigieg | 393 | |||
Labour | Tejinder Madhar | 369 | |||
UKIP | Alan Smith | 338 | |||
Turnout | 4,700 | 48.6% | |||
Registered electors | |||||
Conservative hold | Swing | ||||
Party | Candidate | Votes | % | ± | |
---|---|---|---|---|---|
Labour | Timothy Godfrey | 1,652 | |||
Labour | Toni Letts | 1,597 | |||
Labour | Gerry Ryan | 1,452 | |||
Conservative | Margaret Bird | 906 | |||
Conservative | Audrey Terrey | 893 | |||
Conservative | William Proudfoot | 861 | |||
Green | Megan Braid-Pittordou | 588 | |||
Liberal Democrat | Lynn Roulstone | 570 | |||
Turnout | 3,220 | 31.4% | |||
Registered electors | |||||
Labour hold | Swing | ||||
Party | Candidate | Votes | % | ± | |
---|---|---|---|---|---|
Conservative | Dudley Mead | 3,397 | |||
Conservative | Sara Bashford | 3,396 | |||
Conservative | Phil Thomas | 3,215 | |||
Liberal Democrat | John Jefkins | 651 | |||
Liberal Democrat | Margaret Burnett | 625 | |||
Labour | Peter Hopson | 535 | |||
Labour | Rae Goonetilleke | 451 | |||
UKIP | Claire Smith | 416 | |||
Labour | Femi Yusoof | 373 | |||
Turnout | 4,719 | 50.4% | |||
Registered electors | |||||
Conservative hold | Swing | ||||
Party | Candidate | Votes | % | ± | |
---|---|---|---|---|---|
Conservative | Janet Marshall | 3,270 | |||
Conservative | Richard Chatterjee | 2,924 | |||
Conservative | Mike Fisher | 2,888 | |||
Independent | Marzia Nicodemi-Ehikioya | 1,083 | |||
Labour | Norman Glass | 896 | |||
Labour | Mark Justice | 869 | |||
Labour | Lorraine Walters | 799 | |||
Liberal Democrat | Paul West | 603 | |||
Green | Ian Dixon | 590 | |||
Turnout | 5,014 | 48.1% | |||
Registered electors | |||||
Conservative hold | Swing | ||||
Party | Candidate | Votes | % | ± | |
---|---|---|---|---|---|
Conservative | Susan Bennett | 1,670 | |||
Conservative | Luke Clancy | 1,523 | |||
Labour | Jane Avis | 1,492 | |||
Labour | Kathy Bee | 1.393 | |||
Labour | Andy Bagnall | 1,385 | |||
Conservative | Mohammed Quadir | 1,271 | |||
Green | Tim Fernandes-Bonnar | 717 | |||
Liberal Democrat | Julie Hardy-McBride | 684 | |||
Liberal Democrat | Jan Perry | 616 | |||
UKIP | Brian Hutchings | 233 | |||
Turnout | 3,997 | 37.2% | |||
Registered electors | |||||
Conservative gain from Labour | Swing | ||||
Labour hold | Swing | ||||
Party | Candidate | Votes | % | ± | |
---|---|---|---|---|---|
Labour | Pat Clouder | 1,644 | |||
Labour | Matthew Kyeremeh | 1,427 | |||
Labour | Louisa Woodley | 1,421 | |||
Conservative | Florence Evans | 902 | |||
Conservative | Melanie Hutchens | 833 | |||
Liberal Democrat | Jonathan Cope | 819 | |||
Conservative | Michele O'Connell | 776 | |||
Liberal Democrat | Stephen Dering | 697 | |||
Liberal Democrat | Tomas Howard-Jones | 638 | |||
Turnout | 3,445 | 31.5% | |||
Registered electors | |||||
Labour hold | Swing | ||||
Party | Candidate | Votes | % | ± | |
---|---|---|---|---|---|
Conservative | Robert Askey | 1,650 | |||
Labour | Pat Ryan | 1,637 | |||
Conservative | George Filbey | 1,566 | |||
Labour | Alisa Flemming | 1,561 | |||
Conservative | Clare Hilley | 1,489 | |||
Labour | Ian Payne | 1,461 | |||
Green | Anna Martin | 732 | |||
Green | Shasha Khan | 729 | |||
Green | Tom Real | 527 | |||
UKIP | Joan Tyndall | 185 | |||
Turnout | 4,092 | 37.9% | |||
Registered electors | |||||
Conservative gain from Labour | Swing | ||||
Labour hold | Swing | ||||
Conservative gain from Labour | Swing | ||||
Party | Candidate | Votes | % | ± | |
---|---|---|---|---|---|
Conservative | Tony Harris | 2,335 | |||
Conservative | Jonathan Driver | 2,285 | |||
Conservative | Simon Hoar | 2,215 | |||
Labour | Alison Butler | 2,040 | |||
Labour | Charlotte McAree | 1,973 | |||
Labour | Paul Smith | 1,942 | |||
Green | Mary Davey | 485 | |||
Liberal Democrat | Valerie Hargrave | 402 | |||
Liberal Democrat | Geoffrey Gauge | 395 | |||
Pensions Action Alliance | Eileen Daisley | 135 | |||
Pensions Action Alliance | Alan Crawley | 133 | |||
Pensions Action Alliance | Helen Crawley | 117 | |||
Turnout | 5,077 | 45.8% | |||
Registered electors | |||||
Conservative gain from Labour | Swing | ||||
Party | Candidate | Votes | % | ± | |
---|---|---|---|---|---|
Labour | Raj Chandarana | 1,660 | |||
Labour | Bernadette Khan | 1,521 | |||
Labour | Mike Mogul | 1,387 | |||
Conservative | Christina Blair | 1,115 | |||
Conservative | Mehmet Bezginsoy | 919 | |||
Conservative | Bilgin Duven | 916 | |||
Liberal Democrat | Mahmud Ahsanollah | 590 | |||
Green | Santheya Natarajan | 539 | |||
Turnout | 3,386 | 31.4% | |||
Registered electors | |||||
Labour hold | Swing | ||||
Party | Candidate | Votes | % | ± | |
---|---|---|---|---|---|
Labour | Karen Jewitt | 1,463 | |||
Labour | Tony Newman | 1,415 | |||
Labour | Paul Scott | 1,225 | |||
Conservative | Benjamin Grainger | 1,178 | |||
Conservative | Desmond Wright | 1,059 | |||
Conservative | Stephen Ghero | 987 | |||
Liberal Democrat | Patricia West | 597 | |||
Green | Ivonne Fernandes-Bonnar | 581 | |||
Pensions Action Alliance | David Young | 271 | |||
Croydon Ratepayers Against Croydon Council | Colin Cole | 229 | |||
Pensions Action Alliance | Daphne Akeroyd | 211 | |||
Pensions Action Alliance | John Akeroyd | 168 | |||
Turnout | 3,485 | 33.8% | |||
Registered electors | |||||
Labour hold | Swing | ||||
There are 24 wards which represent Croydon Council. All Croydon Council seats were up for re-election for the first time since the 2002 elections, during the election on 4 May 2006. Previously Labour held control of the council. In the election, the Conservatives took 10 seats from Labour and 1 from the Liberal Democrats. Since the defection of a Labour councillor to the Conservatives, [3] giving the newly elected council's political composition as: [4]
Ward | Members elected in 2006 |
Addiscombe | Russell Jackson (Con) |
Andrew Price (Con) | |
Maria Garcia de la Huerta (Con) | |
Ashburton | Lindsay Frost (Con) |
Eddy Arram (Con) | |
Avril Slipper (Con) | |
Bensham Manor | Raj Rajendran (Lab) |
Greta Sohoye (Lab) | |
Alison Butler (Lab) | |
Broad Green | Stuart Collins (Lab) |
Mike Selva (Lab) | |
Manju Shahul-Hameed (Lab) | |
Coulsdon East | Christopher Wright (Con) |
Brian Udell (Con) | |
Terry Lenton (Con) | |
Coulsdon West | David Osland (Con) |
Gavin Barwell (Con) | |
Brian Cakebread (Con) | |
Croham | Maria Gatland (Con) |
Michael Neal (Con) | |
Jason Perry (Con) | |
Fairfield | Vidhi Mohan (Con) |
Susan Winborn (Con) | |
David Fitze (Con) | |
Fieldway | Simon Hall (Lab) |
Carole Bonner (Lab) | |
Heathfield | Linda Bailey (Con) |
Sharon Massey (Con) | |
Andy John Waters (Con) | |
Kenley | Jan Buttinger (Con) |
Steve O'Connell (Con) | |
Steve Hollands (Con) | |
New Addington | Brenda Kirby (Lab) |
George Ayres (Lab) | |
Norbury | Maggie Mansell (Lab) |
Shafi Khan (Lab) | |
Sherwan Chowdhury (Lab) | |
Purley | Graham Bass (Con) |
Derek Millard (Con) | |
Donald Speakman (Con) | |
Sanderstead | Lynne Hale (Con) |
Timothy Pollard (Con) | |
Yvette Hopley (Con) | |
Selhurst | Timothy Godfrey (Lab) |
Toni Letts (Lab) | |
Selsdon and Ballards | Dudley Mead (Con) |
Sara Bashford (Con) | |
Phil Thomas (Con) | |
Shirley | Janet Marshall (Con) |
Richard Chatterjee (Con) | |
Mike Fisher (Con) | |
South Norwood | Susan Bennett (Con) |
Luke Clancy (Con) | |
Jane Avis (Lab) | |
Thornton Heath | Pat Clouder (Lab) |
Matthew Kyeremeh (Lab) | |
Louisa Woodley (Lab) | |
Upper Norwood | Robert Askey (Con) |
Pat Ryan (Lab) | |
George Filbey (Con) | |
Waddon | Tony Harris (Con) |
Jonathan Driver (Con) | |
Simon Hoar (Con) | |
West Thornton | Raj Chandarana (Lab) |
Bernadette Khan (Lab) | |
Mike Mogul (Con) | |
Woodside | Karen Jewitt (Lab) |
Tony Newman (Lab) | |
Paul Scott (Lab) | |
Croydon Central is a constituency created in 1974 and is represented in the House of Commons of the UK Parliament since 2017 by Labour MP Sarah Jones. The seat bucked the national results in 2005 and in 2017, leaning to right and left respectively being in other results a bellwether, its winner belonging to the winning party nationally since 1979.
The Democratic Labour Party was a small British left-wing political party in Walsall, sometimes known as the Walsall Democratic Labour Party. It was founded as a breakaway from the Labour Party after left-wing members were expelled in the mid-90s.
Elections for the Council in the London Borough of Croydon are held every four years to elect 70 councillors. At the last elections, which were held in May 2014, 30 Conservative councillors and 40 Labour councillors, providing a Labour majority of ten seats.
Elections to Durham County Council are held every four years. The council was created as part of the 1972 local government reforms. The first elections to the new authority were held in 1973 in advance of the council taking office in 1974. As part of changes to local government in 2009, the council became a unitary authority with the first elections to the new council taking place in 2008. Since becoming a unitary authority, 126 councillors have been elected from 63 wards.
Local government elections took place in London, and some other parts of the United Kingdom on Thursday 4 May 2006. Polling stations were open between 7am and 10pm.
Hertfordshire County Council in England is elected every four years. Since the last boundary changes, that took effect for the 2001 election, 77 councillors are elected for single member districts.
The 2007 Harlow District Council election took place on 3 May 2007 to elect members of Harlow District Council in Essex, England. One third of the council was up for election and the council stayed under no overall control.
Elections to Croydon Council in London, England were held on 4 May 2002. The whole council was up for election for the first time since the 1998 election. The Labour Party managed to keep control of the council which it had done since 1994 when it took power away from the Conservative Party. This year Labour held Croydon with a smaller majority, only clinging onto power through a tiny number of votes in its marginal wards - one councillor won by just eight votes.
Elections to Manchester City Council took place on 1 May 2008. One third of the council was up for election - every ward of the city returned one councillor at this election out of the three councillors a ward in the city has.
Elections for Coventry City Council were held on Thursday 1 May 2008. As the council is elected by thirds, one seat in each of the wards was up for election.
Elections for the London Borough of Merton were held on 7 May 1998 to elect members of Merton London Borough Council in London, England. This was on the same day as other local elections in England and a referendum on the Greater London Authority; in the latter, Merton voted in favour of creating the Greater London Authority by 72.2% on a 37.6% turnout.
An election for the Borough Council in Slough, England, was held on 6 May 2010. This was the 124th Slough general local authority election since Slough became a local government unit in 1863.
The 2010 Enfield Council election took place on 6 May 2010 to elect members of Enfield London Borough Council in London, England. The whole council was up for election and the Labour party gained overall control of the council from the Conservative party.
Steven Mark Ward Reed is a British Labour and Co-operative Party politician who has been the Member of Parliament (MP) for Croydon North since 2012. He was previously the Leader of Lambeth Council from 2006 to 2012.
The 2006 Solihull Metropolitan Borough Council election took place on 4 May 2006 to elect members of Solihull Metropolitan Borough Council in the West Midlands, England. One third of the council was up for election and the Conservative party stayed in overall control of the council.
The 2003 elections for Guildford Borough Council were the first, and as of 2011 the only, full election for Guildford Borough Council conducted by an all postal ballot. The result saw the Conservatives win a majority of seats on Guildford Borough Council for the first time since losing their majority in the 1991 election.
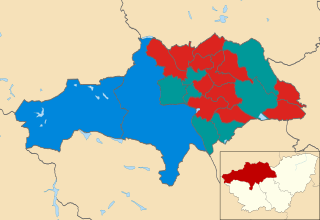
The 2007 Barnsley Metropolitan Borough Council election took place on 3 May 2007 to elect members of Barnsley Metropolitan Borough Council in South Yorkshire, England. One third of the council was up for election and the Labour party stayed in overall control of the council.
The Cardiff Council election in 2008 was held on 1 May, along with other local elections in the UK. All 75 seats of Cardiff Council were contested, with it remaining in no overall control. It was preceded by the 2004 election and followed by the 2012 election
The 2006 Brent London Borough Council election took place on 4 May 2006 to elect members of Brent London Borough Council in London, England. The whole council was up for election and the Labour party lost overall control of the council to no overall control.
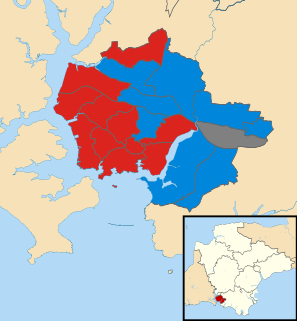
The 2018 Plymouth City Council election took place on 3 May 2018 to elect members of Plymouth City Council in England. The election was won by the Labour Party, who gained enough seats to achieve an overall majority and took control of the council.
The Croydon Guardian is a weekly free local newspaper covering the London Borough of Croydon, South London, and surrounding areas. The newspaper is published every Wednesday and is distributed free of charge in the borough of Croydon. It is sold for 60 pence at newsagents and other shops in and around the borough. With an average distribution of 99,753 copies, it is one of Newsquest's most read newspapers in London.
The Guardian is a British daily newspaper. It was founded in 1821 as The Manchester Guardian, and changed its name in 1959. Along with its sister papers The Observer and The Guardian Weekly, the Guardian is part of the Guardian Media Group, owned by the Scott Trust. The trust was created in 1936 to "secure the financial and editorial independence of the Guardian in perpetuity and to safeguard the journalistic freedom and liberal values of the Guardian free from commercial or political interference". The trust was converted into a limited company in 2008, with a constitution written so as to maintain for The Guardian the same protections as were built into the structure of the Scott Trust by its creators. Profits are reinvested in journalism rather than distributed to owners or shareholders.