Hull—Aylmer

Last updated • 4 min readFrom Wikipedia, The Free Encyclopedia

Hull—Aylmer
Flag of Quebec.svg Quebec electoral district
HullAylmer.jpg
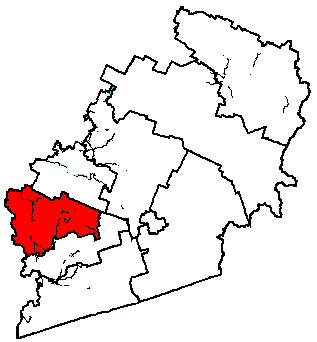
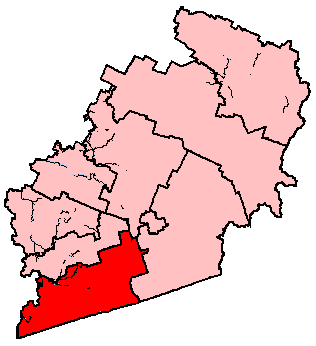
Hull—Aylmer in relation to districts in the Gatineau/Hull region (2003 boundaries)
Coordinates: 45°25′44″N75°48′07″W / 45.429°N 75.802°W / 45.429; -75.802
Federal electoral district
Legislature House of Commons
MP


Greg Fergus
Liberal
District created1914
First contested 1917
Last contested 2021
District webpage profile, map
Demographics
Population (2016) [1] 105,419
Electors (2019)79,072
Area (km²) [2] 65
Pop. density (per km²)1,621.8
Census division(s) Gatineau
Census subdivision(s) Gatineau

Hull—Aylmer (formerly known as Hull) is a federal electoral district in Quebec, Canada, that has been represented in the House of Commons of Canada since 1917.

Contents

It was created as "Hull" in 1914 from parts of Labelle and Wright ridings. It was renamed "Hull—Aylmer" in 1984.

It encompasses the parts of the sectors of Hull and Aylmer located in the city of Gatineau, Quebec. The neighbouring ridings are Gatineau, Pontiac, Ottawa West—Nepean, Ottawa Centre, and Ottawa—Vanier.

With its large percentage of civil servants, the riding was a Liberal stronghold for almost a century, and the safest Liberal riding in the province outside Greater Montreal. Even when the rest of the province was turning its back on the Liberals, they survived in Hull—Aylmer in 1984, 2004 and 2006. In 2008, however, it was the only riding in Canada where four candidates received over 15% of the vote, and was the only riding in Quebec outside the Montreal area the Liberals won. In a major turnaround during the 2011 elections, however, the New Democratic Party won the riding as part of its sweep of the Outaouais. To date, this is the only time the Liberals have lost this riding in an election. The winner of that election, Nycole Turmel, was the interim leader of the NDP from July 28, 2011 until March 24, 2012, following the death of NDP leader Jack Layton. The only other time it was out of Liberal hands was from 1990 to 1993, when Gilles Rocheleau crossed the floor to the Bloc Québécois.

Hull—Aylmer lost territory to Pontiac during the 2012 electoral redistribution. It reverted to form at the 2015 election, when Liberal Greg Fergus handily defeated Turmel as part of the Liberals' clean sweep of the Outaouais.

Political geography

In the 2006 election, only five polls in the Aylmer sector did not vote Liberal. In the Hull sector, the Bloc Québécois performed very well in almost every neighbourhood. The Bloc's support was the most highly concentrated in the Wrightville, Mont-Bleu and Des Hautes Plaines neighbourhoods of Hull, but they also performed well in Le Plateau, Birch Manor, Jardins-Mackenzie-King, Jardins-Alexandre-Taché, Val-Tétreau, Lac-des-Fées and Ironside. Liberal support was constrained mostly to the neighbourhood of Parc-de-la-Montagne and the Île de Hull which was generally evenly split between the two parties. The Conservatives did not win a single poll in the riding, despite finishing ahead of the NDP which won two in Aylmer. The NDP won a poll in Lakeview Terrace as well as a poll in Parc-Glenwood, where it received less than 25% of the vote, despite winning it.

The strength of the Liberal party in this riding over so many years stems from the federal government influence generally seen in the city of Gatineau. This was the legacy of the federal bilingualism policy of the 1970s (which saw the liberal government of Pierre Trudeau in power) which resulted in the requirement for federal jobs to be distributed on both sides of the river. This was the impetus for the construction of the Portage complex in downtown Hull, which today dominates the commercial sector of the city. A significant number of residents in the riding work for the federal public service, with many working in the federal departments and agencies based in the Place du Portage buildings of downtown Hull. This is in addition to the residents who commute across the bridge to federal jobs in Ottawa.

Demographics

According to the 2021 Canadian census [3]

Ethnic groups: 71.7% White, 11.6% Black, 4.0% Indigenous, 3.9% Arab, 2.4% Latin American, 1.9% Chinese, 1.1% South Asian

Languages: 60.9% French, 17.5% English, 3.2% Arabic, 2.4% Spanish, 1.0% Portuguese, 1.0% Mandarin

Religions: 57.8% Christian (43.7% Catholic, 1.4% Christian Orthodox, 1.1% Anglican, 11.6% Other), 6.7% Muslim, 33.4% None

Median income: $46,000 (2020)

Average income: $55,200 (2020)

Members of Parliament

This riding has elected the following members of Parliament:

ParliamentYearsMemberParty
Hull
Riding created from Labelle and Wright
13th  1917–1921   Joseph-Éloi Fontaine Liberal
14th  1921–1925
15th  1925–1926
16th  1926–1930
17th  1930–1935 Alphonse Fournier
18th  1935–1940
19th  1940–1945
20th  1945–1949
21st  1949–1953
22nd  1953–1957 Alexis Caron
23rd  1957–1958
24th  1958–1962
25th  1962–1963
26th  1963–1965
27th  1965–1966
 1966–1968 Pierre Caron
28th  1968–1972 Gaston Isabelle
29th  1972–1974
30th  1974–1979
31st  1979–1980
32nd  1980–1984
Hull—Aylmer
33rd  1984–1988   Gaston Isabelle Liberal
34th  1988–1990 Gilles Rocheleau
 1990–1990   Independent
 1990–1993   Bloc Québécois
35th  1993–1997   Marcel Massé Liberal
36th  1997–1999
 1999–2000 Marcel Proulx
37th  2000–2004
38th  2004–2006
39th  2006–2008
40th  2008–2011
41st  2011–2015   Nycole Turmel New Democratic
42nd  2015–2019   Greg Fergus Liberal
43rd  2019–2021
44th  2021–present

Election results

Hull—Aylmer, 1984–present

Graph of election results in Hull—Aylmer (since 1984, minor parties that never got 2% of the vote or didn't run consistently are omitted)
2021 Canadian federal election
PartyCandidateVotes%±%Expenditures
Liberal Greg Fergus 26,89252.5−1.6$63,261.55
Bloc Québécois Simon Provost8,32316.2+1.6$12,271.08
New Democratic Samuel Gendron6,48312.7−0.9$1,357.33
Conservative Sandrine Perion5,50710.7+1.6$12,393.59
People's Eric Fleury1,8643.6+2.4$2,637.53
Green Simon Gnocchini-Messier1,4592.8−4.2$9,342.81
Free Josée Lafleur3750.7N/A$4,513.90
Rhinoceros Mike LeBlanc2030.4±0.0$0.00
Independent Catherine Dickins1430.3N/A$0.00
Total valid votes/expense limit51,24998.7$109,916.55
Total rejected ballots6661.3
Turnout51,91566.5
Registered voters78,032
Liberal hold Swing −1.6
Source: Elections Canada [4]
2021 federal election redistributed results [5]
PartyVote %
  Liberal 25,44652.46
  Bloc Québécois 7,81016.10
  New Democratic 6,17712.74
  Conservative 5,22910.78
  People's 1,7723.65
  Green 1,3682.82
 Others7001.44
2019 Canadian federal election
PartyCandidateVotes%±%Expenditures
Liberal Greg Fergus 29,73254.1+2.73none listed
Bloc Québécois Joanie Riopel8,01114.6+8.06$2,949.94
New Democratic Nicolas Thibodeau7,46713.6−17.92$26,504.52
Conservative Mike Duggan4,9799.1+1.38$18,923.80
Green Josée Poirier Defoy3,8697.0+5.13$9,958.48
People's Rowen Tanguay6381.2$638.31
Rhinoceros Sébastien Grenier1950.4$0.00
Marxist–Leninist Alexandre Deschênes1020.2+0.02$0.00
Total valid votes/expense limit54,993100.0
Total rejected ballots692
Turnout55,68570.4
Eligible voters79,072
Liberal hold Swing −2.67
Source: Elections Canada [6] [7]
2015 Canadian federal election
PartyCandidateVotes%±%Expenditures
Liberal Greg Fergus 28,47851.37+30.88$77,403.19
New Democratic Nycole Turmel 17,47231.52−27.26$73,823.88
Conservative Étienne Boulrice4,2787.72-2.33$3,208.51
Bloc Québécois Maude Chouinard-Boucher3,6256.54−2.14$5,830.63
Green Roger Fleury1,0351.87−0.14$6,523.33
Christian Heritage Sean J. Mulligan2910.52$5,299.81
Independent Luc Desjardins1600.3
Marxist–Leninist Gabriel Girard1010.18
Total valid votes/Expense limit55,440100.0 $213,352.22
Total rejected ballots391
Turnout55,83170.8%
Eligible voters78,773
Liberal gain from New Democratic Swing 28.92%
Source: Elections Canada [8] [9]
2011 federal election redistributed results [10]
PartyVote %
  New Democratic 29,55358.78
  Liberal 10,30220.49
  Conservative 5,05110.05
  Bloc Québécois 4,3628.68
  Green 1,0122.01
2011 Canadian federal election
PartyCandidateVotes%±%Expenditures
New Democratic Nycole Turmel 35,19459.20+39.37
Liberal Marcel Proulx 12,05120.27−17.20
Conservative Nancy Brassard-Fortin6,05810.19−4.94
Bloc Québécois Dino Lemay5,0198.44−13.63
Green Roger Fleury1,1251.89−3.37
Total valid votes/Expense limit59,447100.00
Total rejected ballots355 0.59
Turnout59,802 65.50
Eligible voters 91,302
2008 Canadian federal election
PartyCandidateVotes%±%Expenditures
Liberal Marcel Proulx 19,74737.47+4.78$79,069
Bloc Québécois Raphaël Déry11,63522.07−7.30$69,055
New Democratic Pierre Ducasse 10,45419.83+4.33$47,534
Conservative Paul Fréchette7,97615.13−2.07$56,752
Green Frédéric Pouyot2,7745.26+0.26$3,327
Marxist–Leninist Gabriel Girard-Bernier1210.230.00
Total valid votes/Expense limit 52,707100.00 $89,492
Total rejected ballots
Turnout
  Liberal holdSwing+6.04
2006 Canadian federal election
PartyCandidateVotes%Expenditures
Liberal Marcel Proulx 17,57632.67$74,347
Bloc Québécois Alain Charette15,78829.35$36,796
Conservative Gilles Poirier9,28417.26$57,405
New Democratic Pierre Laliberté8,33415.49$28,016
Green Christian Doyle2,6874.99$1,907
Marxist–Leninist Gabriel Girard-Bernier1250.23$19
Total valid votes/expenditure limit53,794100.00$82,541
Total rejected ballots323
Turnout54,11764.25
Electors on the lists84,233
Sources: Official Results, Elections Canada and Financial Returns, Elections Canada.
2004 Canadian federal election
PartyCandidateVotes%±%Expenditures
Liberal Marcel Proulx 20,13541.87−9.53$61,882
Bloc Québécois Alain Charette15,62632.49+9.41$22,285
New Democratic Pierre Laliberté5,70911.87+8.38$23,285
Conservative Pierrette Bellefeuille3,9638.24−9.72$11,618
Green Gail Walker2,5615.33$2,380
Marxist–Leninist Christian Legeais980.20−0.04
Total valid votes/Expense limit48,092100.00 $81,460

Note: Conservative vote is compared to the total of the Canadian Alliance vote and Progressive Conservative vote in the 2000 election.

2000 Canadian federal election
PartyCandidateVotes%±%
Liberal Marcel Proulx 22,38551.40−2.63
Bloc Québécois Caroline Brouard10,05123.08−2.40
Progressive Conservative Guy Dufort4,1819.60+1.39
Alliance Michel Geisterfer3,6398.36+7.36
New Democratic Peter Piening1,5213.49−4.19
Marijuana Aubert Martins8922.05
Natural Law Rita Bouchard4260.98+0.39
Independent Ron Gray1840.42
Canadian Action Robert Brooks1670.38
Marxist–Leninist Alexandre Legeais1060.24
Total valid votes43,552100.00

Note: Canadian Alliance vote is compared to the Reform vote in 1999 by-election.

Canadian federal by-election, 15 November 1999
PartyCandidateVotes%±%
Resignation of Marcel Massé, 10 September 1999
Liberal Marcel Proulx 9,53254.03−0.08
Bloc Québécois Robert Bélanger4,49525.48+4.70
Progressive Conservative Richard St-Cyr1,4488.21−9.51
New Democratic Alain Cossette1,3567.69+4.93
Green Gail Walker3071.74+0.51
Christian Heritage Ron Gray1761.00+0.42
Reform Luiz Da Silva1750.99−0.97
Natural Law Jean-Claude Pommet1030.58+0.03
Independent John C. Turmel510.29
Total valid votes17,643100.00
1997 Canadian federal election
PartyCandidateVotes%±%
Liberal Marcel Massé 25,83554.11+0.85
Bloc Québécois Ginette Tétreault9,92220.78−6.42
Progressive Conservative Stéphane Rondeau8,46117.72+11.55
New Democratic Peter Piening1,3172.76+0.20
Reform Camille Fortin9351.96
Green Gail Walker5861.23+0.34
Christian Heritage Ron Gray2750.58
Natural Law Robert Mayer2660.56−0.21
Marxist–Leninist Pierre Soublière1510.32+0.01
Total valid votes47,748100.00
1993 Canadian federal election
PartyCandidateVotes%±%
Liberal Marcel Massé 27,98853.26+3.43
Bloc Québécois Gilles Rocheleau14,29327.20
Independent Tony Cannavino4,5838.72
Progressive Conservative Pierre Chénier3,2446.17−25.70
New Democratic Francine Bourque1,3462.56−12.83
Green George Halpern4680.89
Natural Law Robert Mayer4010.76
Marxist–Leninist Françoise Roy1620.31
Abolitionist Linda Dubois630.12
Total valid votes52,548100.00
1988 Canadian federal election
PartyCandidateVotes%±%
Liberal Gilles Rocheleau 23,21849.83+9.26
Progressive Conservative Nicole Moreault14,84931.87−5.15
New Democratic Danielle Lapointe-Vienneau7,17015.39−4.23
Rhinoceros Denis Le Citron Patenaude6611.42
Independent Glen Kealey5591.20
Independent Serge Lafortune1340.29
Total valid votes46,591100.00
1984 Canadian federal election
PartyCandidateVotes%±%
Liberal Gaston Isabelle 17,05840.58−27.55
Progressive Conservative Pierre Ménard15,56337.02+31.74
New Democratic Jacques Audette8,24719.62−4.91
Parti nationaliste Carol Anctil1,0152.41
Commonwealth of Canada Émile Chartrand1560.37
Total valid votes42,039100.00

Hull, 1917–1984

Graph of election results in Hull (1921-1980, minor parties that never got 2% of the vote or didn't run consistently are omitted)
1980 Canadian federal election
PartyCandidateVotes%±%
Liberal Gaston Isabelle 27,93868.13-2.04
New Democratic Michel Légère 10,05924.53+7.97
Progressive Conservative Ronald Lefebvre2,1675.28-0.07
Rhinoceros Sylvain Dompierre5981.46-0.47
Independent Marc Bonhomme1740.42
Marxist–Leninist Pierre J.G. Soublière700.17-0.07
Total valid votes41,006100.00
1979 Canadian federal election
PartyCandidateVotes%±%
Liberal Gaston Isabelle 30,41370.18-1.04
New Democratic Michel Légère 7,17516.56+8.36
Social Credit Jean Tessier2,3575.44-3.29
Progressive Conservative Jean-Paul St-Amand2,3205.35-5.26
Rhinoceros Pierre Cantin8351.93
Union populaire René Coté1320.30
Marxist–Leninist Pierre Soublière1060.24
Total valid votes43,338100.00
1974 Canadian federal election
PartyCandidateVotes%±%
Liberal Gaston Isabelle 26,87271.21+6.27
Progressive Conservative Lucille Hodgins4,00610.62-0.39
Social Credit René Ouellette3,2928.72-4.13
New Democratic Carole Campeau Fortin3,0938.20-1.81
Independent Raoul Gendron4721.25+0.06
Total valid votes37,735100.00
1972 Canadian federal election
PartyCandidateVotes%±%
Liberal Gaston Isabelle 24,63064.94-3.78
Social Credit Yvon Boisclair4,87412.85-3.03
Progressive Conservative André Lacroix4,17311.00+0.06
New Democratic Carole Fortin3,79610.016.57
Independent Raoul Gendron4531.190.19
Total valid votes37,926100.00

Note: Social Credit vote is compared to Ralliement créditiste vote in the 1968 election.

1968 Canadian federal election
PartyCandidateVotes%±%
Liberal Gaston Isabelle 22,98268.72+16.48
Ralliement créditiste Joseph-René Villeneuve5,31115.88-22.53
Progressive Conservative Jean-Marie Séguin3,66110.95+6.81
New Democratic Richard Thibault1,1513.44-0.56
Independent LiberalRaoul Gendron3371.01-0.20
Total valid votes33,442100.00
Canadian federal by-election, 29 May 1967
PartyCandidateVotes%±%
On Mr. Caron's death, 31 August 1966
Liberal Pierre Caron 11,85452.25-2.44
Ralliement créditiste René Villeneuve8,71538.41+8.36
Progressive Conservative Jean-Claude Émond9394.14-1.61
New Democratic Richard Thibault9074.00-2.94
Independent LiberalRaoul Gendron2741.21
Total valid votes22,689100.00
1965 Canadian federal election
PartyCandidateVotes%±%
Liberal Alexis Caron 17,83254.68+1.71
Ralliement créditiste Marcel Clément9,79830.05-6.59
New Democratic René Desjardins2,2616.93+4.53
Progressive Conservative Gérard Girouard1,8735.74-2.24
Independent LiberalGertrude Laflèche6922.12
Independent LiberalRobert Lawlis1540.47
Total valid votes32,610100.00

Note: Ralliement créditiste vote is compared to Social Credit vote in the 1963 election.

1963 Canadian federal election
PartyCandidateVotes%±%
Liberal Alexis Caron 19,66752.97+4.81
Social Credit Marcel Clément13,60336.64+5.37
Progressive Conservative Jules Barrière2,9657.99-9.77
New Democratic Claude Morissette8912.40-0.40
Total valid votes37,126100.00
1962 Canadian federal election
PartyCandidateVotes%±%
Liberal Alexis Caron 17,93248.17-8.02
Social Credit Marcel Clément11,64231.27+24.34
Progressive Conservative Armand Turpin6,61217.76-18.15
New Democratic Hubert Boyer1,0432.80
Total valid votes37,229100.00
1958 Canadian federal election
PartyCandidateVotes%±%
Liberal Alexis Caron 20,13256.18+11.52
Progressive Conservative Lionel Mougeot12,86935.91+21.78
Social Credit Marcellin Clément2,4846.93+0.15
Independent LiberalRaoul Gendron3480.97
Total valid votes35,833100.00
1957 Canadian federal election
PartyCandidateVotes%±%
Liberal Alexis Caron 15,55144.66-30.46
Independent LiberalRaymond Brunet11,98134.41
Progressive Conservative Avila Labelle4,92214.14-7.38
Social Credit Marcellin Clément2,3636.79
Total valid votes34,817100.00
1953 Canadian federal election
PartyCandidateVotes%±%
Liberal Alexis Caron 21,78575.13+9.60
Progressive Conservative Daniel Lafortune6,23921.52-3.57
Co-operative Commonwealth Laurent Larose7072.44-0.30
Labor–Progressive Ernest Gervais2660.92
Total valid votes28,997100.00
1949 Canadian federal election
PartyCandidateVotes%±%
Liberal Alphonse Fournier 18,44665.53+6.30
Progressive Conservative Jacques Boucher7,06025.08-11.45
Union des électeurs Cécile Brunet1,8716.65+4.30
Co-operative Commonwealth Laurent-Joseph Larose7712.74+0.85
Total valid votes28,148100.00
1945 Canadian federal election
PartyCandidateVotes%±%
Liberal Alphonse Fournier 15,01259.23+8.66
Progressive Conservative Armand Turpin9,25836.53
Union des électeurs Alcide Whitmore5962.35-29.48
Co-operative Commonwealth François-Joseph Gavard4781.89
Total valid votes25,344100.00

Note: Union des électeurs vote is compared to New Democracy vote in 1940 election. Social Credit vote is compared to New Democracy vote in 1940 election. Labour-Progressive vote is compared to Communist vote in 1940 election.

1940 Canadian federal election
PartyCandidateVotes%±%
Liberal Alphonse Fournier 11,25350.57+5.73
New Democracy Armand Turpin7,08331.83
Labour Théodore Lambert3,91617.60
Total valid votes22,252100.00
1935 Canadian federal election
PartyCandidateVotes%±%
Liberal Alphonse Fournier 9,37044.84-23.13
Reconstruction Aimé Guertin 5,24425.09
Independent LiberalJoseph Édouard Laflamme3,39016.22
Conservative Rodolphe Moreau2,89413.85-18.18
Total valid votes20,898100.00
1930 Canadian federal election
PartyCandidateVotes%±%
Liberal Alphonse Fournier 12,54367.97-15.33
Conservative Jean-Noël Beauchamp5,91132.03+15.33
Total valid votes18,454100.00
1926 Canadian federal election
PartyCandidateVotes%±%
Liberal Joseph-Éloi Fontaine 10,89983.30+14.10
Conservative François-Albert Dumas2,18516.70-14.10
Total valid votes13,084100.00
1925 Canadian federal election
PartyCandidateVotes%±%
Liberal Joseph-Éloi Fontaine 10,24869.20-13.50
Conservative Louis Cousineau4,56130.80
Total valid votes14,809100.00
1921 Canadian federal election
PartyCandidateVotes%
Liberal Joseph-Éloi Fontaine 11,99882.70
Progressive Sylvio Lafortune2,51017.30
Total valid votes14,508100.00
1917 Canadian federal election
PartyCandidateVotes
Opposition (Laurier Liberals) Joseph-Éloi Fontaine acclaimed

See also

Related Research Articles

<span class="mw-page-title-main">Pierre Ducasse (politician)</span>

Pierre Ducasse is a Canadian politician and New Democratic Party (NDP) activist.

<span class="mw-page-title-main">Mount Royal (electoral district)</span> Federal electoral district in Quebec, Canada

Mount Royal is a federal electoral district in Quebec, Canada, that has been represented in the House of Commons of Canada since 1925. Its population in 2006 was 98,888.

<span class="mw-page-title-main">Saint-Hyacinthe—Bagot</span> Federal electoral district in Quebec, Canada

Saint-Hyacinthe—Bagot is a federal electoral district that has been represented in the House of Commons of Canada since 1935. It is located in Quebec, Canada. Its population in 2006 was 95,983. In the 2015 election, the winner received the lowest vote percentage of any winning candidate in the country.

Marcel Proulx is a retired Canadian politician.

<span class="mw-page-title-main">Hochelaga (electoral district)</span> Federal electoral district in Quebec, Canada

Hochelaga is a federal electoral district in Quebec, Canada, that has been represented in the House of Commons of Canada from 1867 to 1988 and since 2004.

<span class="mw-page-title-main">Outremont (electoral district)</span> Federal electoral district in Quebec, Canada

Outremont is a federal electoral district in Montreal, Quebec, Canada, that has been represented in the House of Commons of Canada since 1935. It was known as Outremont—Saint-Jean from 1947 to 1966. Its population in 2006 was 95,711. Its current Member of Parliament is Rachel Bendayan of the Liberal Party of Canada.

<span class="mw-page-title-main">Papineau (electoral district)</span> Federal electoral district in Quebec, Canada

Papineau is a federal electoral district in Montreal, Quebec, Canada, that has been represented in the House of Commons of Canada since 1948. Its population in 2016 was 110,750. Justin Trudeau, the Prime Minister of Canada and Leader of the Liberal Party, has represented the riding since the 2008 federal election. Trudeau became Liberal leader in a 2013 leadership election, succeeding Bob Rae, and prime minister when the Liberals returned to government in the 2015 Canadian federal election, succeeding Conservative leader Stephen Harper.

<span class="mw-page-title-main">Ahuntsic (federal electoral district)</span> Federal electoral district in Quebec, Canada

Ahuntsic was a federal electoral district in Quebec, Canada, that was represented in the House of Commons of Canada from 1968 to 1979 and from 1988 to 2015.

<span class="mw-page-title-main">Longueuil—Saint-Hubert</span> Federal electoral district in Quebec, Canada

Longueuil—Saint-Hubert is a federal electoral district in Quebec, Canada, represented in the House of Commons of Canada from since 2015

<span class="mw-page-title-main">Aylmer, Quebec</span> Sector within City of Gatineau in Quebec, Canada

Aylmer is a former city in Quebec, Canada. It is located on the north shore of the Ottawa River and along Route 148. In January 2002, it amalgamated into the city of Gatineau, which is part of Canada's National Capital Region. Aylmer's population in 2011 was 55,113. It is named after Lord Aylmer, who was a governor general of British North America and a lieutenant governor of Lower Canada from 1830 to 1835.

<span class="mw-page-title-main">Beauce (electoral district)</span> Federal electoral district in Quebec, Canada

Beauce is a federal electoral district in Quebec, Canada, that has been represented in the House of Commons of Canada since 1867. In 2006, it had a population of 103,617 people, of whom 82,123 were eligible voters.

<span class="mw-page-title-main">Françoise Boivin</span> Canadian politician

Françoise Boivin is a Canadian politician, who represented the electoral district of Gatineau in the House of Commons of Canada until 2015.

<span class="mw-page-title-main">Pontiac (federal electoral district)</span> Federal electoral district in Quebec, Canada

Pontiac is a federal electoral district in western Quebec, Canada, that has been represented in the House of Commons of Canada from 1867 to 1949 and since 1968.

Chicoutimi—Le Fjord is a federal electoral district in Quebec, Canada, that has been represented in the House of Commons of Canada since 1925. The riding consists of the northern part of the Chicoutimi borough of Saguenay, as well as the La Baie borough and the municipalities of Ferland-et-Boilleau, L'Anse-Saint-Jean, Petit-Saguenay, Rivière-Éternité and Saint-Félix-d'Otis and the unorganized territory of Lalemant.

<span class="mw-page-title-main">Gatineau (federal electoral district)</span> Federal electoral district in Quebec, Canada

Gatineau is a federal electoral district in Quebec, Canada, represented in the House of Commons of Canada from since 1949. Between 1987 and 1996, it was known as "Gatineau—La Lièvre".

<span class="mw-page-title-main">Brome—Missisquoi (federal electoral district)</span> Federal electoral district in Quebec, Canada

Brome—Missisquoi is a federal electoral district in Quebec, Canada, that has been represented in the House of Commons of Canada since 1925. The original electoral district of Missiquoi existed from 1867 to 1925.

<span class="mw-page-title-main">Saint-Jean (federal electoral district)</span> Federal electoral district in Quebec, Canada

Saint-Jean is a federal electoral district in Quebec, Canada, that has been represented in the House of Commons of Canada since 1968.

Vaudreuil—Soulanges is a federal electoral district in Quebec, Canada, that has been represented in the House of Commons of Canada since 1867.

Canadian federal elections have provided the following results in the Laurentides, Outaouais and Northern Quebec.

<span class="mw-page-title-main">Nycole Turmel</span> Canadian politician and labour leader (born 1942)

Nycole Turmel is a Canadian politician who served as the member of Parliament (MP) for Hull—Aylmer from 2011 to 2015. A member of the New Democratic Party (NDP), Turmel served as the party's interim leader from 2011 to 2012.

References

Notes