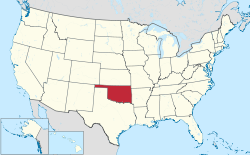
The location of the State of Oklahoma in the United States of America . Oklahoma counties. This list of Oklahoma counties by socioeconomic factors is taken from the "Quick Facts" web pages of the United States Census Bureau and the Population Health Institute of the University of Wisconsin . All data listed is for 2020 unless otherwise stated.
By comparison with the United States as a whole, the statistics in the following table shows that Oklahoma has a lower per capita and household income than the national average plus a lower rate of population growth and a less educated population as measured by the percentage of people with bachelor's or higher degrees compared to the national average. Oklahoma has a higher rate of people in poverty and people without health insurance than the U.S. as a whole. Oklahoma's population has a higher percentage of non-Hispanic whites than the national average, although one Oklahoma country has a plurality of Native Americans (American Indians) and another has a plurality of Hispanics .
Oklahomans on average have a life expectancy of three years less than the national average although three Oklahoma counties (out of 77) have life expectancies exceeding the national average. A few Oklahoma counties also exceed the U.S. national average for income, population growth rate, education, and have a lower rate of poverty. Republican candidate Donald Trump received a plurality of votes in every Oklahoma county, and a majority in every county but one in the 2020 Presidential election.
The 2020 census is a snapshot of Oklahoma's population. Depending upon the methodology used and the time of measurement, socioeconomic statistics cited may vary from year to year, especially in counties with very small populations.
Per capita income Median household income Population 2020 Population growth rate 2010-2020 Racial characteristics of population % foreign born Life expectancy in years % of people in poverty % of 25+ year old people with bachelor or higher degrees % of people less than 65 years old without health insurance % vote for Trump 2020 [ 1] United States $37,638 $69,201 331,449,520 7.4% 59.3% non-Hispanic white 13.6% 78.5 11.6% 33.7% 9.8% 46.8% Oklahoma (State) $30,976 $56,956 3,959,346 5.5% 63.8% non-Hispanic white 6.1% 75.5 15.6% 26.8% 16.3% 65.4% COUNTY Adair $18,486 $37,490 19,495 −14.1% 46.6% Native American 1.9% 73.4 20.8% 10.6% 22.7% 78.6% Alfalfa $26,130 $66,552 5,699 0.1% 81.8% non-Hispanic white 3.1% 77.0 16.4% 21.0% 16.9% 87.4% Atoka $22,781 $45,148 14,143 −0.2% 69.0% non-Hispanic white 1.6% 75.3 17.1% 14.7% 23.2% 84.6% Beaver $26,434 $60,152 5,049 −10.4% 68.0% non-Hispanic white 11.2% 77.4 11.6% 21.5% 23.6% 90.4% Beckham $24,209 $50,365 22,410 1.3% 73.8% non-Hispanic white 4.2% 73.6 18.4% 14.7% 18.0% 85.1% Blaine $30,754 $52,538 8,735 −26.9% 69.8% non-Hispanic white 7.5% 71.7 18.0% 16.9% 16.9% 80.4% Bryan $26,639 $49,225 46,067 8.6% 68.8% non-Hispanic white 2.6% 74.9 16.5% 23.7% 21.6% 77.3% Caddo $22,844 $47,566 26,945 −9.0% 55.9% non-Hispanic white 5.3% 71.5 26.1% 14.8% 20.3% 71.1% Canadian $34,442 $76,973 154,405 33.6% 72.8% non-Hispanic white 5.2% 78.0 8.2% 31.4% 13.7% 70.3% Carter $27,964 $52,906 48,003 0.9% 67.7% non-Hispanic white 3.8% 74.3 14.2% 20.1% 20.7% 75.5% Cherokee $25,069 $47,421 47,078 0.2% 45.4% non-Hispanic white 2.9% 75.1 21.8% 27.0% 21.8% 63.4% Choctaw $23,705 $38,854 14,204 −6.6% 72.8% non-Hispanic white 1.7% 72.2 18.6% 14.2% 22.1% 80.6% Cimarron $32,029 $50,350 2,296 −7.2% 70.7% non-Hispanic white 4.7% 80.5 15.9% 29.0% 22.3% 92.0% Cleveland $34,223 $67,068 295,528 15.6% 69.5% non-Hispanic white 6.5% 78.4 12.3% 34.7% 14.9% 55.7% Coal $24,524 $43,697 5,266 −7.2% 64.4% non-Hispanic white 1.2% 71.4 18.7% 17.5% 23.0% 82.8% Comanche $28,512 $54,483 21,125 −2.4% 55.1% non-Hispanic white 5.7% 75.5 19.2% 23.9% 16.7% 58.7% Cotton $28,584 $54,787 5,527 −10.8% 73.9% non-Hispanic white 0.7% 73.4 17.6% 16.7% 18.6% 82.3% Craig $22,833 $45,094 14,107 −6.1% 60.9% non-Hispanic white 1.4% 74.4 17.5% 14.6% 17.5% 77.7% Creek $28,429 $56,384 71,754 2.6% 74.3% non-Hispanic white 2.0% 74.5 14.3% 17.1% 17.9% 76.4% Custer $29,440 $55,074 28,513 3.8% 66.2% non-Hispanic white 5.9% 74.1 17.0% 29.6% 22.0% 75.4% Delaware $30,620 $46,588 40,397 −2.6% 62.4% non-Hispanic white 1.9% 75.4 18.1% 18.2% 23.6% 78.6% Dewey $29,257 $53,672 4,484 −6.8% 79.1% non-Hispanic white 2.2% 73.4 16.4% 20.0% 19.1% 90.0% Ellis $28,534 $52,250 3,749 −9.7% 85.2% non-Hispanic white 2.9% 76.2 12.9% 18.4% 20.1% 90.1% Garfield $30,059 $60,732 62,846 3.7% 71.4% non-Hispanic white 7.4% 75.0 12.9% 23.4% 17.4% 75.7% Garvin $26,756 $50,441 26,656 −7.0% 70.7% non-Hispanic white 3.7% 72.3 15.6% 16.7% 21.2% 81.3% Grady $25,533 $47,721 26,236 5.3% 57.4% non-Hispanic white 1.8% 75.4 22.4% 15.3% 20.4% 80.2% Grant $31,725 $54,150 4,169 −7.9% 86.0% non-Hispanic white 0.2% 74.6 14.1% 23.7% 17.2% 86.1% Greer $22,289 $49,203 5,491 −12.0% 72.2% non-Hispanic white 0.4% 76.9 23.0% 10.6% 15.2% 81.3% Harmon $27,839 $55,369 2,488 −14.9% 53.1% non-Hispanic white 5.5% 71.5 27.8% 15.9% 22.5% 80.1% Harper $24,138 $51,481 3,272 −11.2% 70.9% non-Hispanic white 11.6% 78.0 11.4% 22.4% 25.0% 89.2% Haskell $23,870 $43,622 11,561 −9.5% 68.7% non-Hispanic white 2.0% 74.2 21.5% 15.8% 20.1% 83.1% Hughes $22,026 $42,425 13,367 −4.5% 61.1% non-Hispanic white 1.9% 71.9 21.4% 15.3% 18.9% 79.8% Jackson $28,091 $55,551 24,785 −6.3% 61.2% non-Hispanic white 5.4% 74.4 14.9% 24.5% 19.4% 77.8% Jefferson $25,687 $43,438 5,337 −17.5% 74.8% non-Hispanic white 3.3% 75.3 24.2% 15.2% 20.1% 84.9% Johnston $23,605 $46,754 10,272 −6.3% 66.9% non-Hispanic white 1.7% 73.0 20.9% 23.0% 18.0% 80.9% Kay $27,323 $50,391 43,700 −6.1% 71.9% non-Hispanic white 2.5% 73.1 15.8% 17.6% 18.1% 74.4% Kingfisher $32,779 $61,657 15,184 1.0% 74.2% non-Hispanic white 9.5% 77.0 10.7% 22.5% 21.5% 85.4% Kiowa $22,093 $36,985 8,509 −9.9% 72.3% non-Hispanic white 1.2% 71.8 20.6% 18.6% 16.2% 78.0% Latimer $26,072 $39,999 9,444 −15.3% 61.1% non-Hispanic white 1.3% 77.5 20.0% 12.9% 18.6% 80.9% LeFlore $22,167 $43,049 48,129 −5.3% 69.6% non-Hispanic white 3.4% 73.2 23.5% 15.3% 24.5% 80.9% Lincoln $27,915 $54,578 33,458 −2.4% 81.0% non-Hispanic white 1.1% 77.5 15.8% 15.0% 17.9% 80.7% Logan $37,404 $74,744 49,555 18.4% 76.3% non-Hispanic white 3.4% 79.1 13.1% 30.3% 17.2% 72.3% Love $24,995 $55,568 10,146 7.7% 68.5% non-Hispanic white 6.5% 74.3 15.3% 15.0% 20.6% 81.1% Major $28,666 $60,025 7,782 3.4% 83.1% non-Hispanic white 4.6% 74.9 10.7% 18.6% 21.3% 89.0% Marshall $25,915 $51,345 15,312 −3.3% 63.4% non-Hispanic white 7.6% 76.2 14.9% 15.8% 25.4% 80.7% Mayes $27,334 $52,956 39,046 −5.4% 62.9% non-Hispanic white 1.2% 74.1 14.6% 14.8% 21.2% 76.7% McClain $35,931 $73,914 41,662 20.7% 77.2% non-Hispanic white 3.3% 76.4 9.2% 26.1% 16.4% 79.5% McCurtain $21,908 $43,435 30,814 −7.0% 59.6% non-Hispanic white 3.6% 72.4 21.5% 14.6% 23.4% 82.7% McIntosh $23,606 $40,792 18,941 −6.5% 66.4% non-Hispanic white 1.2% 74.5 18.1% 12.7% 21.5% 74.0% Murray $28,434 $54,160 13,904 3.1% 69.2% non-Hispanic white 2.3% 74.8 13.5% 17.8% 20.9% 78.2% Muskogee $24,557 $44,166 66,339 −6.6% 54.1% non-Hispanic white 2.9% 72.1 19.2% 20.0% 19.3% 65.9% Noble $29,212 $62,910 10,924 −6.5% 79.6% non-Hispanic white 0.7% 74.8 11.8% 21.4% 15.7% 77.4% Nowata $26,531 $46,686 9,320 −11.5% 64.9% non-Hispanic white 1.5% 76.3 15.5% 16.0% 18.8% 82.2% Okfuskee $20,258 $43,000 11,310 −7.2% 59.4% non-Hispanic white 1.9% 69.2 26.8% 10.7% 20.1% 75.7% Oklahoma $34,129 $58,239 796,292 10.8% 54.5% non-Hispanic white 10.2% 75.5 16.3% 33.7% 17.5% 49.2% Okmulgee $25,501 $48,689 36,706 −8.4% 61.3% non-Hispanic white 1.0% 72.4 18.0% 15.1% 18.4% 67.5% Osage $27,562 $54,036 45,818 −3.5% 62.7% non-Hispanic white 0.9% 78.1 12.3% 19.0% 17.5% 68.8% Ottawa $22,544 $42,311 30,285 −4.9% 63.0% non-Hispanic white 2.7% 72.6 20.5% 15.4% 22.1% 74.7% Pawnee $26,189 $53,084 15,553 −6.2% 74.6% non-Hispanic white 1.2% 73.9 14.8% 17.4% 18.5% 77.6% Payne $24,985 $43,686 81,646 5.5% 76.1% non-Hispanic white 6.9% 77.5 20.7% 38.3% 19.2% 60.1% Pittsburg $26,504 $49,669 43,733 −4.5% 67.5% non-Hispanic white 2.0% 73.2 18.2% 18.7% 19.9% 77.3% Pontotoc $28,247 $55,862 38,065 1.5% 62.9% non-Hispanic white 2.0% 74.0 17.4% 29.3% 21.0% 70.5% Pottawatomie $26,460 $54,896 72,454 4.8% 70.7% non-Hispanic white 1.9% 74.0 14.4% 20.4% 17.9% 71.8% Pushmataha $22,839 $40,721 10,812 −6.6% 68.9% non-Hispanic white 0.7% 74.3 18.2% 15.1% 22.1% 84.7% Roger Mills $38,562 $55,385 3,442 −5.6% 82.4% non-Hispanic white 2.5% 76.6 15.0% 20.0% 17.7% 88.8% Rogers $33,830 $69,322 95,240 9.6% 70.1% non-Hispanic white 2.6% 77.5 9.7% 25.0% 14.0% 76.4% Seminole $21,153 $40,190 23,556 −7.6% 62.5% non-Hispanic white 2.2% 71.0 20.1% 14.2% 22.1% 72.1% Sequoyah $22,158 $43,496 39,281 −7.3% 60.5% non-Hispanic white 1.8% 73.8 19.6% 14.3% 22.4% 78.7% Stevens $28,327 $53,470 42,848 −4.9% 78.5% non-Hispanic white 2.6% 74.4 18.9% 18.1% 19.0% 81.6% Texas $22,112 $50,781 21,384 3.6% 48.1% Hispanic 25.6% 75.0 12.9% 26.0% 26.5% 81.6% Tillman $21,952 $41,138 6,968 −12.8% 56.8% non-Hispanic white 7.6% 74.8 20.9% 17.6% 20.8% 76.3% Tulsa $35,360 $60,382 669,279 10.9% 59.9% non-Hispanic white 8.9% 76.3 14.7% 32.7% 17.5% 56.5% Wagoner $32,647 $68,906 80,981 10.8% 69.4% non-Hispanic white 4.4% 78.8 9.7% 25.3% 17.3% 74.0% Washington $31,192 $55,216 52,455 2.9% 70.9% non-Hispanic white 4.1% 76.0 16.7% 29.3% 17.8% 72.7% Washita $29,259 $55,750 10,924 −6.1% 81.9% non-Hispanic white 1.9% 73.9 15.9% 19.2% 18.0% 85.5% Woods $28,575 $55,933 8,624 −2.9% 82.7% non-Hispanic white 1.4% 75.4 14.7% 32.3% 16.2% 81.4% Woodward $29,634 $55,700 20,470 1.9% 78.2% non-Hispanic white 5.2% 76.1 14.0% 19.6% 20.0% 84.9%
Sources:
This page is based on this
Wikipedia article Text is available under the
CC BY-SA 4.0 license; additional terms may apply.
Images, videos and audio are available under their respective licenses.