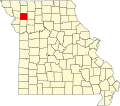
Maysville, Missouri

Last updated

Maysville, Missouri
Aerial view of Maysville, Missouri 9-2-2013.JPG
Aerial view of Maysville, Missouri
DeKalb County Missouri Incorporated and Unincorporated areas Maysville Highlighted.svg
Location of Maysville, Missouri
Coordinates: 39°53′09″N94°21′48″W / 39.88583°N 94.36333°W / 39.88583; -94.36333
Country United States
State Missouri
County DeKalb
Area
[1]
  Total
1.15 sq mi (2.98 km2)
  Land1.15 sq mi (2.97 km2)
  Water0.01 sq mi (0.01 km2)
Elevation
[2]
935 ft (285 m)
Population
 (2020)
  Total
1,095
  Density955.50/sq mi (369.04/km2)
Time zone UTC-6 (Central (CST))
  Summer (DST) UTC-5 (CDT)
ZIP code
64469
Area codes 816, 975
FIPS code 29-46946 [3]
GNIS feature ID2395055 [2]

Maysville is a city in DeKalb County, Missouri, United States. The population was 1,095 at the 2020 census. [4] Maysville is the county seat of DeKalb County. [5]

Contents

Maysville is part of the St. Joseph, Missouri metropolitan area.

History

DeKalb County courthouse as viewed from the southwest in October 2014 DeKalb County Missouri Courthouse (Southwest View).JPG
DeKalb County courthouse as viewed from the southwest in October 2014

Maysville was founded in 1845. [6] The name may be a transfer from Maysville, Kentucky. [7] A post office called Maysville has been in operation since 1846. [8]

The DeKalb County Courthouse was listed on the National Register of Historic Places in 1998. [9]

Geography

Maysville is located in central Dekalb County at the intersection of Missouri routes 6 and 33. [10] According to the United States Census Bureau, the city has a total area of 1.16 square miles (3.00 km2), of which 1.15 square miles (2.98 km2) is land and 0.01 square miles (0.03 km2) is water. [11]

Climate

Climate data for Maysville, Missouri (1991–2020 normals, extremes 1946–2022)
MonthJanFebMarAprMayJunJulAugSepOctNovDecYear
Record high °F (°C)69
(21)
77
(25)
85
(29)
92
(33)
98
(37)
101
(38)
111
(44)
105
(41)
105
(41)
94
(34)
82
(28)
73
(23)
111
(44)
Mean maximum °F (°C)58.7
(14.8)
64.0
(17.8)
76.1
(24.5)
83.5
(28.6)
88.5
(31.4)
93.1
(33.9)
97.2
(36.2)
96.9
(36.1)
91.9
(33.3)
85.0
(29.4)
71.8
(22.1)
62.3
(16.8)
98.7
(37.1)
Mean daily maximum °F (°C)34.4
(1.3)
39.6
(4.2)
51.8
(11.0)
62.9
(17.2)
72.8
(22.7)
82.3
(27.9)
86.5
(30.3)
85.1
(29.5)
77.7
(25.4)
65.3
(18.5)
51.0
(10.6)
39.0
(3.9)
62.4
(16.9)
Daily mean °F (°C)24.7
(−4.1)
29.2
(−1.6)
40.5
(4.7)
51.4
(10.8)
61.9
(16.6)
71.8
(22.1)
75.9
(24.4)
74.1
(23.4)
65.9
(18.8)
53.7
(12.1)
40.7
(4.8)
29.7
(−1.3)
51.6
(10.9)
Mean daily minimum °F (°C)15.1
(−9.4)
18.8
(−7.3)
29.2
(−1.6)
39.8
(4.3)
51.1
(10.6)
61.3
(16.3)
65.3
(18.5)
63.0
(17.2)
54.1
(12.3)
42.1
(5.6)
30.3
(−0.9)
20.5
(−6.4)
40.9
(4.9)
Mean minimum °F (°C)−4.6
(−20.3)
1.1
(−17.2)
10.7
(−11.8)
25.9
(−3.4)
37.7
(3.2)
50.4
(10.2)
56.6
(13.7)
53.9
(12.2)
40.0
(4.4)
27.7
(−2.4)
14.6
(−9.7)
2.3
(−16.5)
−8.6
(−22.6)
Record low °F (°C)−24
(−31)
−19
(−28)
−17
(−27)
9
(−13)
27
(−3)
39
(4)
43
(6)
40
(4)
27
(−3)
17
(−8)
−7
(−22)
−32
(−36)
−32
(−36)
Average precipitation inches (mm)1.05
(27)
1.48
(38)
2.47
(63)
3.89
(99)
5.65
(144)
5.35
(136)
4.64
(118)
4.41
(112)
4.03
(102)
3.28
(83)
2.02
(51)
1.61
(41)
39.88
(1,013)
Average snowfall inches (cm)5.3
(13)
5.6
(14)
2.0
(5.1)
0.5
(1.3)
0.0
(0.0)
0.0
(0.0)
0.0
(0.0)
0.0
(0.0)
0.0
(0.0)
0.3
(0.76)
1.5
(3.8)
5.5
(14)
20.7
(53)
Average precipitation days (≥ 0.01 in)4.95.37.510.010.910.18.97.87.47.76.25.492.1
Average snowy days (≥ 0.1 in)2.92.51.20.40.00.00.00.00.00.20.72.510.4
Source: NOAA [12] [13]

Demographics

Historical population
CensusPop.Note
1880 418
1890 71771.5%
1900 92529.0%
1910 1,05113.6%
1920 1,0570.6%
1930 946−10.5%
1940 1,0268.5%
1950 973−5.2%
1960 942−3.2%
1970 1,04510.9%
1980 1,18713.6%
1990 1,176−0.9%
2000 1,2123.1%
2010 1,114−8.1%
2020 1,095−1.7%
U.S. Decennial Census [14]

2010 census

As of the census [15] of 2010, there were 1,114 people, 433 households, and 272 families living in the city. The population density was 968.7 inhabitants per square mile (374.0/km2). There were 496 housing units at an average density of 431.3 per square mile (166.5/km2). The racial makeup of the city was 97.6% White, 0.4% African American, 0.5% Native American, 0.1% Asian, 0.1% Pacific Islander, and 1.3% from two or more races. Hispanic or Latino of any race were 0.4% of the population.

There were 433 households, of which 33.0% had children under the age of 18 living with them, 46.7% were married couples living together, 11.5% had a female householder with no husband present, 4.6% had a male householder with no wife present, and 37.2% were non-families. 32.6% of all households were made up of individuals, and 18.9% had someone living alone who was 65 years of age or older. The average household size was 2.47 and the average family size was 3.15.

The median age in the city was 39.3 years. 26.5% of residents were under the age of 18; 7.7% were between the ages of 18 and 24; 22.9% were from 25 to 44; 24.1% were from 45 to 64; and 18.9% were 65 years of age or older. The gender makeup of the city was 45.7% male and 54.3% female.

2000 census

As of the census [3] of 2000, there were 1,212 people, 457 households, and 302 families living in the city. The population density was 1,065.9 inhabitants per square mile (411.5/km2). There were 491 housing units at an average density of 431.8 per square mile (166.7/km2). The racial makeup of the city was 98.76% White, 0.08% African American, 0.33% Native American, 0.17% Asian, 0.33% from other races, and 0.33% from two or more races. Hispanic or Latino of any race were 0.50% of the population.

There were 457 households, out of which 34.4% had children under the age of 18 living with them, 52.7% were married couples living together, 10.1% had a female householder with no husband present, and 33.7% were non-families. 30.9% of all households were made up of individuals, and 18.8% had someone living alone who was 65 years of age or older. The average household size was 2.49 and the average family size was 3.14.

In the city, the population was spread out, with 28.5% under the age of 18, 6.5% from 18 to 24, 25.7% from 25 to 44, 17.1% from 45 to 64, and 22.1% who were 65 years of age or older. The median age was 38 years. For every 100 females, there were 85.3 males. For every 100 females age 18 and over, there were 81.9 males.

The median income for a household in the city was $27,727, and the median income for a family was $36,979. Males had a median income of $28,382 versus $18,646 for females. The per capita income for the city was $11,871. About 12.4% of families and 16.6% of the population were below the poverty line, including 20.4% of those under age 18 and 17.6% of those age 65 or over.

Education

It is in the Maysville R-I School District. [16] Students in Maysville attend R-1 Elementary and Maysville R-1 Jr./Sr. High School.

References

  1. "ArcGIS REST Services Directory". United States Census Bureau. Retrieved August 28, 2022.
  2. 1 2 U.S. Geological Survey Geographic Names Information System: Maysville, Missouri
  3. 1 2 "U.S. Census website". United States Census Bureau . Retrieved January 31, 2008.
  4. "Explore Census Data". data.census.gov. Retrieved January 10, 2022.
  5. "Find a County". National Association of Counties. Archived from the original on May 31, 2011. Retrieved June 7, 2011.
  6. Eaton, David Wolfe (1916). How Missouri Counties, Towns and Streams Were Named. The State Historical Society of Missouri. p. 284.
  7. "DeKalb County Place Names, 1928–1945 (archived)". The State Historical Society of Missouri. Archived from the original on June 24, 2016. Retrieved September 27, 2016.{{cite web}}: CS1 maint: bot: original URL status unknown (link)
  8. "Post Offices". Jim Forte Postal History. Retrieved September 27, 2016.
  9. "National Register Information System". National Register of Historic Places . National Park Service. July 9, 2010.
  10. Missouri Atlas & Gazetteer DeLorme, 1st ed., 1998, p. 20, ISBN   0899332242
  11. "US Gazetteer files 2010". United States Census Bureau. Archived from the original on July 2, 2012. Retrieved July 8, 2012.
  12. "NOWData – NOAA Online Weather Data". National Oceanic and Atmospheric Administration. Retrieved November 20, 2023.
  13. "Summary of Monthly Normals 1991–2020". National Oceanic and Atmospheric Administration. Retrieved November 20, 2023.
  14. "Census of Population and Housing". Census.gov. Retrieved June 4, 2015.
  15. "U.S. Census website". United States Census Bureau . Retrieved July 8, 2012.
  16. Geography Division (December 18, 2020). 2020 CENSUS - SCHOOL DISTRICT REFERENCE MAP: DeKalb County, MO (PDF) (Map). U.S. Census Bureau . Retrieved February 7, 2025. - Text list