This article has multiple issues. Please help improve it or discuss these issues on the talk page . (Learn how and when to remove these template messages)
(Learn how and when to remove this template message) Contents |
The 2015 Watford Borough Council election took place on 7 May 2015 to elect members of Watford Borough Council in England. [1] This was on the same day as other local elections.
Watford Borough Council is the local authority for the Watford non-metropolitan district of England, the United Kingdom. Watford is located in the south-west of Hertfordshire, in the East of England region. The council is based in the town hall on Hempstead Road.
Party | Candidate | Votes | % | ± | |
---|---|---|---|---|---|
Labour | Favour Ewudo | 1,061 | |||
Labour | Seamus Williams | 1,014 | |||
Conservative | Joanne Norwood | 749 | |||
Liberal Democrat | Robbie Laird | 580 | |||
Conservative | Neil Punter | 571 | |||
Liberal Democrat | Paddy Kent | 540 | |||
Green | Su Murray | 477 | |||
UKIP | Jon Goddard | 410 | |||
Green | Dorothy Nixon | 384 | |||
UKIP | David Penn | 274 | |||
Independent | Richard Short | 95 | |||
Majority | |||||
Turnout | 6155 | ||||
Labour hold | Swing | ||||
Labour gain from Green | Swing | ||||
Party | Candidate | Votes | % | ± | |
---|---|---|---|---|---|
Labour | Michael Haley | 1,248 | 33.46 | ||
Liberal Democrat | Collette Blake | 1,036 | 27.77 | ||
Conservative | Amrish Patel | 806 | 21.60 | ||
UKIP | Renie Price | 355 | 9.52 | ||
Green | Jeni Grewcock | 253 | 6.78 | ||
TUSC | Mark O'Connor | 32 | 0.86 | ||
Majority | 212 | 5.69 | |||
Turnout | 3730 | ||||
Labour gain from Liberal Democrat | Swing | ||||
Party | Candidate | Votes | % | ± | |
---|---|---|---|---|---|
Labour | Nigel Bell | 1,974 | 55.95 | ||
Conservative | Penelope Mortimer | 641 | 18.17 | ||
Liberal Democrat | Simonie Jeffree | 407 | 11.54 | ||
UKIP | Gavin Smith | 336 | 9.52 | ||
Green | Rhiannon Grant | 144 | 4.08 | ||
TUSC | Sajith Attepuram | 26 | 0.74 | ||
Majority | 1333 | 37.78 | |||
Turnout | 3528 | ||||
Labour hold | Swing | ||||
Party | Candidate | Votes | % | ± | |
---|---|---|---|---|---|
Labour | Asif Khan | 1,297 | |||
Conservative | Steve O'Brian | 1,026 | |||
Liberal Democrat | Bobby Amin | 648 | |||
UKIP | Phil Cox | 470 | |||
Green | Neal Emery | 184 | |||
TUSC | Thinshkumar Balasingham | 33 | |||
Majority | 271 | ||||
Turnout | 3648 | ||||
Labour hold | Swing | ||||
Party | Candidate | Votes | % | ± | |
---|---|---|---|---|---|
Conservative | Mark Whitman | 1,029 | |||
Labour | Min Rodriguez | 908 | |||
Liberal Democrat | Amanda Grimston | 906 | |||
UKIP | Nick Lincoln | 624 | |||
Green | Clair Lester | 120 | |||
TUSC | Derek Foster | 18 | |||
Majority | 121 | ||||
Turnout | |||||
Conservative gain from Liberal Democrat | Swing | ||||
Party | Candidate | Votes | % | ± | |
---|---|---|---|---|---|
Conservative | Linda Topping | 1,701 | |||
Liberal Democrat | Jeanette Aron | 1,568 | |||
Labour | Daniel Kerry | 648 | |||
UKIP | Caroline Penn | 307 | |||
Green | Sally Ivans | 241 | |||
Majority | 133 | ||||
Turnout | 4465 | ||||
Conservative gain from Liberal Democrat | Swing | ||||
Party | Candidate | Votes | % | ± | |
---|---|---|---|---|---|
Liberal Democrat | Shirena Counter | 1,945 | |||
Conservative | Dina Bhudia | 964 | |||
Labour | Sue Sleeman | 581 | |||
Green | Angela Tunstall | 249 | |||
TUSC | Sharon Belsham-Wray | 50 | |||
Majority | 981 | ||||
Turnout | 3789 | ||||
Liberal Democrat hold | Swing | ||||
Party | Candidate | Votes | % | ± | |
---|---|---|---|---|---|
Liberal Democrat | Anne Rindl | 1,677 | |||
Conservative | Rosemarie Sharshini | 1,620 | |||
Labour | Manjivan Dhindsa | 627 | |||
UKIP | Peter Blogg | 309 | |||
Green | Bob Wallace | 207 | |||
Majority | 57 | ||||
Turnout | 4440 | ||||
Liberal Democrat hold | Swing | ||||
Party | Candidate | Votes | % | ± | |
---|---|---|---|---|---|
Liberal Democrat | Darek Scudder | 1,317 | |||
Conservative | Christopher Hawes | 1,008 | |||
Labour | Steven Palmer | 669 | |||
Green | Sean Sweeney | 429 | |||
UKIP | Andrew Cox | 102 | |||
TUSC | John McShane | 30 | |||
Majority | 309 | ||||
Turnout | 3555 | ||||
Liberal Democrat hold | Swing | ||||
Party | Candidate | Votes | % | ± | |
---|---|---|---|---|---|
Conservative | Sean Silver | 1,236 | |||
Liberal Democrat | Joe Fahmy | 842 | |||
Labour | Diana Ivory | 625 | |||
UKIP | Dan Channing | 419 | |||
Green | Anne Simpson | 161 | |||
Majority | 394 | ||||
Turnout | 3283 | ||||
Conservative gain from Liberal Democrat | Swing | ||||
Party | Candidate | Votes | % | ± | |
---|---|---|---|---|---|
Labour | Nasreen Shah | 1,827 | |||
Conservative | Amanda Norwood | 657 | |||
Liberal Democrat | Agnieszka Dychton | 522 | |||
UKIP | Pat Shippey | 259 | |||
Green | Alistair Noble | 237 | |||
TUSC | Clive Jones | 42 | |||
Majority | 1170 | ||||
Turnout | 3544 | ||||
Labour hold | Swing | ||||
Party | Candidate | Votes | % | ± | |
---|---|---|---|---|---|
Conservative | Tony Rogers | 1,125 | |||
Liberal Democrat | Glen Saffrey | 853 | |||
Labour | Omar Ismail | 659 | |||
UKIP | Ian Green | 592 | |||
Green | Alison Wiesner | 119 | |||
Majority | 272 | ||||
Turnout | 3348 | ||||
Conservative gain from Liberal Democrat | Swing | ||||
Watford is a constituency represented in the House of Commons of the UK Parliament since 2010 by Richard Harrington, a member of the Conservative Party.
One third of Watford Borough Council in Hertfordshire, England is elected each year, followed by one year when there is an election to Hertfordshire County Council instead.
Elections to Watford Borough Council were held on 7 May 1998. One third of the council was up for election and the Labour party stayed in overall control of the council.
Elections to Watford Borough Council were held on 6 May 1999. The whole council was up for election with boundary changes since the last election in 1998. The Labour party stayed in overall control of the council.
Elections to Watford Borough Council were held on 4 May 2000. One third of the council was up for election and the Labour party lost overall control of the council to no overall control.
Elections to Watford Borough Council were held on 2 May 2002. One third of the council was up for election and the council stayed under no overall control. At the same time an election for a directly elected mayor was held, which was won by the Liberal Democrat Dorothy Thornhill.
Elections to Watford Borough Council were held on 1 May 2003. One third of the council was up for election and the Liberal Democrats gained overall control of the council from no overall control. Overall turnout was 32.05%.
Elections to Watford Borough Council were held on 10 June 2004. One third of the council was up for election and the Liberal Democrat party kept overall control of the council. Overall turnout was 39.3%.
Elections to Watford Borough Council were held on 4 May 2006. One third of the council was up for election and the Liberal Democrat party kept overall control of the council. At the same time in the election for Watford's directly elected mayor the Liberal Democrat Dorothy Thornhill was re-elected.
Elections to Watford Borough Council were held on 3 May 2007. One third of the council was up for election and the Liberal Democrat party kept overall control of the council.
Dorothy Thornhill, Baroness Thornhill, was the first directly elected mayor of Watford, Hertfordshire, England. She was the Liberal Democrats' first directly elected mayor, and was also the first female directly elected mayor in the United Kingdom. She served as Mayor of Watford from May 2002, until May 2018. She was nominated for a life peerage in August 2015.
The Mayor of Watford is the head of the borough council of Watford, Hertfordshire, England. The holder of the position is a directly-elected mayor using the supplementary vote every four years. The current Mayor of Watford is Peter Taylor, who was elected in May 2018 for the Liberal Democrats.
Elections to Watford Borough Council were held on 3 May 2012. Three years in every four, a third of the council retires and elections are held.
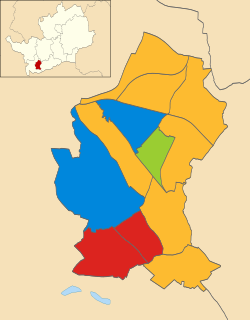
Elections to Watford Borough Council were held on 6 May 2010. Three years in every four, a third of the council retires and elections are held. The council election was held on the same day as the national General Election, when the Labour Party government lost power and the Watford parliamentary constituency was won by the Conservative Party.
Elections to Watford Borough Council in England were held on 5 May 2011. Three years in every four, a third of the council retires and elections are held.
The 2014 Watford Borough Council election took place on 22 May 2014 to elect members of Watford Borough Council in England. This was on the same day as other local elections.
The 2016 Watford Borough Council election took place on 5 May 2016 to elect members of Watford Borough Council in England. This was on the same day as other nationwide local elections. The entire council was up for election, with each of the 12 wards electing 3 councillors.
The 2018 Watford Borough Council election took place on 3 May 2018 to elect members of Watford Borough Council in England. This was the same day as other local elections.