

The environment of Iowa has been heavily affected by agricultural production since it became a U.S. state in 1846. However, there remain natural areas in Iowa that reflect a wide varieties of environmental niches.
The environment of Iowa has been heavily affected by agricultural production since it became a U.S. state in 1846. However, there remain natural areas in Iowa that reflect a wide varieties of environmental niches.
Iowa's natural vegetation is tallgrass prairie and savanna in upland areas, with dense forest and wetlands in floodplains and protected river valleys, and pothole wetlands in northern prairie areas. [1] Most of Iowa is used for agriculture, crops cover 60% of the state, grasslands (mostly pasture and hay with some prairie and wetland) cover 30%, and forests cover 7%; urban areas and water cover another 1% each. [2]

In 1840 Isaac Galland noted a large number of fauna in Iowa, including bison, elk, deer (either white-tailed deer or mule deer), raccoon, fox squirrel, mountain lion, lynx, gray wolf, black wolf, coyote (he called them prairie wolves), bear, beaver, otter, muskrat, mink, rabbits (presumably cottontail rabbit and hare), opossum, skunk, porcupine, groundhog, timber rattlesnake, prairie rattlesnake, bull snake, black snake, water moccasin, garter snake, water snakes, turkey, prairie chicken, quail, swan, geese, brant goose, duck, crane (he called them pelicans), crow, blackbird, bald eagle, "grey eagle" (probably a hawk or falcon), buzzard, raven, mourning dove, passenger pigeon, woodpeckers, woodcocks, hummingbird, and the honeybee. [3] Galland also included a list of edible flora readily available in Iowa, including strawberry, blackberry, raspberry, gooseberry, plum, crabapple, hickory nut, black walnut, butternut, hazelnut, pecan, grape, cherry, black haw, red haw, pawpaw, and cranberry. [3]
The first comprehensive listing of bird species in Iowa was compiled by Charles Rollin Keyes in 1889 which listed 262 species. [4] The first comprehensive listing of mammals in Iowa was made by Herbert Osborne in 1890. [5]
There is a dearth of natural areas in Iowa; less than 1% of the tallgrass prairie that once covered most of Iowa remain intact, only about 5% of the state's prairie pothole wetlands remain, and most of the original forest has been lost. [6] Iowa ranks 49th of U.S. states in public land holdings. [7]

As of 2016, the United States Fish and Wildlife Service the lists of threatened and endangered species in Iowa have included the following: [8]
Federally endangered animal species:
(3 more since 2010)
Federally threatened animal species:
Extirpated federally endangered animal species:

Locally extinguished animals are:
Federally threatened plant species:
Extinct animal species (historical): [9]

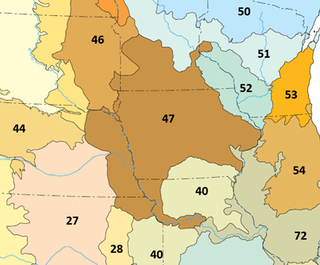
Despite popular perception, Iowa is generally not flat; most of the state consists of rolling hills. Prior [10] divides Iowa into eight landforms based on glaciation, soils, topography, and river drainage:


As in most of the U.S., surface water in Iowa is not safe to drink untreated, contamination by agricultural runoff including nitrates, herbicides, pesticides, and animal waste being common. Municipal water supplies are typically heavily chlorinated, this chlorine, combined with high nitrate levels, often give municipal water a strong smell, and the limestone bedrock in much of the state causes hard water. [11]
Some communities, such as Iowa City resort to additional carbon filtration and lime softening coagulation-sedimentation to make the water more palatable. [12] Water treatment is effective but comes at a price; while the Des Moines' advanced filtration system has led to water quality ranked among the nation's best. [13] In January 2015, the Des Moines Water Works "sued drainage districts in three northern Iowa counties, claiming the tiles there act as a conduit that accelerates the movement of fertilizer from farm fields into Iowa waterways". [14] Between 2010 and 2015 more than 60 Iowa cities and towns had high nitrate levels in drinking water. [14]
In 2015, there were a record number of beach closures because of harmful algal bloom in Iowa. [15]

Major flood events occurred in Iowa in 1851, 1892, 1965, 1993, 2008. The Great flood of 1851 hit all of Iowa, and almost destroyed the nascent town of Des Moines. "The Des Moines and Raccoon rivers rose to an unprecedented height, inundating the entire country east of the Des Moines river. Crops were utterly destroyed, houses and fences swept away." [16] After the town of Dudley was destroyed, survivors moved to higher ground and founded Carlisle. The flood of 1851 produced record levels on the Iowa River at Iowa City and the Cedar River at Cedar Rapids that stood until the Iowa flood of 2008. [17] The flash flood of 1892 destroyed much of Sioux City. [18] The Flood of 1965 affected eastern Iowa, from Cedar Rapids to Dubuque, with cities along the Mississippi hardest hit. The 1993 floods were widespread across the upper Midwest, causing extensive damage to Coralville and Iowa City.
The Natural Resources Conservation Service divides Iowa into 23 soil regions. In general, soils of southern, eastern, and western Iowa are loess-derived, while soils of northern and central Iowa are till-derived. Most level areas of Iowa have soils highly suitable for agriculture, making Iowa one of the most productive farming regions of the world. [19]
The explosion in the number of high-density livestock facilities in Iowa has led to increased risk of rural water contamination and a perceived decline in air quality. [20] Other factors negatively affecting Iowa's environment include the extensive use of older coal-fired power plants, [21] fertilizer and pesticide runoff from crop production,. [22]
The Jordan Aquifer is the largest source of groundwater, extending from northeast Iowa to south central Iowa, and is the source of much of Iowa's agricultural and industrial water. Besides pollution, the aquifer is threatened by overuse in well-source irrigation, ethanol production, and decreased replenishment caused by extensive field tilling. The aquifer has dropped by as much as 300 feet since the 19th century, resulting in dry wells, disappearance of natural surface springs, and decrease of water quality. [23] [24]
| Climate data for Des Moines International Airport, Iowa (1991–2020 normals, [lower-alpha 1] extremes 1878–present [lower-alpha 2] ) | |||||||||||||
|---|---|---|---|---|---|---|---|---|---|---|---|---|---|
| Month | Jan | Feb | Mar | Apr | May | Jun | Jul | Aug | Sep | Oct | Nov | Dec | Year |
| Record high °F (°C) | 67 (19) | 78 (26) | 91 (33) | 93 (34) | 105 (41) | 103 (39) | 110 (43) | 110 (43) | 101 (38) | 95 (35) | 82 (28) | 74 (23) | 110 (43) |
| Mean maximum °F (°C) | 53.4 (11.9) | 58.7 (14.8) | 74.6 (23.7) | 83.9 (28.8) | 88.9 (31.6) | 93.1 (33.9) | 96.2 (35.7) | 94.4 (34.7) | 91.3 (32.9) | 83.3 (28.5) | 70.4 (21.3) | 57.8 (14.3) | 97.4 (36.3) |
| Average high °F (°C) | 30.9 (−0.6) | 35.7 (2.1) | 49.2 (9.6) | 62.0 (16.7) | 72.4 (22.4) | 81.9 (27.7) | 85.6 (29.8) | 83.6 (28.7) | 76.9 (24.9) | 63.4 (17.4) | 48.3 (9.1) | 35.9 (2.2) | 60.5 (15.8) |
| Daily mean °F (°C) | 22.3 (−5.4) | 26.9 (−2.8) | 39.4 (4.1) | 51.3 (10.7) | 62.4 (16.9) | 72.2 (22.3) | 76.0 (24.4) | 73.9 (23.3) | 66.2 (19.0) | 53.2 (11.8) | 39.3 (4.1) | 27.7 (−2.4) | 50.9 (10.5) |
| Average low °F (°C) | 13.8 (−10.1) | 18.0 (−7.8) | 29.6 (−1.3) | 40.6 (4.8) | 52.3 (11.3) | 62.4 (16.9) | 66.4 (19.1) | 64.2 (17.9) | 55.4 (13.0) | 42.9 (6.1) | 30.2 (−1.0) | 19.5 (−6.9) | 41.3 (5.2) |
| Mean minimum °F (°C) | −7.8 (−22.1) | −2.7 (−19.3) | 9.2 (−12.7) | 24.9 (−3.9) | 37.6 (3.1) | 50.2 (10.1) | 56.9 (13.8) | 54.8 (12.7) | 40.4 (4.7) | 26.8 (−2.9) | 12.6 (−10.8) | −1.2 (−18.4) | −11.4 (−24.1) |
| Record low °F (°C) | −30 (−34) | −26 (−32) | −22 (−30) | 9 (−13) | 26 (−3) | 37 (3) | 47 (8) | 40 (4) | 26 (−3) | 7 (−14) | −10 (−23) | −22 (−30) | −30 (−34) |
| Average precipitation inches (mm) | 1.08 (27) | 1.34 (34) | 2.17 (55) | 4.02 (102) | 5.24 (133) | 5.26 (134) | 3.82 (97) | 4.17 (106) | 3.18 (81) | 2.78 (71) | 1.91 (49) | 1.58 (40) | 36.55 (928) |
| Average snowfall inches (cm) | 9.4 (24) | 10.2 (26) | 4.4 (11) | 1.2 (3.0) | 0.2 (0.51) | 0.0 (0.0) | 0.0 (0.0) | 0.0 (0.0) | 0.0 (0.0) | 0.5 (1.3) | 2.7 (6.9) | 7.9 (20) | 36.5 (93) |
| Average precipitation days (≥ 0.01 in) | 8.2 | 8.4 | 9.5 | 11.5 | 12.7 | 11.7 | 9.5 | 9.4 | 8.2 | 8.6 | 7.7 | 7.8 | 113.2 |
| Average snowy days (≥ 0.1 in) | 6.9 | 6.3 | 3.1 | 1.0 | 0.1 | 0.0 | 0.0 | 0.0 | 0.0 | 0.5 | 1.8 | 5.6 | 25.3 |
| Average relative humidity (%) | 71.0 | 71.3 | 67.9 | 63.2 | 63.0 | 64.8 | 67.7 | 70.0 | 70.9 | 66.5 | 71.0 | 74.6 | 68.5 |
| Mean monthly sunshine hours | 157.7 | 163.3 | 206.0 | 222.2 | 276.0 | 312.1 | 337.8 | 297.9 | 239.8 | 210.0 | 138.5 | 129.2 | 2,690.4 |
| Percent possible sunshine | 53 | 55 | 56 | 56 | 61 | 69 | 73 | 70 | 64 | 61 | 47 | 45 | 60 |
| Average ultraviolet index | 1 | 2 | 4 | 6 | 8 | 9 | 9 | 8 | 6 | 4 | 2 | 1 | 5 |
| Source 1: NOAA (relative humidity and sun 1961−1990) [25] [26] [27] | |||||||||||||
| Source 2: Weather Atlas (UV) [28] | |||||||||||||
| Climate data for Quad Cities (Quad City International Airport), 1991–2020 normals, [lower-alpha 3] extremes 1871–present [lower-alpha 4] | |||||||||||||
|---|---|---|---|---|---|---|---|---|---|---|---|---|---|
| Month | Jan | Feb | Mar | Apr | May | Jun | Jul | Aug | Sep | Oct | Nov | Dec | Year |
| Record high °F (°C) | 69 (21) | 74 (23) | 88 (31) | 93 (34) | 104 (40) | 104 (40) | 111 (44) | 106 (41) | 100 (38) | 95 (35) | 80 (27) | 71 (22) | 111 (44) |
| Mean maximum °F (°C) | 53 (12) | 58 (14) | 74 (23) | 83 (28) | 89 (32) | 94 (34) | 95 (35) | 94 (34) | 91 (33) | 84 (29) | 70 (21) | 58 (14) | 97 (36) |
| Average high °F (°C) | 31.8 (−0.1) | 36.6 (2.6) | 49.9 (9.9) | 63.0 (17.2) | 73.9 (23.3) | 83.1 (28.4) | 86.1 (30.1) | 84.1 (28.9) | 77.9 (25.5) | 64.8 (18.2) | 49.8 (9.9) | 37.0 (2.8) | 61.5 (16.4) |
| Daily mean °F (°C) | 23.3 (−4.8) | 27.7 (−2.4) | 39.7 (4.3) | 51.4 (10.8) | 62.5 (16.9) | 72.1 (22.3) | 75.5 (24.2) | 73.4 (23.0) | 66.1 (18.9) | 53.7 (12.1) | 40.4 (4.7) | 28.9 (−1.7) | 51.2 (10.7) |
| Average low °F (°C) | 14.8 (−9.6) | 18.8 (−7.3) | 29.6 (−1.3) | 39.9 (4.4) | 51.1 (10.6) | 61.0 (16.1) | 64.9 (18.3) | 62.7 (17.1) | 54.2 (12.3) | 42.6 (5.9) | 30.9 (−0.6) | 20.8 (−6.2) | 40.9 (4.9) |
| Mean minimum °F (°C) | −9 (−23) | −2 (−19) | 10 (−12) | 25 (−4) | 35 (2) | 48 (9) | 54 (12) | 52 (11) | 39 (4) | 26 (−3) | 14 (−10) | 0 (−18) | −14 (−26) |
| Record low °F (°C) | −33 (−36) | −28 (−33) | −19 (−28) | 7 (−14) | 25 (−4) | 39 (4) | 46 (8) | 40 (4) | 24 (−4) | 11 (−12) | −10 (−23) | −24 (−31) | −33 (−36) |
| Average precipitation inches (mm) | 1.66 (42) | 1.83 (46) | 2.62 (67) | 3.81 (97) | 4.67 (119) | 5.01 (127) | 4.23 (107) | 3.97 (101) | 3.32 (84) | 2.81 (71) | 2.30 (58) | 2.04 (52) | 38.27 (972) |
| Average snowfall inches (cm) | 10.8 (27) | 8.6 (22) | 4.4 (11) | 1.1 (2.8) | 0.0 (0.0) | 0.0 (0.0) | 0.0 (0.0) | 0.0 (0.0) | 0.0 (0.0) | 0.3 (0.76) | 2.1 (5.3) | 8.8 (22) | 36.1 (92) |
| Average precipitation days (≥ 0.01 in) | 9.3 | 8.7 | 10.4 | 11.3 | 12.2 | 11.3 | 8.6 | 9.4 | 8.4 | 9.0 | 8.9 | 9.5 | 117.0 |
| Average snowy days (≥ 0.1 in) | 7.2 | 6.0 | 3.2 | 0.8 | 0.0 | 0.0 | 0.0 | 0.0 | 0.0 | 0.3 | 1.7 | 5.9 | 25.1 |
| Average relative humidity (%) | 69.9 | 69.8 | 68.3 | 64.3 | 64.9 | 65.8 | 70.5 | 73.3 | 72.8 | 68.1 | 71.3 | 74.0 | 69.4 |
| Average dew point °F (°C) | 11.7 (−11.3) | 16.2 (−8.8) | 27.0 (−2.8) | 37.2 (2.9) | 48.2 (9.0) | 57.9 (14.4) | 64.0 (17.8) | 62.6 (17.0) | 54.3 (12.4) | 41.5 (5.3) | 30.4 (−0.9) | 18.3 (−7.6) | 39.1 (3.9) |
| Mean monthly sunshine hours | 148.1 | 153.8 | 180.5 | 210.1 | 255.1 | 284.6 | 301.9 | 271.4 | 222.0 | 192.9 | 121.7 | 113.9 | 2,456 |
| Percent possible sunshine | 50 | 52 | 49 | 53 | 57 | 63 | 66 | 63 | 59 | 56 | 41 | 40 | 55 |
| Source: NOAA (relative humidity, dew point, and sun 1961−1990) [29] [30] [31] | |||||||||||||
| Climate data for Sioux City, Iowa (Sioux Gateway Airport), 1991–2020 normals, extremes 1889–present | |||||||||||||
|---|---|---|---|---|---|---|---|---|---|---|---|---|---|
| Month | Jan | Feb | Mar | Apr | May | Jun | Jul | Aug | Sep | Oct | Nov | Dec | Year |
| Record high °F (°C) | 71 (22) | 75 (24) | 91 (33) | 98 (37) | 106 (41) | 108 (42) | 111 (44) | 108 (42) | 103 (39) | 96 (36) | 82 (28) | 71 (22) | 111 (44) |
| Average high °F (°C) | 29.5 (−1.4) | 34.2 (1.2) | 47.6 (8.7) | 61.1 (16.2) | 72.3 (22.4) | 81.9 (27.7) | 85.0 (29.4) | 82.6 (28.1) | 76.6 (24.8) | 62.8 (17.1) | 46.8 (8.2) | 33.4 (0.8) | 59.5 (15.3) |
| Daily mean °F (°C) | 20.0 (−6.7) | 24.5 (−4.2) | 36.7 (2.6) | 48.9 (9.4) | 60.5 (15.8) | 70.7 (21.5) | 74.2 (23.4) | 71.7 (22.1) | 63.9 (17.7) | 50.3 (10.2) | 35.9 (2.2) | 24.1 (−4.4) | 48.4 (9.1) |
| Average low °F (°C) | 10.4 (−12.0) | 14.8 (−9.6) | 25.9 (−3.4) | 36.7 (2.6) | 48.7 (9.3) | 59.4 (15.2) | 63.4 (17.4) | 60.8 (16.0) | 51.2 (10.7) | 37.9 (3.3) | 25.0 (−3.9) | 14.8 (−9.6) | 37.4 (3.0) |
| Record low °F (°C) | −35 (−37) | −31 (−35) | −22 (−30) | −2 (−19) | 23 (−5) | 38 (3) | 41 (5) | 37 (3) | 24 (−4) | 5 (−15) | −9 (−23) | −28 (−33) | −35 (−37) |
| Average precipitation inches (mm) | 0.69 (18) | 0.86 (22) | 1.76 (45) | 3.15 (80) | 3.87 (98) | 4.35 (110) | 3.35 (85) | 3.94 (100) | 2.84 (72) | 2.20 (56) | 1.27 (32) | 0.99 (25) | 29.27 (743) |
| Average snowfall inches (cm) | 7.7 (20) | 8.7 (22) | 5.7 (14) | 2.3 (5.8) | 0.0 (0.0) | 0.0 (0.0) | 0.0 (0.0) | 0.0 (0.0) | 0.0 (0.0) | 0.8 (2.0) | 3.2 (8.1) | 7.6 (19) | 36.0 (91) |
| Average precipitation days (≥ 0.01 in) | 6.8 | 6.5 | 8.1 | 10.0 | 12.0 | 11.7 | 9.0 | 9.8 | 8.0 | 7.6 | 5.9 | 6.8 | 102.2 |
| Average snowy days (≥ 0.1 in) | 5.9 | 5.7 | 3.4 | 1.4 | 0.0 | 0.0 | 0.0 | 0.0 | 0.0 | 0.5 | 2.5 | 5.4 | 24.8 |
| Average relative humidity (%) | 72.2 | 72.4 | 69.7 | 61.6 | 62.3 | 65.5 | 69.2 | 72.0 | 70.8 | 66.2 | 72.3 | 75.9 | 69.2 |
| Mean monthly sunshine hours | 171.1 | 165.5 | 211.9 | 232.3 | 271.8 | 310.2 | 330.9 | 292.9 | 235.5 | 209.3 | 146.4 | 138.3 | 2,716.1 |
| Percent possible sunshine | 58 | 56 | 57 | 58 | 60 | 68 | 71 | 68 | 63 | 61 | 50 | 49 | 61 |
| Source: NOAA (relative humidity and sun 1961–1990) [32] [33] [34] | |||||||||||||

Waterloo is a city in and the county seat of Black Hawk County, Iowa, United States. As of the 2020 United States Census the population was 67,314, making it the eighth-largest city in the state. The city is part of the Waterloo – Cedar Falls Metropolitan Statistical Area, and is the more populous of the two cities.

Scouting in Iowa has a long history, from the 1910s to the present day, serving thousands of youth in programs that suit the environment in which they live.

Jefferson is a city in Greene County, Iowa, United States, along the North Raccoon River. The population was 4,182 at the time of the 2020 census. It is the county seat of Greene County. It is the home of the Mahanay Memorial Bell Tower, 168 feet (51 m) tall, located on the town square, and visible for miles. The tower is named for Floyd Mahanay, a businessman, philanthropist, and former resident. Jefferson is bisected east to west by the old Lincoln Highway. A new U.S. Route 30 is located approximately one mile to the north.

Iowa City is a city in Johnson County, Iowa, United States. It is the home of the University of Iowa and county seat of Johnson County, at the center of the Iowa City Metropolitan Statistical Area. At the time of the 2020 census the population was 74,828, making it the state's fifth-largest city. The metropolitan area, which encompasses Johnson and Washington counties, has a population of over 171,000. The Iowa City Metropolitan Statistical Area (MSA) is also a part of a Combined Statistical Area (CSA) with the Cedar Rapids MSA. This CSA plus two additional counties are known as the Iowa City-Cedar Rapids region which collectively has a population of nearly 500,000.

Cedar Rapids is the second-largest city in Iowa, United States and is the county seat of Linn County. The city lies on both banks of the Cedar River, 20 miles (32 km) north of Iowa City and 100 miles (160 km) northeast of Des Moines, the state's capital and largest city. It is a part of the Cedar Rapids/Iowa City region of Eastern Iowa, which includes Linn, Benton, Cedar, Iowa, Jones, Johnson, and Washington counties.

Marion is a city in Linn County, Iowa, United States. The population was 26,294 at the 2000 census and was 41,535 in 2020, an increase of 58%. The city is located next to Cedar Rapids and part of the Cedar Rapids Metropolitan Statistical Area.
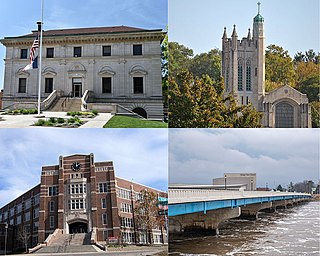
Ottumwa is a city in and the county seat of Wapello County, Iowa, United States. The population was 25,529 at the time of the 2020 U.S. Census. Located in the state's southeastern section, the city is split into northern and southern halves by the Des Moines River. Ottumwa serves as a major economic, commercial, and cultural hub for the Southeastern Iowa region.

The Des Moines River is a tributary of the Mississippi River in the upper Midwestern United States that is approximately 525 miles (845 km) long from its farther headwaters. The largest river flowing across the state of Iowa, it rises in southern Minnesota and flows across Iowa from northwest to southeast, passing from the glaciated plains into the unglaciated hills near the capital city of Des Moines, named after the river, in the center of the state. The river continues to flow at a southeastern direction away from Des Moines, later flowing directly into the Mississippi River.
The Driftless Area, a topographical and cultural region in the American Midwest, comprises southwestern Wisconsin, southeastern Minnesota, northeastern Iowa, and the extreme northwestern corner of Illinois.

The Loess Hills are a formation of wind-deposited loess soil in the westernmost parts of Iowa and Missouri, and the easternmost parts of Nebraska and Kansas, along the Missouri River.

The Raccoon River is a 30.8-mile-long (49.6 km) tributary of the Des Moines River in central Iowa in the United States. As measured using the longest of its three forks, its length increases to 226 miles (364 km). Via the Des Moines River, it is part of the watershed of the Mississippi River. The river runs through an intensely cultivated area of croplands and livestock farming, receiving Tile drainage from slow-draining rich natural bottomland.

Michigan consists of two peninsulas surrounded primarily by four of the Great Lakes and a variety of nearby islands. The Upper Peninsula is bounded on the southwest by Wisconsin, and the Lower Peninsula is bounded on the south by Indiana and Ohio. Both land masses are also separated from the Canadian province of Ontario by waterways of the Great Lakes, and from each other by the Straits of Mackinac. Because its land is largely surrounded by the Great Lakes, which flow into the Saint Lawrence River, Michigan is the only U.S. state whose streams and rivers are almost entirely within the Great Lakes-St. Lawrence watershed.

The geography of Iowa includes the study of bedrock, landforms, rivers, geology, paleontology and urbanisation of the U.S. state of Iowa. The state covers an area of 56,272.81 sq mi (145,746 km2).

The Iowa flood of 2008 was a hydrological event involving most of the rivers in eastern Iowa which began June 8 and continued until July 1. Flooding continued on the Upper Mississippi River in the southeastern area of the state for many more days. The phrase "Iowa's Katrina" was often heard.
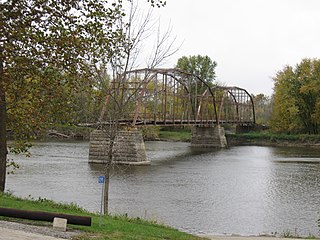
The Sutliff Bridge is a bridge over the Cedar River at Sutliff, a Johnson County community near Lisbon, Iowa, United States. A Parker truss bridge, it was built in 1897 and 1898 at a cost of approximately $12,000. J. R. Sheely was the engineer for the original Sutliff Bridge. After a modern replacement was built over the Cedar in 1983, the bridge was slated for destruction, but it was ultimately saved, and on May 15, 1998, it was added to the National Register of Historic Places.
Lafayette, Louisiana is part of the Gulf Coastal Plain region of the United States and is located at coordinates 30°12′50″N 92°01′46″W. It has an elevation of 36 feet. One of the physical characteristics of the geography include many streams that drain the parish. The primary river that runs through the city is the Vermillion River (Louisiana). This river was formed by the confluence of a few small bayous, stretches about 70 miles long, and drains into the Gulf of Mexico. Most of Lafayette's landscape is urban; however its humid and subtropic climate during the summer allow it to house many species of birds, alligators, and fish. The winter season is mild. While Lafayette is situated in a geographic location that is overall relatively safe, the city is susceptible to flooding; hurricanes are also a common natural disaster.

Iowa is a state in the Midwestern region of the United States, bordered by the Mississippi River to the east and the Missouri River and Big Sioux River to the west. It is bordered by six states: Wisconsin to the northeast, Illinois to the east and southeast, Missouri to the south, Nebraska to the west, South Dakota to the northwest, and Minnesota to the north.

The Burlington, Cedar Rapids and Northern Railway (BCR&N) was a railroad that operated in the United States from 1876 to 1903. It was formed to take over the operations of the bankrupt Burlington, Cedar Rapids and Minnesota Railway, which was, in turn, the result of merging several predecessor lines, the construction of which began in 1869. The corporate headquarters were in Cedar Rapids, Iowa, and it had operations in Iowa and in Minnesota. It was succeeded by the Chicago, Rock Island and Pacific Railway.
The Western Corn Belt Plains is a Level III ecoregion designated by the Environmental Protection Agency (EPA) in seven U.S. states, though predominantly in Iowa.
