Florida's 18th congressional district | |
---|---|
Interactive map of district boundaries since January 3, 2023 | |
Representative | |
Area | 1,889 [1] sq mi (4,890 km2) |
Distribution |
|
Population (2023) | 853,391 [3] |
Median household income | $62,141 [4] |
Ethnicity |
|
Cook PVI | R+13 [5] |
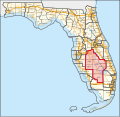
Florida's 18th congressional district is an electoral district for the U.S. Congress, located in the Florida Heartland. In the 2020 redistricting cycle, the district was redrawn to cover inland counties of DeSoto, Glades, Hardee, Hendry, Highlands, and Okeechobee, as well as most of Polk County (including Bartow, eastern Lakeland, and Winter Haven) and some of Immokalee in Collier County. It is essentially the successor to the old 15th district. The district is currently represented by Republican Scott Franklin.
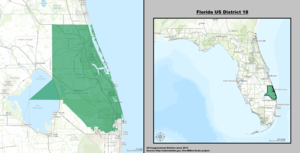
From 2013 to 2023, the district was located in the Treasure Coast and contained the whole of St. Lucie County and Martin County as well as the northeastern part of Palm Beach County, and included Port St. Lucie, Fort Pierce, Stuart, and Jupiter, as well as Treasure Coast International Airport. [6] Much of this district is now the 21st district.
The 18th district was created as a result of the redistricting cycle after the 1980 census. From 1983 to 2012, it was based in South Florida. In its final configuration as a South Florida district, it included portions of Miami-Dade and Monroe counties. The Miami-Dade section included most of the city of Miami, the South Beach section of Miami Beach, and many of the southern Miami suburbs, including Coral Gables and Coral Terrace. The Monroe County section of the district included all of the Florida Keys.
Year | Office | Results [7] |
---|---|---|
2008 | President | McCain 55% - 44% |
2010 | Senate | Rubio 51% - 17% |
Governor | Scott 57% - 43% | |
Attorney General | Bondi 60% - 35% | |
Chief Financial Officer | Atwater 61% - 34% | |
2012 | President | Romney 56% - 44% |
Senate | Nelson 52% - 48% | |
2014 | Governor | Scott 58% - 42% |
2016 | President | Trump 59% - 37% |
Senate | Rubio 59% - 36% | |
2018 | Senate | Scott 60% - 39% |
Governor | DeSantis 60% - 38% | |
Attorney General | Moody 63% - 35% | |
Chief Financial Officer | Patronis 62% - 38% | |
2020 | President | Trump 61% - 38% |
2022 | Senate | Rubio 68% - 31% |
Governor | DeSantis 69% - 30% | |
Attorney General | Moody 71% - 29% | |
Chief Financial Officer | Patronis 69% - 31% | |
2024 | President | Trump 64% - 35% |
Senate | Scott 63% - 35% |
For the 118th and successive Congresses (based on redistricting following the 2020 census), the district contains all or portions of the following counties and communities: [8]
Collier County (1)
DeSotoCounty (2)
GladesCounty (3)
HardeeCounty (9)
HendryCounty (7)
HighlandsCounty (3)
OkeechobeeCounty (3)
PolkCounty (37)
Party | Candidate | Votes | % | |
---|---|---|---|---|
Republican | Ileana Ros-Lehtinen* | 103,512 | 69.11 | |
Democratic | Ray Chote | 42,852 | 28.61 | |
Independent | Orin Opperman | 3,423 | 2.29 | |
Total votes | 149,787 | 100.00 | ||
Turnout | ||||
Republican hold |
Party | Candidate | Votes | % | |
---|---|---|---|---|
Republican | Ileana Ros-Lehtinen* | 143,647 | 64.73 | |
Democratic | Sam Sheldon | 78,281 | 35.27 | |
Total votes | 221,928 | 100.00 | ||
Turnout | ||||
Republican hold |
Party | Candidate | Votes | % | |
---|---|---|---|---|
Republican | Ileana Ros-Lehtinen* | 79,631 | 62.15 | |
Democratic | Dave Patlak | 48,499 | 37.85 | |
Total votes | 128,130 | 100.00 | ||
Turnout | ||||
Republican hold |
Party | Candidate | Votes | % | |
---|---|---|---|---|
Republican | Ileana Ros-Lehtinen* | 140,617 | 57.87 | |
Democratic | Annette Taddeo | 102,372 | 41.11 | |
Total votes | 242,989 | 100.00 | ||
Turnout | ||||
Republican hold |
Party | Candidate | Votes | % | |
---|---|---|---|---|
Republican | Ileana Ros-Lehtinen* | 102,360 | 68.89 | |
Democratic | Rolando A. Banciella | 46,235 | 31.11 | |
Total votes | 148,595 | 100.00 | ||
Turnout | ||||
Republican hold |
Party | Candidate | Votes | % | |||
---|---|---|---|---|---|---|
Democratic | Patrick Murphy | 166,799 | 50.4 | |||
Republican | Allen West* | 164,370 | 49.6 | |||
Total votes | 331,169 | 100.00 | ||||
Turnout | ||||||
Democratic gain from Republican |
Party | Candidate | Votes | % | |
---|---|---|---|---|
Democratic | Patrick Murphy (Incumbent) | 151,478 | 59.78 | |
Republican | Carl J. Domino | 101,896 | 40.22 | |
Total votes | 253,374 | 100.00 | ||
Democratic hold |
Party | Candidate | Votes | % | |
---|---|---|---|---|
Republican | Brian Mast | 201,488 | 53.60 | |
Democratic | Randy Perkins | 161,918 | 43.07 | |
No Party Affiliation | Carla Spalding | 12,503 | 3.33 | |
No Party Affiliation | Marilyn Holloman | 9 | 0.00 | |
Total votes | 375,918 | 100 | ||
Republican gain from Democratic |
Party | Candidate | Votes | % | |
---|---|---|---|---|
Republican | Brian Mast (incumbent) | 185,905 | 54.3 | |
Democratic | Lauren Baer | 156,454 | 45.7 | |
Total votes | 342,359 | 100.0 | ||
Republican hold |
Party | Candidate | Votes | % | |
---|---|---|---|---|
Republican | Brian Mast (incumbent) | 253,286 | 56.3 | |
Democratic | Pam Keith | 186,674 | 41.5 | |
No Party Affiliation | K.W. Miller | 9,760 | 2.2 | |
Total votes | 449,720 | 100.0 | ||
Republican hold |
Party | Candidate | Votes | % | |
---|---|---|---|---|
Republican | Scott Franklin (incumbent) | 167,429 | 74.7 | |
Independent | Keith Hayden Jr | 56,647 | 25.2 | |
Total votes | 224,076 | 100.0 | ||
Republican hold |