Hydroelectricity in Japan

Last updated

Hydroelectricity is the second most important renewable energy source after solar energy in Japan with an installed capacity of 50.0 gigawatt (GW) as of 2019. [1] According to the International Hydropower Association Japan was the world's sixth largest producer of hydroelectricity in 2020. Most of Japanese hydroelectric power plants are pumped-storage plants. Conventional hydropower plants account for about 20 GW out of the total installed capacity as of 2007. [2]

Contents

Conventional hydropower potential of Japan is considered to be almost fully developed, with little opportunity for further capacity increase. [3] In recent years, almost exclusively pumped storage plants were commissioned, significantly increasing the ratio of pumped storage capacity over conventional hydro. [3] The large capacity of pumped storage hydropower was built to store energy from nuclear power plants, which until the Fukushima disaster constituted a large part of Japan electricity generation. As of 2015, Japan is the country with the highest capacity of pumped-storage hydroelectricity in the world, with 26 GW of power installed. [4] After the 2011 nuclear power shutdowns, pumped-storage plants have been increasingly used to balance the variable generation of renewable energy sources such as solar, which have been growing rapidly in recent years. [4]

As of September 2011, Japan had 1,198 small hydropower plants with a total capacity of 3,225 megawatt (MW). The smaller plants accounted for 6.6% of Japan's total hydropower capacity. The remaining capacity was filled by large and medium hydropower stations, typically sited at large dams. Cost per kilowatt-hour for power from smaller plants was high at ¥15-100, hindering further development of the energy source. [5]

List of hydroelectric power stations
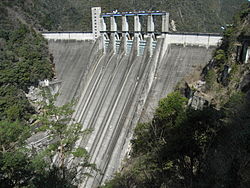
The Sakuma Dam Sakuma-1160-r1.jpg
The Sakuma Dam
The Kurobe Dam Kurobe Dam survey.jpg
The Kurobe Dam
The Maruyama Dam Maruyama Dam survey.jpg
The Maruyama Dam
The Ueno Dam, lower reservoir of the pumped-storage Kannagawa Hydropower Plant RIMG0013.JPG
The Ueno Dam, lower reservoir of the pumped-storage Kannagawa Hydropower Plant
The Futatsuya-Toshuko Dam Futatsuno Dam river maintenance discharge.jpg
The Futatsuya-Tōshukō Dam
StationCapacity (MW)PrefectureCoordinatesStatusType
Akiba Dam 127.1Shizuoka 34°58′20″N137°49′42″E / 34.97222°N 137.82833°E / 34.97222; 137.82833 (Akiba Dam) Operationalpumped storage
Amagase Dam 92Kyoto 34°52′51″N135°49′41″E / 34.88083°N 135.82806°E / 34.88083; 135.82806 (Amagase Dam) Operationalconventional
Arimine Dam 534Toyama 36°29′22″N137°26′55″E / 36.48944°N 137.44861°E / 36.48944; 137.44861 (Arimine Dam) Operationalconventional
Dashidaira Dam 124 Operational
Funagira Dam 32Shizuoka 34°53′26″N137°48′54″E / 34.89056°N 137.81500°E / 34.89056; 137.81500 (Funagira Dam) Operational
Hatanagi-I Hydroelectric Dam 137Shizuoka 35°19′17″N138°10′59″E / 35.32139°N 138.18306°E / 35.32139; 138.18306 (Hatanagi-I Hydroelectric Dam) Operationalpumped storage
Hatanagi-II Hydroelectric Dam 85Shizuoka 35°18′29″N138°12′11″E / 35.30806°N 138.20306°E / 35.30806; 138.20306 (Hatanagi-II Hydroelectric Dam) Operationalpumped storage
Hiraoka Dam 101NaganoOperational
Honkawa [6] 600pumped storage
Ikawa Dam 62Shizuoka 35°12′38″N138°13′22″E / 35.21056°N 138.22278°E / 35.21056; 138.22278 (Ikawa Dam) Operational
Ikehara Pumped Storage Plant 350 Operationalpumped storage
Imaichi Pumped Storage Plant 1,050Tochigi 36°49′31″N139°39′58″E / 36.82528°N 139.66611°E / 36.82528; 139.66611 (Imiachi Dam) Operationalpumped storage
Kadonogawa Power Station 800 Operationalpumped storage
Kannagawa Hydropower Plant U/C2,820Nagano 36°00′18″N138°39′09″E / 36.00500°N 138.65250°E / 36.00500; 138.65250 (Kannagawa Hydropower Plant) Operationalpumped storage
Kazunogawa Pumped Storage Plant 1,200Yamanashi 35°43′07″N138°55′47″E / 35.71861°N 138.92972°E / 35.71861; 138.92972 (Kazunogawa Pumped Storage Plant) Operationalpumped storage
Kinugawa-Kurobe Dam 127 Operational
Kisenyama Pumped Storage Plant 466Kyoto 34°53′30″N135°51′34″E / 34.89167°N 135.85944°E / 34.89167; 135.85944 (Kisenyama Pumped Storage Plant) Operationalpumped storage
Konoyama Dam 126NiigataOperational
Kurobe Dam 335Toyama 36°33′30″N137°40′00″E / 36.55833°N 137.66667°E / 36.55833; 137.66667 (Kurobe Dam) Operational
Kuroda Dam 315Aichi 35°11′14″N137°28′34″E / 35.18722°N 137.47611°E / 35.18722; 137.47611 (Kuroda Dam) Operational
Maruyama Dam 185Gifu 35°28′08″N137°10′20″E / 35.46889°N 137.17222°E / 35.46889; 137.17222 (Maruyama Dam) Operational
Matsubara Dam 50.6Oita 33°11′39″N130°59′38″E / 33.19417°N 130.99389°E / 33.19417; 130.99389 (Matsubara Dam)
Masegawa Dam [6] 288 Operational
Matanoagawa Pumped Storage Plant 1,200Tottori 35°14′44″N133°29′30″E / 35.24556°N 133.49167°E / 35.24556; 133.49167 (Matanoagawa Pumped Storage Plant) Operationalpumped storage
Miboro Dam 215Gifu 36°08′17.7″N136°54′38.9″E / 36.138250°N 136.910806°E / 36.138250; 136.910806 (Miboro Dam) Operational
Midono Pumped Storage Plant [6] 122 Operationalpumped storage
Miho Dam 7.4Kanagawa 35°24′37″N139°02′30″E / 35.41028°N 139.04167°E / 35.41028; 139.04167 (Miho Dam) Operational
Misakubo Dam 50Shizuoka 35°11′05″N137°55′54″E / 35.18472°N 137.93167°E / 35.18472; 137.93167 (Misakubo Dam) Operational
Miyagase Dam 24Kanagawa 35°32′26″N139°15′09″E / 35.54056°N 139.25250°E / 35.54056; 139.25250 (Miyagase Dam) Operational
Miyanaka Dam 449NiigataOperational
Nagano Pumped Storage Plant 220 Operationalpumped storage
Niikappu Pumped Storage Plant 200 Operationalpumped storage
Nishiotaki Dam 234NaganoOperational
Numappara Pumped Storage Plant 675 Operationalpumped storage
Ohashi Dam 615Kōchi 33°46′13″N133°20′12″E / 33.77028°N 133.33667°E / 33.77028; 133.33667 (Ohashi Dam) Operationalpumped storage
Ōigawa Dam 68.2Shizuoka 35°09′53″N138°08′34″E / 35.16472°N 138.14278°E / 35.16472; 138.14278 (Ōigawa Dam) Operational
Okawachi Pumped Storage Power Station [7] 1,280HyōgoOperationalpumped storage
Okukiyotsu Pumped Storage Power Station (1 & 2)1,600NiigataOperationalpumped storage
Okinawa Yanbaru Seawater Pumped Storage Power Station [8] 30Okinawa 26°40′25″N128°15′56″E / 26.67361°N 128.26556°E / 26.67361; 128.26556 (Okinawa Yanbaru Seawater Pumped Storage Power Station) Operationalpumped storage
Okutadami Dam 560Niigata/Fukushima 37°09′12″N139°15′00″E / 37.15333°N 139.25000°E / 37.15333; 139.25000 (Okutadami Dam) Operationalconventional
Okutataragi Pumped Storage Plant 1,932Hyōgo 35°14′12″N134°51′23″E / 35.23667°N 134.85639°E / 35.23667; 134.85639 (Okutataragi Pumped Storage Plant) Operationalpumped storage
Okuyoshino Pumped Storage Plant 1,206Nara 34°7′4″N135°49′16″E / 34.11778°N 135.82111°E / 34.11778; 135.82111 (Okuyoshino Pumped Storage Power Station) Operationalpumped storage
Otori Dam 182Fukushima 37°12′53″N139°12′50″E / 37.21472°N 139.21389°E / 37.21472; 139.21389 (Otori Dam) Operational
Sagami Dam 31Kanagawa; 35°36′56″N139°11′43″E / 35.61556°N 139.19528°E / 35.61556; 139.19528 (Sagami Dam) Operational
Sakuma Dam 350Aichi 35°05′58″N137°47′39″E / 35.09944°N 137.79417°E / 35.09944; 137.79417 (Sakuma Dam) Operationalconventional
Sasamagawa Dam 58Shizuoka 34°58′17″N138°05′38″E / 34.97139°N 138.09389°E / 34.97139; 138.09389 (Sasamagawa Dam) Operational
Senzu Dam 22.2Shizuoka 35°13′00″N138°05′25″E / 35.21667°N 138.09028°E / 35.21667; 138.09028 (Senzu Dam) Operational
Shimogo Pumped Storage Power Station 1,000FukushimaOperationalpumped storage
Shin-Takasegawa Pumped Storage Plant 1,280Nagano 36°28′26″N137°41′23″E / 36.47389°N 137.68972°E / 36.47389; 137.68972 (Shin-Takasegawa Pumped Storage Plant) Operationalpumped storage
Shinanogawa Pumped Storage Plant 234 Operationalpumped storage
Shintoyone Pumped Storage Plant 1,125Aichi 35°07′33″N137°45′38″E / 35.12583°N 137.76056°E / 35.12583; 137.76056 (Shintoyone Pumped Storage Plant) Operationalpumped storage
Shiobara Pumped Storage Plant 900TochigiOperationalpumped storage
Shiogō Dam 58Shizuoka 35°00′05″N138°05′15″E / 35.00139°N 138.08750°E / 35.00139; 138.08750 (Shiogō Dam) Operational
Shiroyama Dam 275Kanagawa 35°35′09″N139°17′22″E / 35.58583°N 139.28944°E / 35.58583; 139.28944 (Shiroyama Dam) Operational
Tagokura Dam 390Fukushima 37°18′38″N139°17′13″E / 37.31056°N 139.28694°E / 37.31056; 139.28694 (Tagokura Dam) Operational
Takami Pumped Storage Plant 200 Operationalpumped storage
Taki Dam 92Fukushima 37°23′13″N139°32′02″E / 37.38694°N 139.53389°E / 37.38694; 139.53389 (Taki Dam) Operational
Tamahara Pumped Storage Power Station 1,200Gunma 36°46′56″N139°03′23″E / 36.78222°N 139.05639°E / 36.78222; 139.05639 (Tamahara Pumped Storage Power Station) Operationalpumped storage
Tashiro Dam 40.1Shizuoka 35°29′55″N138°14′47″E / 35.49861°N 138.24639°E / 35.49861; 138.24639 (Tashiro Dam) Operational
Tedorigawa I Dam 250 Operational
Tokuyama Dam 153Gifu 35°39′55″N136°30′08″E / 35.66528°N 136.50222°E / 35.66528; 136.50222 (Tokuyama Dam) Operational
Okuyahagi Pumped Storage Power Station 1,160Gifu 35°11′59″N137°27′31″E / 35.19972°N 137.45861°E / 35.19972; 137.45861 (Tominaga Dam) Operationalpumped storage
Yagisawa Pumped Storage Plant 240 Operationalpumped storage
Yomihaki Power Station 112 Operational

See also

Related Research Articles

<span class="mw-page-title-main">Small hydro</span> Hydroelectric project at the local level with a few MW production

Small hydro is the development of hydroelectric power on a scale suitable for local community and industry, or to contribute to distributed generation in a regional electricity grid. Exact definitions vary, but a "small hydro" project is less than 50 megawatts (MW), and can be further subdivide by scale into "mini" (<1MW), "micro" (<100 kW), "pico" (<10 kW). In contrast many hydroelectric projects are of enormous size, such as the generating plant at the Three Gorges Dam at 22,500 megawatts or the vast multiple projects of the Tennessee Valley Authority.

<span class="mw-page-title-main">Pumped-storage hydroelectricity</span> Electric energy storage system

Pumped-storage hydroelectricity (PSH), or pumped hydroelectric energy storage (PHES), is a type of hydroelectric energy storage used by electric power systems for load balancing. The method stores energy in the form of gravitational potential energy of water, pumped from a lower elevation reservoir to a higher elevation. Low-cost surplus off-peak electric power is typically used to run the pumps. During periods of high electrical demand, the stored water is released through turbines to produce electric power. Although the losses of the pumping process make the plant a net consumer of energy overall, the system increases revenue by selling more electricity during periods of peak demand, when electricity prices are highest. If the upper lake collects significant rainfall or is fed by a river then the plant may be a net energy producer in the manner of a traditional hydroelectric plant.

<span class="mw-page-title-main">Hydroelectricity</span> Electricity generated by hydropower

Hydroelectricity, or hydroelectric power, is electricity generated from hydropower. Hydropower supplies one sixth of the world's electricity, almost 4500 TWh in 2020, which is more than all other renewable sources combined and also more than nuclear power. Hydropower can provide large amounts of low-carbon electricity on demand, making it a key element for creating secure and clean electricity supply systems. A hydroelectric power station that has a dam and reservoir is a flexible source, since the amount of electricity produced can be increased or decreased in seconds or minutes in response to varying electricity demand. Once a hydroelectric complex is constructed, it produces no direct waste, and almost always emits considerably less greenhouse gas than fossil fuel-powered energy plants. However, when constructed in lowland rainforest areas, where part of the forest is inundated, substantial amounts of greenhouse gases may be emitted.

<span class="mw-page-title-main">Electricity sector in India</span> Power generation and distribution

India is the third largest producer of electricity in the world. During the fiscal year (FY) 2021–22, the total electricity generation in the country was 1,719 TWh, of which 1,484 TWh was generated by utilities.

For solar power, South Asia has the ideal combination of both high solar insolation and a high density of potential customers.

As of August 2020 Chile had diverse sources of electric power: for the National Electric System, providing over 99% of the county's electric power, hydropower represented around 26.7% of its installed capacity, biomass 1.8%, wind power 8.8%, solar 12.1%, geothermal 0.2%, natural gas 18.9%, coal 20.3%, and petroleum-based capacity 11.3%. Prior to that time, faced with natural gas shortages, Chile began in 2007 to build its first liquefied natural gas terminal and re-gasification plant at Quintero near the capital city of Santiago to secure supply for its existing and upcoming gas-fired thermal plants. In addition, it had engaged in the construction of several new hydropower and coal-fired thermal plants. But by July 2020 91% of the new capacity under construction was of renewable power, 46.8% of the total solar and 25.6% wind, with most of the remainder hydro.

According to the International Hydropower Association, Canada is the fourth largest producer of hydroelectricity in the world in 2021 after the United States, Brazil, and China. In 2014, Canada consumed the equivalent of 85.7 megatonnes worth of oil of hydroelectricity, 9.8% of worldwide hydroelectric consumption. Furthermore, hydroelectricity accounted for 25.7% of Canada's total energy consumption. It is the third-most consumed energy in Canada behind oil and natural gas.

<span class="mw-page-title-main">Electricity sector in China</span>

China's electric power industry is the world's largest electricity producer, passing the United States in 2011 after rapid growth since the early 1990s. In 2021, China produced 8.5 petawatt-hour (Pwh) of electricity, approximately 30% of the world's electricity. In 2019, China had produced 7.3 petawatt-hour (PWh) of electricity, more than the next three countries combined.

<span class="mw-page-title-main">Renewable energy in India</span>

India is world's 3rd largest consumer of electricity and world's 3rd largest renewable energy producer with 40% of energy capacity installed in the year 2022 coming from renewable sources. Ernst & Young's (EY) 2021 Renewable Energy Country Attractiveness Index (RECAI) ranked India 3rd behind USA and China. In FY2023-24, India is planning to issue 50 GW tenders for wind, solar and hybrid projects. India has committed for a goal of 500 GW renewable energy capacity by 2030.

There is a large array of stakeholders that provide services through electricity generation, transmission, distribution and marketing for industrial, commercial, public and residential customers in the United States. It also includes many public institutions that regulate the sector. In 1996, there were 3,195 electric utilities in the United States, of which fewer than 1,000 were engaged in power generation. This leaves a large number of mostly smaller utilities engaged only in power distribution. There were also 65 power marketers. Of all utilities, 2,020 were publicly owned, 932 were rural electric cooperatives, and 243 were investor-owned utilities. The electricity transmission network is controlled by Independent System Operators or Regional Transmission Organizations, which are not-for-profit organizations that are obliged to provide indiscriminate access to various suppliers to promote competition.

<span class="mw-page-title-main">Hydroelectric power in the United States</span>

Hydroelectricity is, as of 2019, the second-largest renewable source of energy in both generation and nominal capacity in the United States. In 2021, hydroelectric power produced 31.5% of the total renewable electricity, and 6.3% of the total U.S. electricity.

<span class="mw-page-title-main">Hydroelectric power in India</span>

India is 5th globally for installed hydroelectric power capacity. As of 31 March 2020, India's installed utility-scale hydroelectric capacity was 46,000 MW, or 12.3% of its total utility power generation capacity. Additional smaller hydroelectric power units with a total capacity of 4,683 MW have been installed. India's hydroelectric power potential is estimated at 148,700 MW at 60% load factor. In the fiscal year 2019–20, the total hydroelectric power generated in India was 156 TWh with an average capacity factor of 38.71%.

<span class="mw-page-title-main">Renewable energy in Russia</span> Russias renewable energy sources

Renewable energy in Russia mainly consists of hydroelectric energy. In 2010, the country was the sixth largest producer of renewable energy in the world, although it was 56th when hydroelectric energy was not taken into account. Some 179 TWh of Russia's energy production came from renewable energy sources, out of a total economically feasible potential of 1823 TWh. 16% of Russia's electricity was generated from hydropower, and less than 1% was generated from all other renewable energy sources combined. Roughly 68% of Russia's electricity was generated from thermal power and 16% from nuclear power.

<span class="mw-page-title-main">Electricity sector in Japan</span> Overview of the electricity sector in Japan

The electric power industry in Japan covers the generation, transmission, distribution, and sale of electric energy in Japan. Japan consumed 995.26 TWh of electricity in 2014. Before the 2011 Fukushima Daiichi nuclear disaster, about a quarter of electricity in the country was generated by nuclear power. In the following years, most nuclear power plants have been on hold, being replaced mostly by coal and natural gas. Solar power is a growing source of electricity, and Japan has the third largest solar installed capacity with about 50 GW as of 2017.

<span class="mw-page-title-main">Hydroelectricity in the United Kingdom</span>

As of 2018, hydroelectric power stations in the United Kingdom accounted for 1.87 GW of installed electrical generating capacity, being 2.2% of the UK's total generating capacity and 4.2% of UK's renewable energy generating capacity. This includes four conventional hydroelectric power stations and run-of-river schemes for which annual electricity production is approximately 5,000 GWh, being about 1.3% of the UK's total electricity production. There are also four pumped-storage hydroelectric power stations providing a further 2.8 GW of installed electrical generating capacity, and contributing up to 4,075 GWh of peak demand electricity annually.

<span class="mw-page-title-main">Renewable energy in Taiwan</span>

Renewable energy in Taiwan contributed to 8.7% of national electricity generation as of end of 2013. The total installed capacity of renewable energy in Taiwan by the end of 2013 was 3.76 GW. As of 2020, the Taiwan government aims for a renewable share of 20% by 2025, with coal and gas providing the other 80%.

Thailand has set targets and policies for the development of its energy sector for 2035, with priority being given to indigenous renewable energy resources, including hydropower.

<span class="mw-page-title-main">Renewable energy in Turkey</span>

Renewables supply a quarter of energy in Turkey, including heat and electricity. Some houses have rooftop solar water heating, and hot water from underground warms many spas and greenhouses. In parts of the west hot rocks are shallow enough to generate electricity as well as heat. Wind turbines, also mainly near western cities and industry, generate a tenth of Turkey’s electricity. Hydropower, mostly from dams in the east, is the only modern renewable energy which is fully exploited. Hydropower averages about a fifth of the country's electricity, but much less in drought years. Apart from wind and hydro, other renewables; such as geothermal, solar and biogas; together generated almost a tenth of Turkey’s electricity in 2022.

<span class="mw-page-title-main">Hydroelectricity in China</span>

Hydroelectricity is currently China's largest renewable energy source and the second overall after coal. According to the International Hydropower Association, China is the worlds largest producer of hydroelectricity as of 2021. China's installed hydroelectric capacity in 2021 was 390.9 GW, including 36.4 GW of pumped storage hydroelectricity capacity, up from 233 GW in 2011. That year, hydropower generated 1,300 TWh of power, an increase of 68 TWh over 2018 when hydropower generated 1,232 TWh of power, accounting for roughly 18% of China's total electricity generation.

<span class="mw-page-title-main">Renewable energy in Austria</span>

By the end of 2016 Austria already fulfilled their EU Renewables Directive goal for the year 2020. By 2016 renewable energies accounted to 33.5% of the final energy consumption in all sectors. The renewable energy sector is also accountable for hosting 41,591 jobs and creating a revenue of 7,219 million euros in 2016.

References

  1. https://www.irena.org/-/media/Files/IRENA/Agency/Publication/2020/Mar/IRENA_RE_Capacity_Statistics_2020.pdf [ bare URL PDF ]
  2. "Status of Hydropower in Japan - May 2007" (PDF). New Energy Foundation. Archived from the original (PDF) on 28 July 2017. Retrieved 15 July 2017.
  3. 1 2 "ELECTRICITY REVIEW JAPAN 2015" (PDF). The Federation of Electric Power Companies of Japan. Retrieved 15 July 2017.
  4. 1 2 Fairley, Peter (18 March 2015). "A Pumped Hydro Energy-Storage Renaissance". IEEE Spectrum: Technology, Engineering, and Science News. Retrieved 23 October 2017.
  5. Johnston, Eric, "Small hydropower plants keep it local", Japan Times , 29 September 2011, p. 3.
  6. 1 2 3 "Pumped-Storage Hydroelectric Plants in Japan - Industcards". Archived from the original on 2013-01-03. Retrieved 2013-05-03.
  7. Major Power Plants in Japan
  8. Yanbaru Archived 2007-08-04 at the Wayback Machine