| Constituency | Electorate | Ceremonial County | Local authority |
|---|
| Basildon and Billericay BC | 76,993 | Essex | Basildon |
| Bedford BC | 70,068 | Bedfordshire | Bedford |
| Braintree CC | 70,454 | Essex | Braintree / Chelmsford |
| Brentwood CC | 71,298 | Essex | Brentwood / Epping Forest |
| Broadland CC | 73,822 | Norfolk | Breckland / Broadland |
| Broxbourne BC | 75,454 | Hertfordshire | Broxbourne / East Hertfordshire |
| Bury St Edmunds and Newmarket CC | 75,055 | Suffolk | West Suffolk |
| Cambridge BC | 72,560 | Cambridgeshire | Cambridge |
| Castle Point BC | 76,569 | Essex | Castle Point / Southend-on-Sea |
| Chelmsford BC | 76,454 | Essex | Chelmsford |
| Clacton CC | 70,942 | Essex | Tendring |
| Colchester BC | 74,520 | Essex | Colchester |
| Dunstable and Leighton Buzzard CC | 74,069 | Bedfordshire | Central Bedfordshire |
| East Cambridgeshire CC | 76,279 | Cambridgeshire | East Cambridgeshire / South Cambridgeshire |
| Epping Forest CC | 72,785 | Essex | Epping Forest |
| Great Yarmouth CC | 76,713 | Norfolk | Great Yarmouth / North Norfolk |
| Harlow CC | 70,190 | Essex | Epping Forest / Harlow |
| Harpenden and Berkhamsted CC | 71,635 | Hertfordshire | Dacorum / St Albans |
| Harwich and North Essex CC | 74,056 | Essex | Colchester / Tendring |
| Haverhill and Halstead CC | 70,787 | Essex / Suffolk | Braintree / West Suffolk |
| Hemel Hempstead CC | 70,496 | Hertfordshire | Dacorum |
| Hertford and Stortford CC | 75,396 | Hertfordshire | East Hertfordshire |
| Hertsmere CC | 73,256 | Hertfordshire | Hertsmere / Welwyn Hatfield |
| Hitchin CC | 72,112 | Bedfordshire / Hertfordshire | Central Bedfordshire / North Hertfordshire |
| Huntingdon CC | 75,590 | Cambridgeshire | Huntingdonshire |
| Ipswich BC | 75,117 | Suffolk | Ipswich |
| Ipswich North and Stowmarket CC | 75,860 | Suffolk | East Suffolk / Ipswich / Mid Suffolk |
| Lowestoft CC | 73,967 | Suffolk | East Suffolk |
| Luton North BC | 73,266 | Bedfordshire | Luton |
| Luton South and South Bedfordshire CC | 70,197 | Bedfordshire | Central Bedfordshire / Luton |
| Maldon CC | 70,201 | Essex | Chelmsford / Maldon |
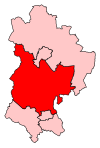
| Mid Bedfordshire CC | 71,748 | Bedfordshire | Bedford / Central Bedfordshire |
| Mid Norfolk CC | 75,389 | Norfolk | Breckland / South Norfolk |
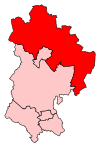
| North Bedfordshire CC | 76,319 | Bedfordshire | Bedford / Central Bedfordshire |
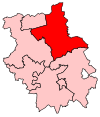
| North East Cambridgeshire CC | 70,806 | Cambridgeshire | Fenland |
| North East Hertfordshire CC | 76,849 | Hertfordshire | East Hertfordshire / North Hertfordshire |
| North Norfolk CC | 76,648 | Norfolk | North Norfolk |
| North Suffolk CC | 76,747 | Suffolk | East Suffolk / Mid Suffolk / West Suffolk |
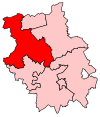
| North West Cambridgeshire CC | 73,556 | Cambridgeshire | Huntingdonshire / Peterborough |
| North West Norfolk CC | 75,200 | Norfolk | Kings Lynn and West Norfolk |
| Norwich North BC | 74,086 | Norfolk | Broadland / Norwich |
| Norwich South BC | 73,515 | Norfolk | Norwich / South Norfolk |
| Peterborough CC | 72,273 | Cambridgeshire | Peterborough |
| Rayleigh and Wickford CC | 76,422 | Essex | Basildon / Rochford |
| Rochford and Southend East CC | 69,841 | Essex | Rochford / Southend-on-Sea |
| Saffron Walden CC | 71,575 | Essex | Epping Forest / Uttlesford |
| South Basildon and East Thurrock CC | 76,260 | Essex | Basildon / Thurrock |
| South Cambridgeshire CC | 75,484 | Cambridgeshire | Cambridge / South Cambridgeshire |
| South Norfolk CC | 76,479 | Norfolk | South Norfolk |
| South Suffolk CC | 71,070 | Suffolk | Babergh |
| South West Norfolk CC | 73,926 | Norfolk | Breckland / Kings Lynn and West Norfolk |
| Southend West BC | 69,817 | Essex | Southend-on-Sea |
| St Albans CC | 70,881 | Hertfordshire | St Albans |
| St Neots CC | 74,699 | Cambridgeshire | Huntingdonshire / South Cambridgeshire |
| Stevenage CC | 70,370 | Hertfordshire | East Hertfordshire / North Hertfordshire / Stevenage |
| Suffolk Coastal CC | 73,270 | Suffolk | East Suffolk |
| Three Rivers CC | 71,552 | Hertfordshire | Dacorum / Three Rivers |
| Thurrock BC | 72,023 | Essex | Thurrock |
| Watford BC | 70,576 | Hertfordshire | Hertsmere / Watford |
| Welwyn Hatfield CC | 74,535 | Hertfordshire | Welwyn Hatfield |
| Witham CC | 74,050 | Essex | Braintree / Colchester / Maldon |


