Texas's 33rd congressional district | |
---|---|
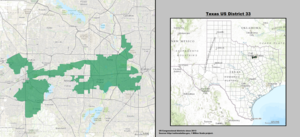
Interactive map of district boundaries since January 3, 2023 | |
Representative | |
Distribution |
|
Population (2023) | 734,551 [1] |
Median household income | $62,386 [1] |
Ethnicity |
|
Cook PVI | D+24 [2] |
Texas's 33rd congressional district is a district that was created as a result of the 2010 census. [3] The first candidates ran in the 2012 House elections, and were seated for the 113th United States Congress. [4]
Texas's 33rd congressional district serves most of the majority-Hispanic precincts in Dallas County and most of the majority-Black and Hispanic precincts in Tarrant County. In Dallas County, the district covers parts of Dallas, Irving, Grand Prairie, Farmers Branch, Carrollton and all of Cockrell Hill. In Tarrant County, the district includes parts of Arlington, Forest Hill, Fort Worth, Grand Prairie, Haltom City, Saginaw and Sansom Park, and all of Everman.[ needs update ]
It is currently represented by Democrat Marc Veasey.
Year | Office | Results [5] |
---|---|---|
2008 | President | Obama 70% - 29% |
2012 | President | Obama 73% - 27% |
2014 | Senate | Alameel 69% - 31% |
Governor | Davis 71% - 29% | |
2016 | President | Clinton 74% - 22% |
2018 | Senate | O'Rourke 79% - 21% |
Governor | Valdez 73% - 25% | |
Lt. Governor | Collier 76% - 22% | |
Attorney General | Nelson 76% - 21% | |
2020 | President | Biden 74% - 24% |
Senate | Hegar 71% - 26% | |
2022 | Governor | O'Rourke 73% - 26% |
Lt. Governor | Collier 72% - 25% | |
Attorney General | Mercedes Garza 72% - 25% | |
Comptroller of Public Accounts | Dudding 69% - 27% | |
2024 | President | Harris 66% - 32% |
Senate | Allred 69% - 28% |
For the 118th and successive Congresses (based on redistricting following the 2020 census), the district contains all or portions of the following counties and communities: [6]
DallasCounty (6)
TarrantCounty (6)
Member | Party | Years | Cong ress | Electoral history | Counties represented |
---|---|---|---|---|---|
District established January 3, 2013 | |||||
![]() Marc Veasey (Fort Worth) | Democratic | January 3, 2013 – present | 113th 114th 115th 116th 117th 118th 119th | Elected in 2012. Re-elected in 2014. Re-elected in 2016. Re-elected in 2018. Re-elected in 2020. Re-elected in 2022. Re-elected in 2024. | 2013–2023![]() Parts of Dallas and Tarrant [7] |
2023–present![]() Parts of Dallas and Tarrant [8] |
Marc Veasey and Domingo García took the top two spots in the May 29, 2012, Democratic Primary. Veasey won the runoff on July 31 to determine who would face the Republican nominee, Chuck Bradley, in the general election. [9] Veasey won the general election and was seated in the new district.
Party | Candidate | Votes | % | ±% | |
---|---|---|---|---|---|
Democratic | Marc Veasey | 85,114 | 72.51% | N/A | |
Republican | Chuck Bradley | 30,252 | 25.77% | N/A | |
Green | Ed Lindsay | 2,009 | 1.71% | N/A | |
Total votes | 117,375 | 100.00% | |||
Democratic win (new seat) |
Party | Candidate | Votes | % | ±% | |
---|---|---|---|---|---|
Democratic | Marc Veasey (incumbent) | 43,769 | 86.51% | +14.00 | |
Libertarian | Jason Reeves | 6,823 | 13.49% | N/A | |
Total votes | 50,592 | 100.00% | |||
Democratic hold |
Party | Candidate | Votes | % | ±% | |
---|---|---|---|---|---|
Democratic | Marc Veasey (incumbent) | 93,147 | 73.71% | –12.80 | |
Republican | M. Mark Mitchell | 33,222 | 26.29% | N/A | |
Total votes | 126,369 | 100.00% | |||
Democratic hold |
Party | Candidate | Votes | % | ±% | |
---|---|---|---|---|---|
Democratic | Marc Veasey (incumbent) | 90,805 | 76.16% | +2.45 | |
Republican | Willie Billups | 26,120 | 21.91% | –4.38 | |
Libertarian | Jason Reeves | 2,299 | 1.93% | N/A | |
Total votes | 119,224 | 100.00% | |||
Democratic hold |
Party | Candidate | Votes | % | ±% | |
---|---|---|---|---|---|
Democratic | Marc Veasey (incumbent) | 105,317 | 66.82% | –9.34 | |
Republican | Fabian Vasquez | 39,638 | 25.15% | +3.24 | |
Independent | Carlos Quintanilla | 8,071 | 5.12% | N/A | |
Libertarian | Jason Reeves | 2,586 | 1.64% | –0.29 | |
Independent | Rene Welton | 1,994 | 1.26% | N/A | |
Total votes | 157,606 | 100.00% | |||
Democratic hold |
Party | Candidate | Votes | % | ±% | |
---|---|---|---|---|---|
Democratic | Marc Veasey (incumbent) | 82,081 | 71.98% | +5.16 | |
Republican | Patrick Gillespie | 29,203 | 25.61% | −0.46 | |
Libertarian | Ken Ashby | 2,746 | 2.41% | +0.77 | |
Total votes | 114,030 | 100.00% | |||
Democratic hold |