The 2008 Thurrock Council election took place on 1 May 2008 to elect members of Thurrock Council in Essex, England. One third of the council was up for election and the council stayed under no overall control. [1]
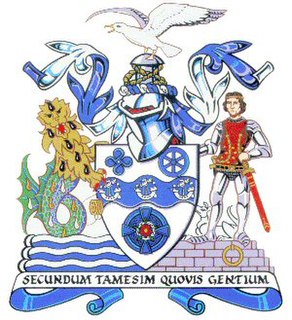
Thurrock Council is the local council for the borough of Thurrock in Essex, England. Since 1997, Thurrock has been a unitary authority, combining the functions of a non-metropolitan county with that of a non-metropolitan district. The other such authority in Essex is Southend-on-Sea. It is a member of the East of England Local Government Association.
Essex is a county in the south-east of England, north-east of London. One of the home counties, it borders Suffolk and Cambridgeshire to the north, Hertfordshire to the west, Kent across the estuary of the River Thames to the south, and London to the south-west. The county town is Chelmsford, the only city in the county. For government statistical purposes Essex is placed in the East of England region.
England is a country that is part of the United Kingdom. It shares land borders with Wales to the west and Scotland to the north-northwest. The Irish Sea lies west of England and the Celtic Sea lies to the southwest. England is separated from continental Europe by the North Sea to the east and the English Channel to the south. The country covers five-eighths of the island of Great Britain, which lies in the North Atlantic, and includes over 100 smaller islands, such as the Isles of Scilly and the Isle of Wight.
After the election, the composition of the council was
The Conservative Party, officially the Conservative and Unionist Party, is a centre-right political party in the United Kingdom. Presently led by Theresa May, it has been the governing party since 2010. It presently has 314 Members of Parliament in the House of Commons, 249 members of the House of Lords, and 18 members of the European Parliament. It also has 31 Members of the Scottish Parliament, 12 members of the Welsh Assembly, eight members of the London Assembly and 9,008 local councillors. One of the major parties of UK politics, it has formed the government on 45 occasions, more than any other party.
The Labour Party is a centre-left political party in the United Kingdom which has been described as an alliance of social democrats, democratic socialists and trade unionists. The party's platform emphasises greater state intervention, social justice and strengthening workers' rights.
The British National Party (BNP) is a far-right, fascist political party in the United Kingdom. It is headquartered in Wigton, Cumbria, and its current leader is Adam Walker. A minor party, it has no elected representatives at any level of UK government. Founded in 1982, the party reached its greatest level of success in the 2000s, when it had over fifty seats in local government, one seat on the London Assembly, and two Members of the European Parliament.
The 2008 election in Thurrock was seen as one of the key national contests with the Conservatives needing to gain one seat to take overall control. [3] [4] Important issues in the election included recycling, local bus services and race relations. [3]
Recycling is the process of converting waste materials into new materials and objects. It is an alternative to "conventional" waste disposal that can save material and help lower greenhouse gas emissions. Recycling can prevent the waste of potentially useful materials and reduce the consumption of fresh raw materials, thereby reducing: energy usage, air pollution, and water pollution.
18 seats were contested in the election with the Tilbury Riverside and Thurrock Park seat being a by-election after the previous councillor resigned. [5] The Conservatives, Labour and British National Party contested all 18 seats except in East Tilbury where the Conservatives did not put up a candidate. [6] There were also 8 Liberal Democrats and 2 other candidates. [6]
Tilbury is a town in the borough of Thurrock, Essex, England. The present town was established as separate settlement in the late 19th century, on land that was mainly part of Chadwell St Mary. It contains a 16th century fort and an ancient cross-river ferry. Tilbury is part of the Port of London with a major deep-water port which contributes to the local economy.
By-elections, also spelled bye-elections, are used to fill elected offices that have become vacant between general elections.
A Councillor is a member of a local government council.
The results saw the council stay under no overall control but with the British National Party gaining a seat. [7] [8] The Conservatives remained the largest party on the council after winning 10 of the seats contested as compared to 6 for Labour. [9] The final seat was won by independent Barry Palmer in East Tilbury. [10]
While the Conservatives were still just short of an overall majority they remained in control of the council due to their existing agreement with the 2 independent councillors. [11] Both main parties said they would not work with the new British National Party councillor, although she said she did not want to work with them anyway. [11]
Following the election in March 2009, Terry Hipsey, the then Conservative leader of the council, defected from the Conservatives to Labour, leaving each of the major parties with 23 councillors. [12]
Party | Seats | Gains | Losses | Net gain/loss | Seats % | Votes % | Votes | +/− | |
---|---|---|---|---|---|---|---|---|---|
Conservative | 10 | 1 | 1 | 0 | 55.6 | 37.2 | 11,900 | +6.5% | |
Labour | 6 | 2 | 2 | 0 | 33.3 | 32.6 | 10,416 | -1.5% | |
BNP | 1 | 1 | 0 | +1 | 5.6 | 21.3 | 6,827 | -3.3% | |
Independent | 1 | 0 | 0 | 0 | 5.6 | 3.5 | 1,115 | -0.7% | |
Liberal Democrat | 0 | 0 | 0 | 0 | 0 | 4.0 | 1,265 | +0.0% | |
UKIP | 0 | 0 | 0 | 0 | 0 | 1.2 | 372 | -0.5% | |
Ind. Working Class | 0 | 0 | 0 | 0 | 0 | 0.3 | 98 | -0.2% | |
Independent Socialist | 0 | 0 | 1 | -1 | 0 | 0 | 0 | 0 |
Party | Candidate | Votes | % | ± | |
---|---|---|---|---|---|
Conservative | Amanda Wilton | 845 | 45.5 | +8.5 | |
BNP | Dave Strickson | 521 | 28.1 | -2.9 | |
Labour | John Garner | 363 | 19.5 | -4.5 | |
Liberal Democrat | John Livermore | 128 | 6.9 | -1.1 | |
Majority | 324 | 17.4 | +11.4 | ||
Turnout | 1,857 | 29.0 | +1.0 | ||
Conservative hold | Swing |
Party | Candidate | Votes | % | ± | |
---|---|---|---|---|---|
Labour | Sue Gray | 786 | 42.8 | +6.8 | |
Conservative | Georgette Polley | 549 | 29.9 | -4.6 | |
BNP | Lauren Kay | 387 | 21.1 | -1.6 | |
Liberal Democrat | John Biddall | 115 | 6.3 | -0.5 | |
Majority | 237 | 12.9 | +11.4 | ||
Turnout | 1,837 | 28.6 | +1.5 | ||
Labour hold | Swing |
Party | Candidate | Votes | % | ± | |
---|---|---|---|---|---|
Labour | Gerard Rice | 925 | 42.0 | -1.3 | |
BNP | Bryn Robinson | 645 | 29.3 | -3.5 | |
Conservative | Amanda Redsell | 515 | 23.4 | +5.8 | |
Liberal Democrat | Peter Saunders | 119 | 5.4 | -0.9 | |
Majority | 280 | 12.7 | +2.2 | ||
Turnout | 2,204 | 30.7 | -0.3 | ||
Labour hold | Swing |
Party | Candidate | Votes | % | ± | |
---|---|---|---|---|---|
Conservative | Garry Hague | 866 | 52.6 | +16.1 | |
Liberal Democrat | Earnshaw Palmer | 390 | 23.7 | -5.2 | |
BNP | Sandra Strickson | 201 | 12.2 | -2.6 | |
Labour | Martin Healy | 188 | 11.4 | -3.7 | |
Majority | 476 | 28.9 | +21.3 | ||
Turnout | 1,645 | 31.1 | +2.4 | ||
Conservative hold | Swing |
Party | Candidate | Votes | % | ± | |
---|---|---|---|---|---|
Conservative | Ian Harrison | 837 | 49.2 | +7.7 | |
Labour | John Cecil | 560 | 32.9 | +0.9 | |
BNP | Warren Parish | 303 | 17.8 | -8.7 | |
Majority | 277 | 16.3 | +6.8 | ||
Turnout | 1,700 | 38.2 | -1.5 | ||
Conservative hold | Swing |
Party | Candidate | Votes | % | ± | |
---|---|---|---|---|---|
Independent | Barry Palmer | 923 | 64.6 | -1.7 | |
BNP | Bradley Elvin | 286 | 20.0 | -4.2 | |
Labour | Felton Flavius | 220 | 15.4 | +5.9 | |
Majority | 637 | 44.6 | +2.5 | ||
Turnout | 1,429 | 31.0 | +0.2 | ||
Independent hold | Swing |
Party | Candidate | Votes | % | ± | |
---|---|---|---|---|---|
Labour | John Kent | 720 | 41.8 | -1.9 | |
Conservative | Paul Coutts | 473 | 27.5 | +6.8 | |
BNP | Jamie Strickson | 398 | 23.1 | -2.6 | |
Liberal Democrat | Claire Jones | 130 | 7.6 | -2.3 | |
Majority | 247 | 14.3 | -3.7 | ||
Turnout | 1,721 | 23.8 | +0.6 | ||
Labour hold | Swing |
Party | Candidate | Votes | % | ± | |
---|---|---|---|---|---|
Labour | Yash Gupta | 1,011 | 47.3 | -1.2 | |
Conservative | Leo Milan-Vega | 555 | 25.9 | -0.8 | |
BNP | Ricky-Lee Strickson | 445 | 20.8 | -4.0 | |
Liberal Democrat | William Jackson | 128 | 6.0 | +6.0 | |
Majority | 456 | 21.4 | -0.4 | ||
Turnout | 2,139 | 33.9 | -0.3 | ||
Labour hold | Swing |
Party | Candidate | Votes | % | ± | |
---|---|---|---|---|---|
Conservative | Joycelyn Redsell | 735 | 46.8 | -18.0 | |
Labour | Bob Moorman | 279 | 17.8 | -4.0 | |
BNP | Dean Kay | 243 | 15.5 | +15.5 | |
UKIP | Alan Broad | 207 | 13.2 | +13.2 | |
Liberal Democrat | Thomas Kelly | 106 | 6.8 | -6.6 | |
Majority | 456 | 29.0 | -14.0 | ||
Turnout | 1,570 | 35.0 | -2.7 | ||
Conservative hold | Swing |
Party | Candidate | Votes | % | ± | |
---|---|---|---|---|---|
Conservative | Amanda Arnold | 1,016 | 45.3 | +10.5 | |
Labour | Wendy Curtis | 806 | 35.9 | +1.8 | |
BNP | Sophie Agass | 422 | 18.8 | -1.9 | |
Majority | 210 | 9.4 | +8.7 | ||
Turnout | 2,244 | 33.9 | +2.8 | ||
Conservative hold | Swing |
Party | Candidate | Votes | % | ± | |
---|---|---|---|---|---|
Conservative | Diane Revell | 1,103 | 59.5 | -13.9 | |
Labour | Angela Gaywood | 420 | 22.7 | +6.9 | |
BNP | Derek Beackon | 330 | 17.8 | +17.8 | |
Majority | 683 | 36.8 | -20.8 | ||
Turnout | 1,853 | 40.0 | -4.3 | ||
Conservative hold | Swing |
Party | Candidate | Votes | % | ± | |
---|---|---|---|---|---|
Conservative | Stephen Veryard | 547 | 55.0 | +8.6 | |
Labour | David Hooper | 188 | 18.9 | -4.2 | |
Liberal Democrat | Adedoyin Ogunfemi | 149 | 15.0 | -15.5 | |
BNP | Donna Strickson | 111 | 11.2 | +11.2 | |
Majority | 359 | 36.1 | +20.2 | ||
Turnout | 995 | 21.5 | -3.9 | ||
Conservative hold | Swing |
Party | Candidate | Votes | % | ± | |
---|---|---|---|---|---|
Conservative | Danny Nicklen | 1,069 | 43.5 | +8.3 | |
Labour | Gordon Gambier | 949 | 38.6 | +0.9 | |
BNP | Danny Brown | 344 | 14.0 | -7.1 | |
Ind. Working Class | Dave Amis | 98 | 4.0 | -2.0 | |
Majority | 120 | 4.9 | |||
Turnout | 2,460 | 38.0 | +1.2 | ||
Conservative gain from Labour | Swing | ||||
Party | Candidate | Votes | % | ± | |
---|---|---|---|---|---|
Conservative | Terry Hipsey | 718 | 44.7 | +5.0 | |
Labour | Anita Nuss | 450 | 28.0 | +0.3 | |
BNP | Anita Jessup | 275 | 17.1 | -0.9 | |
UKIP | Clive Broad | 165 | 10.3 | -4.3 | |
Majority | 268 | 16.7 | +4.7 | ||
Turnout | 1,608 | 33.9 | +2.7 | ||
Conservative hold | Swing |
Party | Candidate | Votes | % | ± | |
---|---|---|---|---|---|
Conservative | Suzanne MacPherson | 1,203 | 45.5 | +4.2 | |
Labour | Anthony Sharp | 901 | 34.1 | +0.4 | |
BNP | Paul Woodley | 542 | 20.5 | -4.5 | |
Majority | 302 | 11.4 | +3.8 | ||
Turnout | 2,646 | 39.5 | +0.5 | ||
Conservative hold | Swing |
Party | Candidate | Votes | % | ± | |
---|---|---|---|---|---|
BNP | Emma Colgate | 530 | 39.9 | +9.7 | |
Labour | Paul Martin | 463 | 34.8 | +0.9 | |
Independent | June Brown | 192 | 14.4 | -9.4 | |
Conservative | Lee Dove | 144 | 10.8 | -1.3 | |
Majority | 67 | 5.1 | |||
Turnout | 1,329 | 30.9 | +5.9 | ||
BNP gain from Labour | Swing | ||||
Party | Candidate | Votes | % | ± | |
---|---|---|---|---|---|
Labour | Lynn Worrall | 519 | 46.5 | -1.2 | |
BNP | Angela Daly | 458 | 41.0 | +14.0 | |
Conservative | Kay Mangion | 139 | 12.5 | -0.9 | |
Majority | 61 | 5.5 | -15.2 | ||
Turnout | 1,116 | 27.8 | -0.3 | ||
Labour gain from Independent | Swing | ||||
Party | Candidate | Votes | % | ± | |
---|---|---|---|---|---|
Labour | Oliver Gerrish | 668 | 40.7 | -1.2 | |
Conservative | Gareth Davies | 586 | 35.7 | +7.2 | |
BNP | Ken Daly | 386 | 23.5 | -6.1 | |
Majority | 82 | 5.0 | -7.3 | ||
Turnout | 1,640 | 25.9 | -0.7 | ||
Labour gain from Conservative | Swing | ||||
The 2007 Thurrock Council election took place on 3 May 2007 to elect members of Thurrock Council in Essex, England. One third of the council was up for election and the Conservative party lost overall control of the council to no overall control.
The 2008 Solihull Metropolitan Borough Council election took place on 1 May 2008 to elect members of Solihull Metropolitan Borough Council in the West Midlands, England. One third of the council was up for election and the Conservative party gained overall control of the council from no overall control.
The 2008 Wyre Forest District Council election took place on 1 May 2008 to elect members of Wyre Forest District Council in Worcestershire, England. One third of the council was up for election and the Conservative party gained overall control of the council from no overall control.
The 2008 Worcester City Council election took place on 1 May 2008 to elect members of Worcester District Council in Worcestershire, England. One third of the council was up for election and the council stayed under no overall control.
The result of the Thurrock Council election, 2010 was that Thurrock Council stay under no overall control. The Conservative party gained two seats from Labour while Labour gained one seat from the Conservatives. Of the 16 wards contested, eight were won by the Conservatives and eight by Labour. The composition of the resulting council was:
The 2010 West Lancashire Borough Council election took place on 6 May 2010 to elect members of West Lancashire Borough Council in Lancashire, England. One third of the council was up for election and the Conservative party stayed in overall control of the council.
The 2008 Rushmoor Council election took place on 1 May 2008 to elect members of Rushmoor Borough Council in Hampshire, England. One third of the council was up for election and the Conservative party stayed in overall control of the council.
The 1999 Solihull Metropolitan Borough Council election took place on 6 May 1999 to elect members of Solihull Metropolitan Borough Council in the West Midlands, England. One third of the council was up for election and the council stayed under no overall control.
The 2004 Solihull Metropolitan Borough Council election took place on 10 June 2004 to elect members of Solihull Metropolitan Borough Council in the West Midlands, England. The whole council was up for election with boundary changes since the last election in 2003. The Conservative party stayed in overall control of the council.
The 2006 Solihull Metropolitan Borough Council election took place on 4 May 2006 to elect members of Solihull Metropolitan Borough Council in the West Midlands, England. One third of the council was up for election and the Conservative party stayed in overall control of the council.
The 2007 Solihull Metropolitan Borough Council election took place on 4 May 2007 to elect members of Solihull Metropolitan Borough Council in the West Midlands, England. One third of the council was up for election and the Conservative party lost overall control of the council to no overall control.
The 2002 Sunderland Council election took place on 2 May 2002 to elect members of Sunderland Metropolitan Borough Council in Tyne and Wear, England. One third of the council was up for election and the Labour party stayed in overall control of the council.
The 2003 Sunderland Council election took place on 1 May 2003 to elect members of Sunderland Metropolitan Borough Council in Tyne and Wear, England. One third of the council was up for election and the Labour party stayed in overall control of the council.
The 2008 Sunderland Council election took place on 1 May 2008 to elect members of Sunderland Metropolitan Borough Council in Tyne and Wear, England. One third of the council was up for election and the Labour party stayed in overall control of the council.
The 2010 Sunderland Council election took place on 6 May 2010 to elect members of Sunderland Metropolitan Borough Council in Tyne and Wear, England. One third of the council was up for election and the Labour party stayed in overall control of the council. The election took place on the same day as the 2010 General Election.
The 2003 Sandwell Metropolitan Borough Council election took place on 1 May 2003 to elect members of Sandwell Metropolitan Borough Council in the West Midlands, England. One third of the council was up for election and the Labour party stayed in overall control of the council.
The 2007 Sandwell Metropolitan Borough Council election took place on 3 May 2007 to elect members of Sandwell Metropolitan Borough Council in the West Midlands, England. One third of the council was up for election and the Labour party stayed in overall control of the council.
On 5 May 2011, one-third of seats on Thurrock Council were contested. The result of the election was that Thurrock Council stayed under no overall control. The Labour gained one seat from the Conservative party.
The 2008 Basildon District Council election took place on 1 May 2008 to elect members of Basildon District Council in Essex, England. One third of the council was up for election and the Conservative party stayed in overall control of the council.
The 2008 Colchester Borough Council election took place on 1 May 2008 to elect members of Colchester Borough Council in Essex, England. One third of the council was up for election and the Conservative party lost overall control of the council to no overall control.