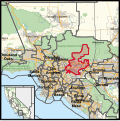
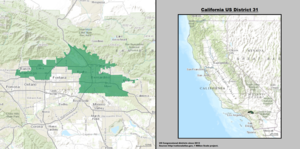
California's 31st congressional district | |
---|---|
Interactive map of district boundaries since January 3, 2023 | |
Representative | |
Population (2023) | 717,084 |
Median household income | $88,407 [1] |
Ethnicity |
|
Cook PVI | D+15 [2] |
California's 31st congressional district is a congressional district in Los Angeles County, in the U.S. state of California. The district is located in the San Gabriel Valley and contains most of the Hispanic-majority areas in that region.
From January 3, 2023, following the 2020 redistricting cycle, the district is currently represented by Democrat Gil Cisneros.
Year | Office | Results [3] [4] [5] [6] |
---|---|---|
2008 | President | Obama 63% - 36% |
2012 | President | Obama 66% - 34% |
2016 | President | Clinton 66% - 29% |
2018 | Governor | Newsom 64% - 36% |
Attorney General | Becerra 67% - 33% | |
2020 | President | Biden 64% - 33% |
2022 | Senate (Reg.) | Padilla 61% - 39% |
Governor | Newsom 58% - 42% | |
Lt. Governor | Kounalakis 59% - 41% | |
Secretary of State | Weber 59% - 41% | |
Attorney General | Bonta 58% - 42% | |
Treasurer | Ma 58% - 42% | |
Controller | Cohen 56% - 44% | |
2024 | President | Harris 57% - 40% |
Senate (Reg.) | Schiff 57% - 43% |
# | County | Seat | Population |
---|---|---|---|
37 | Los Angeles | Los Angeles | 9,663,345 |
As of the 2020 redistricting, California's 31st congressional district is located in Southern California. It takes up part of eastern Los Angeles County.
Los Angeles County is split between this district, the 28th district, the 34th district, and the 38th district. The 31st and the 28th are partitioned by Rio Hondo River, Garvey Ave, Highway 19, Highway 10, Eaton Wash, Temple City Blvd, Valley Blvd, Ellis Ln, Lower Azusa Rd, Grande Ave, Santa Anita Ave, Lynrose St, Flood Control Basin, Peck Rd, Randolph St, Cogswell Rd, Clark St, Durfree Ave, Santa Anita Wash, S 10th Ave, Jeffries Ave, Mayflower/Fairgreen Ave, Alta Vista/Fairgreen Ave, El Norte Ave, S 5th Ave, Valencia Way/N 5th Ave, Hillcrest Blvd, E Hillcrest Blvd, Grand Ave, E Greystone Ave, N Bradoaks Ave, Angeles National Forest, W Fork Rd, Highway 39, Cedar Creek, Iron Fork, Glendora Mountain Rd, Morris Reservoir, W Sierra Madre Ave, N Lorraine Ave, E Foothill Blvd, E Carroll Ave, Steffen St, S Lorraine Ave, AT and SF Railway, E Route 66, N Cataract Ave, San Dimas Canyon Rd, Clayton Ct, Live Oak Canyon, Rotary Dr, Highway 30, Williams Ave, Highway 210, Garey Ave, and Summer Ave.
The 31st, 35th, and 38th are partitioned by Whittier Narrows Recreation Area, N Lexington-Gallatin Rd, N Durfree Ave, E Thienes Ave, E Rush St, N Burkett Rd, Cunningham Dr, Eaglemont Dr, Oakman Dr, Arciero Dr, Grossmont Dr, Workman Mill Rd, Bunbury Dr, Fontenoy Ave, Ankerton, Whittier Woods Circle, Union Pacific Railroad, San Gabriel Freeway, N Peck Rd, Mission Mill Rd, Rose Hills Rd, Wildwood Dr, Clark Ave, San Jose Creek, Turnbull Canyon Rd, E Gale Ave, Pomona Freeway, Colima Rd, E Walnut Dr N, Nogales St, E Walnut Dr S, Fairway Dr, E Valley Blvd, Calle Baja, La Puente Rd, S Sentous Ave, N Nogales St, Amar Rd, Walnut City Parkland, San Bernardino Freeway, Fairplex Dr, Via Verde, Puddingstone Reservoir, McKinley Ave, N Whittle Ave, Arrow Highway, Fulton Rd, and Foothill Blvd. The 31st district takes in the cities of El Monte, West Covina, Baldwin Park, Azusa, San Dimas, La Verne, Duarte, South El Monte, Industry, La Puente, Bradbury, Irwindale, and Covina, the south sides of the cities of Glendora and Monrovia, and the census-designated places Avocado Heights, North El Monte, South San Jose Hills, West Puente Valley, Valinda, Mayflower Village, South Monrovia Island, Vincent, Citrus, and Charter Oak
1962 • 1964 • 1966 • 1968 • 1970 • 1972 • 1974 • 1976 • 1978 • 1980 • 1982 • 1984 • 1986 • 1988 • 1990 • 1992 • 1994 • 1996 • 1998 • 2000 • 2002 • 2004 • 2006 • 2008 • 2010 • 2012 • 2014 • 2016 • 2018 • 2020 • 2022 |
Party | Candidate | Votes | % | ||
---|---|---|---|---|---|
Democratic | Charles H. Wilson (Incumbent) | 76,631 | 52.2 | ||
Republican | Gordon Hahn | 70,154 | 47.8 | ||
Total votes | 146,785 | 100.0 | |||
Democratic win (new seat) |
Party | Candidate | Votes | % | |
---|---|---|---|---|
Democratic | Charles H. Wilson (Incumbent) | 114,246 | 64.0 | |
Republican | Norman G. Shanahan | 64,256 | 36.0 | |
Total votes | 178,502 | 100.0 | ||
Democratic hold |
Party | Candidate | Votes | % | |
---|---|---|---|---|
Democratic | Charles H. Wilson (Incumbent) | 92,875 | 63.4 | |
Republican | Norman G. Shanahan | 53,708 | 36.6 | |
Total votes | 146,583 | 100.0 | ||
Democratic hold |
Party | Candidate | Votes | % | |
---|---|---|---|---|
Democratic | Charles H. Wilson (Incumbent) | 94,387 | 58.9 | |
Republican | James R. Dunn | 62,711 | 39.1 | |
American Independent | Stanley L. Schulte | 3,134 | 2.0 | |
Total votes | 160,232 | 100.0 | ||
Democratic hold |
Party | Candidate | Votes | % | |
---|---|---|---|---|
Democratic | Charles H. Wilson (Incumbent) | 102,071 | 73.2 | |
Republican | Fred L. Casmir | 37,416 | 26.8 | |
Total votes | 139,487 | 100.0 | ||
Democratic hold |
Party | Candidate | Votes | % | |
---|---|---|---|---|
Democratic | Charles H. Wilson (Incumbent) | 85,954 | 52.3 | |
Republican | Ben Valentine | 69,876 | 42.5 | |
Peace and Freedom | Roberta Lynn Wood | 8,582 | 5.2 | |
Total votes | 164,412 | 100.0 | ||
Democratic hold |
Party | Candidate | Votes | % | |
---|---|---|---|---|
Democratic | Charles H. Wilson (Incumbent) | 60,560 | 70.5 | |
Republican | Norman A. Hodges | 23,039 | 26.8 | |
Peace and Freedom | William C. Taylor | 2,349 | 2.7 | |
Total votes | 85,948 | 100.0 | ||
Democratic hold |
Party | Candidate | Votes | % | |
---|---|---|---|---|
Democratic | Charles H. Wilson (Incumbent) | 83,155 | 100.0 | |
Democratic hold |
Party | Candidate | Votes | % | |
---|---|---|---|---|
Democratic | Charles H. Wilson (Incumbent) | 55,667 | 67.8 | |
Republican | Don Grimshaw | 26,490 | 32.2 | |
Total votes | 82,157 | 100.0 | ||
Democratic hold |
Party | Candidate | Votes | % | |
---|---|---|---|---|
Democratic | Mervyn M. Dymally | 69,146 | 64.4 | |
Republican | Don Grimshaw | 38,203 | 35.6 | |
Total votes | 107,349 | 100.0 | ||
Democratic hold |
Party | Candidate | Votes | % | |
---|---|---|---|---|
Democratic | Mervyn M. Dymally (Incumbent) | 86,718 | 72.4 | |
Republican | Henry C. Minturn | 33,043 | 27.6 | |
Total votes | 119,761 | 100.0 | ||
Democratic hold |
Party | Candidate | Votes | % | |
---|---|---|---|---|
Democratic | Mervyn M. Dymally (Incumbent) | 100,658 | 70.7 | |
Republican | Henry C. Minturn | 41,691 | 29.3 | |
Total votes | 142,349 | 100.0 | ||
Democratic hold |
Party | Candidate | Votes | % | |
---|---|---|---|---|
Democratic | Mervyn M. Dymally (Incumbent) | 77,126 | 70.3 | |
Republican | Jack McMurray | 30,322 | 27.6 | |
Peace and Freedom | B. Kwaku Duren | 2,333 | 2.1 | |
Total votes | 109,781 | 100.0 | ||
Democratic hold |
Party | Candidate | Votes | % | |
---|---|---|---|---|
Democratic | Mervyn M. Dymally (Incumbent) | 100,919 | 71.6 | |
Republican | Arnold C. May | 36,017 | 25.5 | |
Peace and Freedom | B. Kwaku Duren | 4,091 | 2.9 | |
Total votes | 151,027 | 100.0 | ||
Democratic hold |
Party | Candidate | Votes | % | |
---|---|---|---|---|
Democratic | Mervyn M. Dymally (Incumbent) | 56,394 | 67.1 | |
Republican | Eunice N. Sato | 27,593 | 32.9 | |
Total votes | 83,987 | 100.0 | ||
Democratic hold |
Party | Candidate | Votes | % | |
---|---|---|---|---|
Democratic | Matthew G. Martínez (Incumbent) | 68,324 | 62.6 | |
Republican | Reuben D. Franco | 40,873 | 37.4 | |
Total votes | 109,197 | 100.0 | ||
Democratic hold |
Party | Candidate | Votes | % | |
---|---|---|---|---|
Democratic | Matthew G. Martínez (Incumbent) | 50,541 | 59.1 | |
Republican | John V. Flores | 34,926 | 40.9 | |
Total votes | 85,467 | 100.0 | ||
Democratic hold |
Party | Candidate | Votes | % | |
---|---|---|---|---|
Democratic | Matthew G. Martínez (Incumbent) | 69,285 | 67.5 | |
Republican | John Flores | 28,705 | 28.0 | |
Libertarian | Michael Everling | 4,700 | 4.5 | |
Total votes | 102,690 | 100.0 | ||
Democratic hold |
Party | Candidate | Votes | % | |
---|---|---|---|---|
Democratic | Matthew G. Martínez (Incumbent) | 61,173 | 70.0 | |
Republican | Frank C. Moreno | 19,786 | 22.7 | |
Green | Krista Lieberg-Wong | 4,377 | 5.0 | |
Libertarian | Michael B. Everling | 1,121 | 1.3 | |
Natural Law | Gary Hearne | 903 | 1.03 | |
Total votes | 87,360 | 100.0 | ||
Democratic hold |
Party | Candidate | Votes | % | |
---|---|---|---|---|
Democratic | Hilda Solis | 89,600 | 79.4 | |
Green | Krista Lieberg-Wong | 10,294 | 9.1 | |
Libertarian | Michael McGuire | 7,138 | 6.3 | |
Natural Law | Richard D. Griffin | 5,882 | 5.2 | |
Total votes | 112,914 | 100.0 | ||
Democratic gain from Republican |
Party | Candidate | Votes | % | |
---|---|---|---|---|
Democratic | Xavier Becerra (Incumbent) | 54,569 | 81.2 | |
Republican | Luis Vega | 12,674 | 18.8 | |
Total votes | 67,243 | 100.0 | ||
Democratic hold |
Party | Candidate | Votes | % | |
---|---|---|---|---|
Democratic | Xavier Becerra (Incumbent) | 89,363 | 80.3 | |
Republican | Luis Vega | 22,048 | 19.7 | |
Total votes | 111,411 | 100.0 | ||
Democratic hold |
Party | Candidate | Votes | % | |
---|---|---|---|---|
Democratic | Xavier Becerra (Incumbent) | 64,952 | 100.0 | |
Democratic hold |
Party | Candidate | Votes | % | |
---|---|---|---|---|
Democratic | Xavier Becerra (Incumbent) | 110,955 | 100.0 | |
Democratic hold |
Party | Candidate | Votes | % | |
---|---|---|---|---|
Democratic | Xavier Becerra (Incumbent) | 76,363 | 83.8 | |
Republican | Stephen C. Smith | 14,740 | 16.2 | |
Total votes | 91,103 | 100.0 | ||
Democratic hold |
Party | Candidate | Votes | % | |
---|---|---|---|---|
Republican | Gary Miller (Incumbent) | 88,964 | 55.2 | |
Republican | Robert Dutton | 72,255 | 44.8 | |
Total votes | 161,219 | 100.0 | ||
Republican hold |
Party | Candidate | Votes | % | |
---|---|---|---|---|
Democratic | Pete Aguilar | 51,622 | 51.7 | |
Republican | Paul Chabot | 48,162 | 48.3 | |
Total votes | 99,784 | 100.0 | ||
Democratic gain from Republican |
Party | Candidate | Votes | % | |
---|---|---|---|---|
Democratic | Pete Aguilar (Incumbent) | 121,070 | 56.1 | |
Republican | Paul Chabot | 94,866 | 43.9 | |
Total votes | 215,936 | 100.0 | ||
Democratic hold |
Party | Candidate | Votes | % | |
---|---|---|---|---|
Democratic | Pete Aguilar (Incumbent) | 110,343 | 58.7 | |
Republican | Sean Flynn | 77,352 | 41.3 | |
Total votes | 187,695 | 100.0 | ||
Democratic hold |
Party | Candidate | Votes | % | |
---|---|---|---|---|
Democratic | Pete Aguilar (Incumbent) | 175,315 | 61.3 | |
Republican | Agnes Gibboney | 110,735 | 38.7 | |
Total votes | 286,045 | 100 | ||
Democratic hold |
Party | Candidate | Votes | % | |
---|---|---|---|---|
Democratic | Grace Napolitano (Incumbent) | 91,472 | 59.5 | |
Republican | Daniel Bocic Martinez | 62,153 | 40.5 | |
Total votes | 153,625 | 100.0 | ||
Democratic hold |
Formerly, from 2003 to 2013, the district was located in Los Angeles County. It was the only congressional district entirely based within the City of Los Angeles, and included Hollywood and some predominantly Hispanic/Latino sections of central and northeast Los Angeles.