Florida's 19th congressional district | |
---|---|
Interactive map of district boundaries since January 3, 2023 | |
Representative | |
Area | 1,367 [1] sq mi (3,540 km2) |
Distribution |
|
Population (2023) | 809,197 [3] |
Median household income | $76,248 [3] |
Ethnicity |
|
Cook PVI | R+13 [4] |
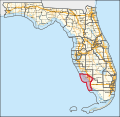
Florida's 19th congressional district is a U.S. congressional district in Southwest Florida. It includes the cities of Cape Coral, Fort Myers, Fort Myers Beach, Sanibel, Bonita Springs, Naples and Marco Island, as well as unincorporated areas in Lee and Collier counties. It has been represented by Republican Byron Donalds since 2021.
The 19th district was created as a result of the redistricting cycle after the 1980 census. From then until 1993, it was a Miami-based district; much of its territory is now the 25th district. From 1993 to 2013, it covered parts of Fort Lauderdale and West Palm Beach; this area is now the 23rd district. The current 19th covers most of the territory that was the 14th district from 1993 to 2013.
Year | Office | Results [5] |
---|---|---|
2008 | President | McCain 57% - 42% |
2010 | Senate | Rubio 59% - 9% |
Governor | Scott 64% - 36% | |
Attorney General | Bondi 65% - 28% | |
Chief Financial Officer | Atwater 65% - 25% | |
2012 | President | Romney 62% - 38% |
Senate | Mack IV 57% - 43% | |
2014 | Governor | Scott 64% - 36% |
2016 | President | Trump 60% - 37% |
Senate | Rubio 66% - 31% | |
2018 | Senate | Scott 62% - 38% |
Governor | DeSantis 62% - 37% | |
Attorney General | Moody 65% - 34% | |
Chief Financial Officer | Patronis 63% - 37% | |
2020 | President | Trump 60% - 39% |
2022 | Senate | Rubio 68% - 31% |
Governor | DeSantis 69% - 30% | |
Attorney General | Moody 70% - 30% | |
Chief Financial Officer | Patronis 69% - 31% | |
2024 | President | Trump 64% - 35% |
For the 118th and successive Congresses (based on redistricting following the 2020 census), the district contains all or portions of the following counties and communities: [6]
CollierCounty (7)
LeeCounty (30)
Party | Candidate | Votes | % | |
---|---|---|---|---|
Democratic | Robert Wexler (Incumbent) | 156,747 | 72.16% | |
Republican | Jack Merkle | 60,477 | 27.84% | |
Majority | 96,720 | 44.32% | ||
Turnout | 217,224 | |||
Democratic hold |
Party | Candidate | Votes | % | ±% | |
---|---|---|---|---|---|
Democratic | Robert Wexler (Incumbent) | 202,345 | 100% | +27.84% | |
Majority | 202,345 | 100% | +55.68% | ||
Turnout | 202,345 | −6.85% | |||
Democratic hold | Swing | [ ? ] |
Party | Candidate | Votes | % | ±% | |
---|---|---|---|---|---|
Democratic | Robert Wexler (Incumbent) | 178,456 | 100% | ||
Majority | 178,456 | 100% | |||
Turnout | 178,456 | −11.8% | |||
Democratic hold | Swing | [ ? ] |
Party | Candidate | Votes | % | ±% | |
---|---|---|---|---|---|
Democratic | Robert Wexler (Incumbent) | 202,465 | 66.16% | −33.84% | |
Republican | Edward Lynch | 83,357 | 27.24% | +27.24% | |
Independent | Benjamin Graber | 20,214 | 6.61% | +6.61% | |
Majority | 119,108 | 38.92% | −61.08% | ||
Turnout | 306,036 | +71.49% | |||
Democratic hold | Swing | [ ? ] |
Party | Candidate | Votes | % | ±% | |
---|---|---|---|---|---|
Democratic | Ted Deutch | 43,269 | 62.06% | −4.10% | |
Republican | Edward Lynch | 24,549 | 35.21% | +7.97% | |
Independent | Jim McCormick | 1,905 | 2.73% | +2.73% | |
Majority | 18,720 | 26.85% | −12.07% | ||
Turnout | 69,723 | −77.22% | |||
Democratic hold | Swing | [ ? ] |
Party | Candidate | Votes | % | ±% | |
---|---|---|---|---|---|
Democratic | Ted Deutch (Incumbent) | 132,098 | 62.59% | +0.53% | |
Republican | Joe Budd | 78,733 | 37.30% | +2.09% | |
Write-In | Others | 228 | 0.11% | +0.11% | |
Majority | 53,365 | 25.29% | −1.56% | ||
Turnout | 211,059 | +202.71% | |||
Democratic hold | Swing | [ ? ] |
Party | Candidate | Votes | % | |||
---|---|---|---|---|---|---|
Republican | Trey Radel | 189,833 | 62.0% | |||
Democratic | Jim Roach | 109,746 | 35.8% | |||
No Party Affiliation | Brandon M. Smith | 6,637 | 2.2% | |||
Total votes | 306,216 | |||||
Turnout | ||||||
Republican gain from Democratic |
Party | Candidate | Votes | % | |
---|---|---|---|---|
Republican | Curt Clawson | 66,922 | 66.9% | |
Democratic | April Freeman | 29,314 | 29.3% | |
Libertarian | Ray Netherwood | 3,729 | 3.7% | |
Write-In | Timothy J. Rossano | 24 | 0.0% | |
Total votes | 99,989 | |||
Republican hold |
Party | Candidate | Votes | % | |
---|---|---|---|---|
Republican | Curt Clawson (Incumbent) | 159,354 | 64.6% | |
Democratic | April Freeman | 80,824 | 32.7% | |
Libertarian | Ray Netherwood | 6,671 | 2.7% | |
Write-In | Timothy J. Rossano | 12 | 0.0% | |
Total votes | 246,861 | |||
Turnout | ||||
Republican hold |
Party | Candidate | Votes | % | |
---|---|---|---|---|
Republican | Francis Rooney | 239,225 | 65.9% | |
Democratic | Robert M. Neeld | 123,812 | 34.1% | |
Write-In | David Byron | 109 | 0% | |
Write-In | Timothy John Rossano | 20 | 0% | |
Total votes | 363,166 | |||
Republican hold |
Party | Candidate | Votes | % | |
---|---|---|---|---|
Republican | Francis Rooney (incumbent) | 211,465 | 62.3% | |
Democratic | David Holden | 128,106 | 37.7% | |
Independent | Pete Pollard (write-in) | 36 | 0.0% | |
Total votes | 339,607 | 100.0% | ||
Republican hold |
Party | Candidate | Votes | % | ||
---|---|---|---|---|---|
Republican | Byron Donalds | 272,440 | 61.27% | ||
Democratic | Cindy Banyai | 172,146 | 38.72% | ||
Independent | Patrick Post (write-in) | 3 | 0.01% | ||
Total votes | 444,589 | 100.0% | |||
Republican hold |
Party | Candidate | Votes | % | ||
---|---|---|---|---|---|
Republican | Byron Donalds (incumbent) | 213,035 | 68.01% | ||
Democratic | Cindy Banyai | 100,226 | 31.99% | ||
Independent | Patrick Post (write-in) | 13 | 0% | ||
Total votes | 313,274 | 100.0% | |||
Republican hold |