The results of a DNA study conducted by the National Geographic's "The Genographic Project", based on genetic testings of Filipino people by the National Geographic in 2008–2009, found that the Philippines is made up of around 53% Southeast Asia and Oceania, 36% East Asian, 5% Southern European, 3% South Asian and 2% Native American genes.[1]
A 2008 genetic study by Leeds University and published in Molecular Biology and Evolution, showed that mitochondrial DNA lineages have been evolving within Maritime Southeast Asia since modern humans arrived approximately 50,000 years ago. The authors concluded that it was proof that Austronesians evolved within Island Southeast Asia and did not come from Taiwan (the "Out-of-Sundaland" hypothesis). Population dispersals occurred at the same time as sea levels rose, which resulted in migrations from the Philippine Islands into Taiwan within the last 10,000 years.[6]
However, these have been repudiated by a 2014 study published by Nature using whole genome sequencing (instead of only mtDNA) which has found that all ISEA populations had genes originating from the aboriginal Taiwanese. Contrary to the claim of a south-to-north migration in the "Out-of-Sundaland" hypothesis, the new whole genome analysis strongly confirms the north-to-south dispersal of the Austronesian peoples in the prevailing "Out-of-Taiwan" hypothesis. The researchers further pointed out that while humans have been living in Sundaland for at least 40,000 years, the Austronesian people were recent arrivals. The results of the 2008 study failed to take into account admixture with the more ancient but unrelated Negrito and Papuan populations.[7][5]
A 2021 study states that the Philippines faced five migratory waves, with the first being led by Northern and Southern Negritos, who were distantly related to Australian and Papuan groups. The next wave was led by Manobo and Sama, who populated the southern Philippines. The Sama show high genetic affinities with Austroasiatic-speaking groups in Mainland Southeast Asia such as Mlabri and Htin and diverged from a common East Asian branch before Han, Dai, and Kinh split from Amis, Atayal, or Cordillerans. The latest wave was led by the Cordillerans, who settled in the Cordilleran mountain range of north-central Luzon. They mixed with the older Negrito populations although Southern Negritos received additional Papuan-related ancestry. However, central Cordillerans show no admixture with Negritos despite extensive interaction with their neighbors. The study also found evidence of Northeast Asian ancestry, originating from the coastal China/Taiwan area, being dispersed into the Batanes Islands and coastal regions of Luzon. Overall, all Filipino ethnic groups share more alleles with Cordillerans than with Austronesians like Ami or Atayal, who display some admixture with Austroasiatic-related and Northeast Asian-related groups.[8]
In addition, there is evidence of low-lying European ancestry in individuals from Bolinao, Cebuano, Ibaloi, Itabayaten, Ilocano, Ivatan, Kapampangan, Pangasinan, and Yogad groups, dating back to the Spanish colonial period. Nonetheless, Filipino demography remains relatively unaffected by Spanish colonialism compared to other colonies.[8]
Y-DNA haplogroups
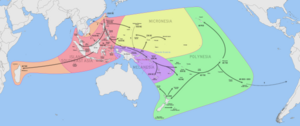
Distribution of Y haplogroup O lineages in East Asia
The most frequently occurring Y-DNA haplogroups among modern Filipinos are haplogroup O1a-M119, which has been found with maximal frequency among the indigenous peoples of Nias, the Mentawai Islands, northern Luzon, the Batanes, and Taiwan, and Haplogroup O2-M122, which is found with high frequency in many populations of East Asia, Southeast Asia, and Polynesia.
In particular, the type of O2-M122 that is found frequently among Filipinos in general, O-P164(xM134), is also found frequently in other Austronesian populations, including Polynesians.[9][10][11] Trejaut et al. 2014 found O2a2b-P164(xO2a2b1-M134) in 26/146 = 17.8% of a pool of samples of Filipinos (4/8 = 50% Mindanao, 7/31 = 22.6% Visayas, 10/55 = 18.2% South Luzon, 1/6 = 17% North Luzon, 2/22 = 9.1% unknown Philippines, 2/24 = 8.3% Ivatan).
The distributions of other subclades of O2-M122 in the Philippines were sporadic, but it may be noted that O2a1b-JST002611 was observed in 6/24 = 25% of a sample of Ivatan and 1/31 = 3.2% of a sample from the Visayas, O2a2a1a2-M7 was observed in 1/6 = 17% of a sample from North Luzon, 1/55 = 1.8% of a sample from South Luzon, and 1/31 = 3.2% of a sample from the Visayas, and O2a2b1a1a-M133 was observed in 2/31 = 6.5% of a sample from the Visayas.[10] A total of 45/146 = 30.8% of the sampled Filipinos were found to belong to Haplogroup O2-M122.[10]
In a study by Delfin et al. (2011), 21.1% (8/38) of a sample of highlanders of northern Luzon (17 Bugkalot, 12 Kalanguya, 6 Kankanaey, 2 Ibaloi, and 1 Ifugao) were found to belong to haplogroup O2a2a1a2-M7, which is outside of the O2a2b-P164 clade and is uncommon among Austronesian-speaking populations, being rather frequently observed among speakers of Hmong-Mien, Katuic, and Bahnaric languages in southwestern China and eastern Mainland Southeast Asia. [12] (Delfin et al. also observed O-M7 in 5/39 = 12.8% of a sample of Agta from Iriga in southeastern Luzon and 5/36 = 13.9% of a sample of Ati from Panay.[12])
Haplogroup O1a-M119 is also commonly found among Filipinos (25/146 = 17.1% O1a-M119(xO1a1a-P203, O1a2-M50), 20/146 = 13.7% O1a1a-P203, 17/146 = 11.6% O1a2-M50, 62/146 = 42.5% O1a-M119 total according to Trejaut et al. 2014) and is shared with other Austronesian-speaking populations, especially those in Taiwan, western Indonesia, and Madagascar.[13]
Haplogroups R-M343 and I-M253
The most common Y-DNA Haplogroup type is O, which Filipinos share with Chinese and fellow Southeast Asians. The South Asian Y-DNA H1a indicate the presence of Indians while the 13% frequency of European Y-DNA R1b is evidence of Spanish immigration.
After the 16th century, the colonial period saw the influx of genetic influence from other populations. This is evidenced by the presence of a small percentage of the Y-DNA Haplogroup R1b (R-M343) present among the population of the Philippines. DNA studies vary as to how small these lineages are. A year 2001 study conducted by Stanford UniversityAsia-Pacific Research Center stated that only 3.6% of the Philippine population had European Y-DNA. This however is contrasted by genetic studies done by Applied Biosystems and FamilyTreeDNA, wherein the R1b Y-DNA Haplotype common in Spain and Western Europe was also detected among 12-13% of the sample size of Filipinos, which had come to the area, via immigration from Spain and Latin America, as well as haplogroup I1 which came from Germanic Europeans and had spread to the Philippines mostly from Anglo-America (USA) and consisting to about 0.95% of the sample size. Also included is haplogroup H1a, that came from South Asian sources.[14][15][16]
According to another genetic study done by the Kaiser Permanente (KP) Research Program on Genes, Environment, and Health (RPGEH), substantial number of Californian residents self-identifying as Filipinos sampled have "modest" amounts of European ancestry consistent with older admixture.[17] Therefore implying that the mostly native majority population of the Philippines, still posses Spanish admixture in their genetics in minor percentages per person.[17]
The analysis of the full autosomal genome of 1,082 individuals from the Philippines has shown that "in contrast to several other Spanish-colonized regions, Philippine demography appears to have remained largely unaffected by admixture with Europeans" (Larena et al. 2021). European admixture is found at a low level among individuals from lowland groups such as Ilocanos and Cebuanos, and reaches significant population-wide levels among urbanized lowlanders (who form half the population of the country),[18]Bicolanos and Chavacano-speaking Mestizos.[19]
Haplogroup Q-M242
One study found that the Y-DNA of 2 out of 64 sampled Filipino males belonged to Haplogroup Q-M242 (which has its highest frequency among Native Americans, Asian Siberians, and in Central Asians).[20] Coincidentally, it is in a similar percentage to the previously mentioned National Geographic study, which stated that 2% of the population is Native American.[1]
Mitochondrial DNA haplogroups
This section needs expansion. You can help by adding to it. (October 2021)
From India
The Indian Mitochondrial DNA haplogroups, M52'58 and M52a are also present in the Philippines suggesting that there was Indian migration to the archipelago starting from the 5th Century AD.[21]
The integration of Southeast Asia into Indian Ocean trading networks around 2,000 years ago also shows some impact, with South Asian genetic signals that are present in the Indonesian archipelago also extending into the Philippines among the Sama-Bajau communities.[19]
A recent genetic study found 10-20% of Cebuano ancestry is attributable to South Asian (Indian) descent,[22] dated to a time when Precolonial Cebu practiced Hinduism.[23]
Anthropometry
Craniometry
A Craniometric Racial Graph of Filipinos (using Historical samples and Modern samples) by Matthew C. Go. Structure map showing estimated ancestry proportions for the historical (H) and modern (M) Filipino populations when shown using the posterior group membership probability for reference pools that are Hispanic, Asian, European, and African. Every person is symbolized by a single vertical line divided into four segments of varying colors, each of which represents the estimated ancestry elements. The posterior probability value is the length of the colored section. The people are arranged in decreasing order according to their amount of estimated Asian heritage.
Scientist, Matthew C. Go, in a Trihybrid Ancestry Variation Analysis approach to Admixture in Filipinos, published a study wherein it was discovered that upon exhuming the remains around the public cemetery of the "Manila North Cemetery" as well as other public cemeteries across the Philippines, and practicing forensic anthropology on them, Matthew C. Go estimated that 71% of the mean amount, among the samples exhumed, have attribution to Asian descent while 7% is attributable to European descent.[24] Filipinos have significantly less Asian ancestry compared to other Asian nationalities like the Koreans who are 90% Asian, Japanese at 96%, Thai at 93%, and Vietnamese at 84%.[24]
Nevertheless, a 2019 Anthropology Study by Beatrix Dudzik and also Matthew Go, while using skeletons collated by the University of the Philippines and sampled from all across the Philippines, thus published in the Journal of Human Biology, using physical anthropology, estimated that, 72.7% of Filipinos are Asian, 12.7% of Filipinos can be classified as Hispanic, 7.3% as Indigenous American, African at 4.5% and European at 2.7%.[25] However, this is only according to an interpretation of the data wherein the reference groups, which were attributed to the Filipino samples; for the Hispanic category, were Mexican-Americans, and the reference groups for the European, African, and Indigenous American, categories, were: White Americans, Black Americans, and Native Americans from the USA, while the Asian reference groups were sourced from Chinese, Japanese, and Vietnamese origins.[25]
In contrast, a different anthropology study using Morphoscopic ancestry estimates in Filipino crania using multivariate probit regression models by J. T. Hefner and also Matthew C. Go, published on year 2020, while analyzing Historic and Modern samples of skeletons in the Philippines, paint a different picture,[26] in that, when the reference group for "Asian" was Thailand (Southeast Asians) rather than Chinese, Japanese, and Vietnamese; and the reference group for "Hispanic" were Colombians (South Americans) rather than Mexicans,[26] the combined historical and modern sample results for Filipinos, yielded the following ratios: Asian at 48.6%, African at 32.9%, and only a small portion classifying as either European at 12.9%, and finally for Hispanic at 5.7%.[26]
In 2017, a Japanese scientist, Nandar Yukyi,[27] using a Multivariate Analysis of Craniometric Variation Of Modern Asian And Hispanic Individuals; as her graduate Thesis,[27] found that Mexican and Filipino skeletal samples taken from prisons at Mexico and the Philippines, cluster together, when it comes to physical dimensions, and that there were several instances wherein Filipinos and Mexicans were misclassified into each other's racial categories, and the same happened to Ainu Japanese skeletal samples.[27]
↑ Sheyla Mirabal, Kristian J. Herrera, Tenzin Gayden, Maria Regueiro, Peter A. Underhill, Ralph L. Garcia-Bertrand, and Rene J. Herrera, "Increased Y-chromosome resolution of haplogroup O suggests genetic ties between the Ami aborigines of Taiwan and the Polynesian Islands of Samoa and Tonga." Gene 492 (2012) 339–348. doi:10.1016/j.gene.2011.10.042
1 2 Yambazi Banda (2015). "Characterizing Race/Ethnicity and Genetic Ancestry for 100,000 Subjects in the Genetic Epidemiology Research on Adult Health and Aging (GERA) Cohort". Genetics. 200 (4): 1285–1295. doi:10.1534/genetics.115.178616. PMC4574246. PMID26092716. Subsection: (Discussion) "For the non-Hispanic white individuals, we see a broad spectrum of genetic ancestry ranging from northern Europe to southern Europe and the Middle East. Within that large group, with the exception of Ashkenazi Jews, we see little evidence of distinct clusters. This is consistent with considerable exogamy within this group. By comparison, we do see structure in the East Asian population, correlated with nationality, reflecting continuing endogamy for these nationalities and also recent immigration. On the other hand, we did observe a substantial number of individuals who are admixed between East Asian and European ancestry, reflecting ~10% of all those reporting East Asian race/ethnicity. The majority of these reflected individuals with one East Asian and one European parent or one East Asian and three European grandparents. In addition, we noted that for self-reported Filipinos, a substantial proportion have modest levels of European genetic ancestry reflecting older admixture."
↑ Delfin, Frederick; Ko, Albert Min-Shan; Li, Mingkun; Gunnarsdóttir, Ellen D.; Tabbada, Kristina A.; Salvador, Jazelyn M.; Calacal, Gayvelline C.; Sagum, Minerva S.; Datar, Francisco A.; Padilla, Sabino G.; De Ungria, Maria Corazon A.; Stoneking, Mark (February 2014). "Complete mtDNA genomes of Filipino ethnolinguistic groups: a melting pot of recent and ancient lineages in the Asia-Pacific regio". European Journal of Human Genetics. 22 (2): 228–237. doi:10.1038/ejhg.2013.122. PMC3895641. PMID23756438. Indian influence and possibly haplogroups M52'58 and M52a were brought to the Philippines as early as the fifth century AD. However, Indian influence through these trade empires were indirect and mainly commercial; moreover, other Southeast Asian groups served as filters that diluted and/or enriched any Indian influence that reached the Philippines
↑ Kuizon, Jose G. (1962). The Sanskrit loan-words in Cebuano-Bisayan language and the Indian elements to Cebuano-Bisayan culture (Thesis). University of San Carlos, Cebu. OCLC3061923.
1 2 Go, Matthew C. (January 15, 2018). "An Admixture Approach to Trihybrid Ancestry Variation in the Philippines with Implications for Forensic Anthropology". Human Biology. 232 (3): 178. doi:10.13110/humanbiology.90.3.01. PMID33947174. Retrieved September 11, 2020. Filipinos appear considerably admixed with respect to the other Asian population samples, carrying on average less Asian ancestry (71%) than our Korean (99%), Japanese (96%), Thai (93%), and Vietnamese (84%) reference samples. We also revealed substructure in our Filipino sample, showing that the patterns of ancestry vary within the Philippines—that is, between the four differently sourced Filipino samples. Mean estimates of Asian (76%) and European (7%) ancestry are greatest for the cemetery sample of forensic significance from Manila.
1 2 An Inter-University Study published in the Journal of Forensic Anthropology concluded that the bodies curated by the University of the Philippines, representing the country, showed the percentage of the population that's phenotypically classified as Hispanic is 12.7%, while that of Indigenous American is 7.3%. Thus totaling to 20% of the sample representative of the Philippines, are Latino in physical appearance. Dudzik, Beatrix; Go, Matthew C. (2019-01-01). "Classification Trends Among Modern Filipino Crania Using Fordisc 3.1". Human Biology. 2 (4). University of Florida Press: 1–11. doi:10.5744/fa.2019.1005. Archived from the original on January 7, 2021. Retrieved September 13, 2020. [Page 1] ABSTRACT: Filipinos represent a significant contemporary demographic group globally, yet they are underrepresented in the forensic anthropological literature. Given the complex population history of the Philippines, it is important to ensure that traditional methods for assessing the biological profile are appropriate when applied to these peoples. Here we analyze the classification trends of a modern Filipino sample (n = 110) when using the Fordisc 3.1 (FD3) software. We hypothesize that Filipinos represent an admixed population drawn largely from Asian and marginally from European parental gene pools, such that FD3 will classify these individuals morphometrically into reference samples that reflect a range of European admixture, in quantities from small to large. Our results show the greatest classification into Asian reference groups (72.7%), followed by Hispanic (12.7%), Indigenous American (7.3%), African (4.5%), and European (2.7%) groups included in FD3. This general pattern did not change between males and females. Moreover, replacing the raw craniometric values with their shape variables did not significantly alter the trends already observed. These classification trends for Filipino crania provide useful information for casework interpretation in forensic laboratory practice. Our findings can help biological anthropologists to better understand the evolutionary, population historical, and statistical reasons for FD3-generated classifications. The results of our studyindicate that ancestry estimation in forensic anthropology would benefit from population-focused research that gives consideration to histories of colonialism and periods of admixture.
This page is based on this Wikipedia article Text is available under the CC BY-SA 4.0 license; additional terms may apply. Images, videos and audio are available under their respective licenses.