List of U.S. states by incarceration and correctional supervision rate

Last updated

This article has lists of U.S. states by adult incarceration and correctional supervision rates according to United States Department of Justice figures. The state incarceration numbers include sentenced and unsentenced inmates in jails and state prisons, but not persons in federal prisons. They are listed separately. The state numbers also do not include youth held in juvenile detention.

United States Department of Justice U.S. federal executive department in charge of law enforcement

The United States Department of Justice (DOJ), also known as the Justice Department, is a federal executive department of the U.S. government, responsible for the enforcement of the law and administration of justice in the United States, equivalent to the justice or interior ministries of other countries. The department was formed in 1870 during the Ulysses S. Grant administration.

Youth incarceration in the United States

The United States incarcerates more of its youth than any other country in the world through the juvenile courts and the adult criminal justice system, which reflects the larger trends in incarceration practices in the United States. In 2010, approximately 70,800 juveniles were incarcerated in youth detention facilities alone. Approximately 500,000 youth are brought to detention centers in a given year. This data does not reflect juveniles tried as adults. Around 40% are incarcerated in privatized, for-profit facilities.

Contents

Imprisonment rate of sentenced prisoners under jurisdiction of state correctional authorities per 100,000 U.S. residents, age 18 or older. Does not include prisoners who have not been convicted or sentenced. Does not include jail inmates whether convicted or not. Does not include federal prisoners. US Incarceration Rate per 100,000 Inhabitants by State.png
Imprisonment rate of sentenced prisoners under jurisdiction of state correctional authorities per 100,000 U.S. residents, age 18 or older. Does not include prisoners who have not been convicted or sentenced. Does not include jail inmates whether convicted or not. Does not include federal prisoners.

Incarceration rate by state

U.S. states by incarceration rate under state prison or local jail jurisdiction per 100,000 population. [1] Rates are for yearend 2016. The table below has all 50 states and the District of Columbia.

U.S. state constituent political entity of the United States

In the United States, a state is a constituent political entity, of which there are currently 50. Bound together in a political union, each state holds governmental jurisdiction over a separate and defined geographic territory and shares its sovereignty with the federal government. Due to this shared sovereignty, Americans are citizens both of the federal republic and of the state in which they reside. State citizenship and residency are flexible, and no government approval is required to move between states, except for persons restricted by certain types of court orders. Four states use the term commonwealth rather than state in their full official names.

Note: The rate columns can be sorted Sort both small.svg in ascending or descending order. Sort the column with the state names to return to alphabetical order.
Note: There are 2 state incarceration rate columns: One per 100,000 adults, and one per 100,000 of all ages. [1]
Note: State and federal rows add up to US total row. Federal prison inmates are not included in the state rates.
Row numbers: The row number column on the left does not sort, and remains static.


1
2
3
4
5
6
7
8
9
10
11
12
13
14
15
16
17
18
19
20
21
22
23
24
25
26
27
28
29
30
31
32
33
34
35
36
37
38
39
40
41
42
43
44
45
46
47
48
49
50
51
Incarceration rate by state. [1]
JurisdictionYearend
2016. In
prison
or jail
2016
rate per
100,000
adults
2016
rate per
100,000
of all ages
US total2,131,000850660
Federal188,4008060
States, and
District of Columbia
1,942,600780600
Flag of Alabama.svg  Alabama 40,9001,080840
Flag of Alaska.svg  Alaska 4,400800600
Flag of Arizona.svg  Arizona 55,0001,030790
Flag of Arkansas.svg  Arkansas 24,0001,050800
Flag of California.svg  California 202,700670510
Flag of Colorado.svg  Colorado 32,100740580
Flag of Connecticut.svg  Connecticut 15,000530420
Flag of Delaware.svg  Delaware 6,600880690
Flag of Washington, D.C..svg  District of Columbia 1,800320270
Flag of Florida.svg  Florida 149,800900720
Flag of Georgia (U.S. state).svg  Georgia 91,4001,160880
Flag of Hawaii.svg  Hawaii 5,600500390
Flag of Idaho.svg  Idaho 11,300900670
Flag of Illinois.svg  Illinois 60,800620480
Flag of Indiana.svg  Indiana 43,200850650
Flag of Iowa.svg  Iowa 13,400560430
Flag of Kansas.svg  Kansas 17,200780590
Flag of Kentucky.svg  Kentucky 34,7001,010780
Flag of Louisiana.svg  Louisiana 45,4001,270970
Flag of Maine.svg  Maine 4,100380300
Flag of Maryland.svg  Maryland 28,400610470
Flag of Massachusetts.svg  Massachusetts 19,400360280
Flag of Michigan.svg  Michigan 56,500730570
Flag of Minnesota.svg  Minnesota 16,300380290
Flag of Mississippi.svg  Mississippi 28,7001,260960
Flag of Missouri.svg  Missouri 44,300940730
Flag of Montana.svg  Montana 5,700700550
Flag of Nebraska.svg  Nebraska 8,800610460
Flag of Nevada.svg  Nevada 20,200890680
Flag of New Hampshire.svg  New Hampshire 4,500410330
Flag of New Jersey.svg  New Jersey 32,000460360
Flag of New Mexico.svg  New Mexico 14,700930710
Flag of New York.svg  New York 74,400480380
Flag of North Carolina.svg  North Carolina 54,100680530
Flag of North Dakota.svg   North Dakota 3,100540410
Flag of Ohio.svg  Ohio 71,000790610
Flag of Oklahoma.svg  Oklahoma 39,0001,310990
Flag of Oregon.svg  Oregon 20,700640500
Flag of Pennsylvania.svg  Pennsylvania 82,400810640
Flag of Rhode Island.svg  Rhode Island 3,100370290
Flag of South Carolina.svg  South Carolina 32,100820640
Flag of South Dakota.svg  South Dakota 5,800880670
Flag of Tennessee.svg  Tennessee 48,400930720
Flag of Texas.svg  Texas 218,5001,050780
Flag of Utah.svg  Utah 11,700540380
Flag of Vermont.svg  Vermont 1,700340280
Flag of Virginia.svg  Virginia 57,500880680
Flag of Washington.svg  Washington 30,400530410
Flag of West Virginia.svg  West Virginia 10,100690550
Flag of Wisconsin.svg  Wisconsin 35,600790620
Flag of Wyoming.svg  Wyoming 3,900870660

Comparison with other countries

The US incarceration rate peaked in 2008. The US rate was the highest in the world in 2008. Chart is for prisoners per 100,000 population of all ages. World prison population 2008.svg
The US incarceration rate peaked in 2008. The US rate was the highest in the world in 2008. Chart is for prisoners per 100,000 population of all ages.

According to the World Prison Brief the United States currently has the largest prison population in the world, and the highest incarceration rate. [3] [4] [5] [6]

The World Prison Brief at PrisonStudies.org is an online database providing free access to information on prison systems around the world. It is now hosted by the Institute For Criminal Policy Research (ICPR), Birkbeck College, University of London.

On January 1, 2008 more than 1 in 100 adults in the United States were in prison or jail. [7] [8] Total US incarceration peaked in 2008. [1]

In addition to the overall highest incarceration rate, the United States also has the highest rate of female incarceration. According to a November 2017 report by the World Prison Brief around 212,000 of the 714,000 female prisoners worldwide (women and girls) are incarcerated in the United States. [9] In the United States in 2015, women made up 10.4% of the incarcerated population in adult prisons and jails. [10] In most countries, the proportion of female inmates to the larger prison population is closer to one in twenty. Australia is the exception where the rate of female imprisonment increased from 9.2 percent in 1991 to 15.3 percent in 1999. [11]

Incarceration of women in the United States

This article discusses the incarceration of women in prisons and jails within the United States. According to a November 2018 report by the Prison Policy Initiative, 219,000 women are incarcerated in the United States. A 2017 report by the World Prison Brief states: "The highest female prison population rates are in the U.S.A., Thailand (60.7), El Salvador (58.4), Turkmenistan, Seychelles (34.8), Russian Federation (33.5), French Guiana (32.4), Macau-China (31.3), Rwanda (29.6), Greenland (28.5) and American Samoa (27.3)."

Comparing other English-speaking developed countries, [3] whereas the incarceration rate in the US is 660 per 100,000 population of all ages (as of 2016 table above), [1] the incarceration rate of Canada is 114 per 100,000 (as of 2015), [12] England and Wales is 146 per 100,000 (as of 2016), [13] and Australia is 160 per 100,000 (as of 2016). [14] Comparing other developed countries, the rate of Spain is 133 per 100,000 (as of 2016), [15] France is 110 per 100,000 (as of 2016), [16] Germany is 76 per 100,000 (as of 2016), [17] Norway is 73 per 100,000 (as of 2016), [18] Netherlands is 69 per 100,000 (as of 2014), [19] and Japan is 48 per 100,000 (as of 2014). [20]

Canada Country in North America

Canada is a country in the northern part of North America. Its ten provinces and three territories extend from the Atlantic to the Pacific and northward into the Arctic Ocean, covering 9.98 million square kilometres, making it the world's second-largest country by total area. Canada's southern border with the United States is the world's longest bi-national land border. Its capital is Ottawa, and its three largest metropolitan areas are Toronto, Montreal, and Vancouver. As a whole, Canada is sparsely populated, the majority of its land area being dominated by forest and tundra. Consequently, its population is highly urbanized, with over 80 percent of its inhabitants concentrated in large and medium-sized cities, many near the southern border. Canada's climate varies widely across its vast area, ranging from arctic weather in the north, to hot summers in the southern regions, with four distinct seasons.

England and Wales Administrative jurisdiction within the United Kingdom

England and Wales is a legal jurisdiction covering England and Wales, two of the four nations of the United Kingdom. "England and Wales" forms the constitutional successor to the former Kingdom of England and follows a single legal system, known as English law.

Australia Country in Oceania

Australia, officially the Commonwealth of Australia, is a sovereign country comprising the mainland of the Australian continent, the island of Tasmania and numerous smaller islands. It is the largest country in Oceania and the world's sixth-largest country by total area. The neighbouring countries are Papua New Guinea, Indonesia and East Timor to the north; the Solomon Islands and Vanuatu to the north-east; and New Zealand to the south-east. The population of 25 million is highly urbanised and heavily concentrated on the eastern seaboard. Australia's capital is Canberra, and its largest city is Sydney. The country's other major metropolitan areas are Melbourne, Brisbane, Perth and Adelaide.

In addition, the United States has striking statistics when observing the racial dimension of mass incarceration. According to Michelle Alexander, the United States "imprisons a larger percentage of its black population than South Africa did at the height of apartheid." [21]

Correctional supervision rates by state

Chart below has numbers for people in adult facilities, and for people on probation and on parole. [1] The incarceration numbers in the main part of the chart below are for sentenced and unsentenced inmates in adult facilities in local jails and state prisons, but not for people in federal prisons.

The bottom of the chart has totals and average rates for each column.

Federal prison numbers are added at the end of the chart. So the total number (local, state, and federal) under adult correctional supervision is 6,582,100. That is a correctional supervision rate of 2,630 per 100,000 U.S. adult residents. That rounds off to 2.6% of US adult residents.

Correctional supervision rates by state, 2016. [1]
JurisdictionTotalCommunity supervisionIncarcerated
Total,
12/31/2016
Rate per 100,000
adults
Probation or Parole,
12/31/2016
Rate per 100,000
adults
In prison or jail,
12/31/2016
Rate per 100,000
adults

Alabama99,8002,64060,7001,61040,9001,080
Alaska12,9002,3208,4001,5204,400800
Arizona137,5002,57084,8001,59055,0001,030
Arkansas72,1003,15051,5002,25024,0001,050
California536,1001,770333,3001,100202,700670
Colorado121,9002,82090,9002,11032,100740
Connecticut59,6002,11044,7001,58015,000530
Delaware22,4002,98015,8002,1006,600880
District of Columbia10,4001,8409,6001,7101,800320
Florida366,0002,200218,6001,320149,800900
Georgia........91,4001,160
Hawaii27,5002,45021,9001,9505,600500
Idaho48,8003,88037,5002,98011,300900
Illinois204,2002,070143,4001,45060,800620
Indiana159,9003,150116,7002,30043,200850
Iowa46,7001,94035,1001,46013,400560
Kansas38,5001,75021,50098017,200780
Kentucky97,9002,85063,8001,86034,7001,010
Louisiana111,0003,11071,0001,98045,4001,270
Maine10,3009606,8006304,100380
Maryland99,0002,12082,8001,77028,400610
Massachusetts82,9001,52063,6001,17019,400360
Michigan........56,500730
Minnesota119,5002,810103,9002,45016,300380
Mississippi65,3002,88037,7001,66028,7001,260
Missouri105,9002,24061,6001,30044,300940
Montana15,2001,86010,2001,2505,700700
Nebraska23,3001,62014,6001,0108,800610
Nevada39,2001,72019,00083020,200890
New Hampshire10,8001,0106,4005904,500410
New Jersey186,3002,670155,7002,23032,000460
New Mexico30,2001,90015,50097014,700930
New York212,1001,360142,40091074,400480
North Carolina149,3001,89095,2001,21054,100680
North Dakota10,3001,7707,1001,2303,100540
Ohio326,2003,620256,4002,84071,000790
Oklahoma74,5002,51035,5001,19039,0001,310
Oregon82,0002,52061,4001,89020,700640
Pennsylvania368,1003,640291,6002,88082,400810
Rhode Island24,3002,85023,2002,7303,100370
South Carolina68,8001,77036,70094032,100820
South Dakota15,0002,2909,3001,4205,800880
Tennessee119,4002,31074,7001,44048,400930
Texas681,9003,290482,9002,330218,5001,050
Utah25,4001,18015,90074011,700540
Vermont7,4001,4505,8001,1501,700340
Virginia120,0001,83062,50095057,500880
Washington127,0002,230100,6001,76030,400530
West Virginia20,1001,38010,10069010,100690
Wisconsin100,5002,23064,9001,44035,600790
Wyoming9,4002,1005,5001,2303,900870
State
or federal district
6,262,0002,5004,405,4001,7601,942,600780
Federal320,000130131,70050188,40080
U.S. total6,582,1002,6304,537,1001,8102,131,000850

Male and female incarceration and correctional supervision numbers

Number and rate of persons supervised by U.S. adult correctional systems, by sex and correctional status, 2015. [22]
Community supervision (parole, probation, etc.)Incarcerated
NumberRate per 100,000 U.S. residents of all agesNumberRate per 100,000 U.S. residents of all ages
JurisdictionTotalMaleFemaleMaleFemaleTotalMaleFemaleMaleFemale
U.S. total4,650,9003,594,3001,056,7002,2606402,145,1001,942,500202,6001,600160
Federal132,800109,20023,7007010195,700182,80012,90015010
State
or federal district
4,518,1003,485,1001,033,0002,1906301,949,4001,759,700189,8001,450150

Alabama64,60050,60014,0002,14056042,90038,6004,3001,640170
Alaska8,5006,6001,9001,7005505,4004,8006001,230170
Arizona83,30066,70016,7001,95048054,90049,1005,8001,440170
Arkansas51,50039,00012,5002,66082024,00021,2002,8001,450180
California349,600277,50072,1001,420360201,000186,00015,10095080
Colorado89,20066,70022,4002,41082031,80028,0003,8001,010140
Connecticut45,30035,7009,5002,04052015,80014,7001,10084060
Delaware16,10012,4003,7002,6907606,7006,1005001,330110
District of Columbia9,9008,5001,4002,6404001,8001,70010053030
Florida225,400167,00058,4001,670560153,000137,90015,1001,380140
Georgia451,800353,60098,2007,0601,87088,50079,6008,9001,590170
Hawaii22,50017,2005,3002,3607405,9005,200700710100
Idaho37,80028,1009,7003,3701,16010,9009,3001,6001,120190
Illinois151,300118,20033,1001,87051063,90059,5004,40094070
Indiana122,50093,10029,4002,85087043,50038,2005,2001,170160
Iowa35,60026,9008,7001,73055012,90011,5001,40074090
Kansas20,90016,4004,5001,12031016,60014,8001,8001,010130
Kentucky70,60049,40021,3002,26094033,80028,7005,1001,310230
Louisiana71,90057,40014,5002,51060049,00045,4003,6001,980150
Maine6,7005,4001,4008202004,0003,50050054070
Maryland87,40071,80015,6002,46050029,70027,8001,90095060
Massachusetts66,90052,60014,3001,59041020,10019,0001,20057030
Michigan193,900147,70046,1003,02091057,70053,1004,6001,09090
Minnesota105,10081,00024,0002,96087016,50014,8001,60054060
Mississippi44,80035,5009,3002,44060028,00025,8002,3001,770150
Missouri62,60047,60015,0001,59048043,40038,5004,9001,290160
Montana9,7007,4002,3001,4304405,6004,800800930150
Nebraska13,70010,0003,7001,0503908,6007,700900810100
Nevada19,20015,2004,0001,04027019,10016,8002,3001,150160
New Hampshire6,3004,9001,4007502104,6004,10050062080
New Jersey151,300117,70033,7002,69073033,90031,7002,20072050
New Mexico16,80012,6004,2001,21040015,10013,3001,8001,290170
New York145,600120,50025,0001,25025075,90071,1004,80074050
North Carolina97,40073,40024,0001,49046053,80048,8005,000990100
North Dakota6,9005,1001,8001,3004903,2002,700400690120
Ohio262,000189,70072,3003,3301,22070,70062,8007,9001,100130
Oklahoma33,40025,7007,7001,32039039,70034,4005,3001,770270
Oregon61,90049,60012,3002,47060021,00018,6002,400930120
Pennsylvania296,200223,50072,7003,5601,11083,90076,3007,6001,220120
Rhode Island24,40020,6003,8004,0106903,2003,10010060030
South Carolina38,50030,5008,0001,28032031,60028,9002,8001,210110
South Dakota9,8007,5002,3001,7205405,3004,6008001,050180
Tennessee75,40057,10018,3001,77054048,00041,6006,5001,290190
Texas488,800375,200113,6002,730810214,800192,50022,3001400160
Utah15,70012,0003,70079024011,70010,1001,600660110
Vermont6,3004,8001,5001,5504701,8001,60020052050
Virginia57,00043,70013,3001,06031057,30051,0006,3001,230150
Washington104,70081,60023,2002,26064029,70026,3003,40073090
West Virginia10,1007,3002,80080030010,1008,7001,400950150
Wisconsin65,60052,70012,9001,83044035,00031,8003,1001,110110
Wyoming5,9004,3001,6001,4505503,9003,4006001,130200

Juvenile detention

Juvenile detention totals from the Office of Juvenile Justice and Delinquency Prevention. Total juvenile detention chart for the USA.gif
Juvenile detention totals from the Office of Juvenile Justice and Delinquency Prevention.

See also

Related Research Articles

West Virginia Division of Corrections and Rehabilitation

The West Virginia Division of Corrections and Rehabilitation is an agency of the U.S. state of West Virginia within the Department of Military Affairs and Public Safety that operates the state's prisons, jails and juvenile detention facilities. The agency has its headquarters in the state's capital of Charleston. Until July 1, 2018, the agency was simply the "West Virginia Division of Corrections" and only operated the adult prisons. On July 1, 2018 the agency absorbed the former West Virginia Division of Juvenile Services and the former West Virginia Regional Jail Authority and assumed its current name.

Incarceration in the United States Form of punishment in United States law

Incarceration in the United States is one of the main forms of punishment and rehabilitation for the commission of felony and other offenses. The United States has the largest prison population in the world, and the highest per-capita incarceration rate. In 2016 in the US, there were 655 people incarcerated per 100,000 population. This is the US incarceration rate for adults or people tried as adults. In 2016, 2.2 million Americans have been incarcerated, which means for every 100,000 there are 655 that are currently inmates. This costs the United States government $80 billion dollars a year.

Recidivism person repeating an undesirable behavior following punishment

Recidivism is the act of a person repeating an undesirable behavior after they have either experienced negative consequences of that behavior, or have been trained to extinguish that behavior. It is also used to refer to the percentage of former prisoners who are rearrested for a similar offense.

Federal Bureau of Prisons Corrections agency of the US federal government

The Federal Bureau of Prisons (BOP) is the United States Correctional enforcement agency that is responsible for the custody, control, and care of individuals incarcerated in the federal prison system of the United States. It is also responsible for carrying out all judicially ordered federal civilian executions. US federal prisons hold 183,000 inmates, as of 2018. They have been officially declared overcrowded, with clear implications for safety and security.

Prison rape commonly refers to the rape of inmates in prison by other inmates or prison staff. In 2001, Human Rights Watch estimated that at least 140,000 inmates had been raped while incarcerated in the United States. A United States Department of Justice report, Sexual Victimization in Prisons and Jails Reported by Inmates, states that "In 2011–12, an estimated 4.0% of state and federal prison inmates and 3.2% of jail inmates reported experiencing one or more incidents of sexual victimization by another inmate or facility staff in the past 12 months or since admission to the facility, if less than 12 months." However, advocates dispute the accuracy of the numbers, saying they seem to under-report the real numbers of sexual assaults in prison, especially among juveniles.

The Indiana Women's Prison was established in 1873 as the first adult female correctional facility in the country. The original location of the prison was one mile (1.6 km) east of downtown Indianapolis. It has since moved to 2596 Girls School Road, former location of the Indianapolis Juvenile Correctional Facility. As of 2005 it had an average daily population of 420 inmates, most of whom are members of special-needs populations, such as geriatric, mentally ill, pregnant, and juveniles sentenced as adults. By the end of 2015 the population increased to 599 inmates. Security levels range from medium to maximum. The prison holds Indiana's only death row for women; however, it currently has no death row inmates. The one woman under an Indiana death sentence, Debra Denise Brown, is being held in Ohio.

Maine Department of Corrections

The Maine Department of Corrections is a state agency of Maine that is responsible for the direction and general administrative supervision, guidance and planning of both adult and juvenile correctional facilities and programs within the state. The agency has its headquarters in Augusta. As of January 2016, the Maine DOC had 2,223 inmates in its custody.

Race in the United States criminal justice system

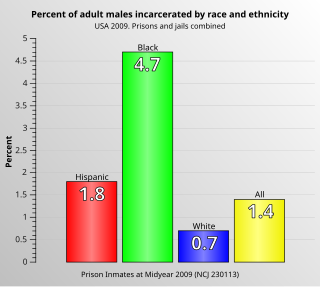
Race in the United States criminal justice system refers to the unique experiences and disparities in the United States in regard to the policing and prosecuting of various races. There have been different outcomes for different racial groups in convicting and sentencing felons in the United States criminal justice system. Experts and analysts have debated the relative importance of different factors that have led to these disparities. Minority defendants are charged with crimes requiring a mandatory minimum prison sentence more often, in both relative and absolute terms, leading to large racial disparities in correctional facilities.

United States incarceration rate about 22% of the worlds prisoners but 4.4% of the worlds population

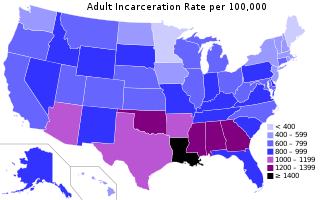
In September 2013, the incarceration rate of the United States of America was the highest in the world, at 716 per 100,000 of the national population. While the United States represents about 4.4 percent of the world's population, it houses around 22 percent of the world's prisoners. Corrections cost around $74 billion in 2007 according to the U.S. Bureau of Justice Statistics.

Prisons in California

The California State Prison System is administered by the California Department of Corrections and Rehabilitation Division of Adult Institutions, which had 136,000 inmates as of 2014. The state of California also relies on private and leased prisons. The number of California prisoners in private out of state facilities is around 8,763 and 4,170 are housed in leased facilities within the state. The Corrections Corporation of America leases the California City Correctional Center. The GEO Group is another private owner of facilities in California, such as the Golden State Modified Community Correctional Facility.

Wisconsin Department of Corrections

The Wisconsin Department of Corrections is an administrative department in the executive branch of the state of Wisconsin responsible for corrections in Wisconsin, including state prisons. As of June, 2018, the department is administered by Secretary Cathy Jess. The DOC secretary is a cabinet member appointed by the Governor of Wisconsin and confirmed by the Wisconsin Senate. Divisions of the Wisconsin Department of Corrections include: the Division of Juvenile Corrections, the Division of Adult Institutions, the Division of Community Corrections and Division of Management Services. It has its headquarters in Madison.

Louisiana Department of Public Safety & Corrections

The Department of Public Safety and Corrections (DPS&C) is a state agency of Louisiana, headquartered in Baton Rouge. The agency comprises two major areas: Public Safety Services and Corrections Services. The Secretary, who is appointed by the Governor, serves as the department's chief executive officer. The Corrections Services Deputy Secretary, Undersecretary, and Assistant Secretaries for the Office of Adult Services and the Office of Youth Development report directly to the Secretary. Headquarters Administration consists of centralized Divisions that support the management and operations of the adult and juvenile institutions, adult and juvenile probation and parole district offices, and all other services provided by the department.

Prison place in which people legally are physically confined and usually deprived of a range of personal freedoms

A prison, also known as a correctional facility, jail, gaol, penitentiary, detention center, remand center, or internment facility, is a facility in which inmates are forcibly confined and denied a variety of freedoms under the authority of the state. Prisons are most commonly used within a criminal justice system: people charged with crimes may be imprisoned until their trial; those pleading or being found guilty of crimes at trial may be sentenced to a specified period of imprisonment. In simplest terms, a prison can also be described as a building in which people are legally held as a punishment for a crime they have committed.

Prison overcrowding is a social phenomenon occurring when the demand for space in prisons in a jurisdiction exceeds the capacity for prisoners in the place.

Infectious diseases within American correctional settings are a concern within the public health sector. The corrections population is susceptible to infectious diseases through, exposure to blood and other bodily fluids, drug injection, poor health care, prison overcrowding, demographics, security issues, lack of community support for rehabilitation programs, and high-risk behaviors. The spread of infectious diseases, such as HIV/AIDS and other sexually transmitted diseases, hepatitis C (HCV), hepatitis B (HBV), and tuberculosis result largely from needle-sharing, drug use, and consensual and nonconsensual sex among prisoners. HIV/AIDS and hepatitis C need specific attention because of the specific public health concerns and issues they raise.

Incarceration prevention in the United States

Incarceration prevention refers to a variety of methods aimed at reducing prison populations and costs while fostering enhanced social structures. Due to the nature of incarceration in the United States today caused by issues leading to increased incarceration rates, there are methods aimed at preventing the incarceration of at-risk populations.

Comparison of United States incarceration rate with other countries

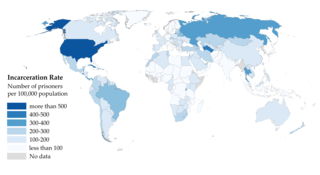
The United States has the highest prison and jail population, and the highest incarceration rate in the world. According to the World Prison Population List there were around 10.35 million people in penal institutions worldwide in 2015. The US had 2,173,800 prisoners in adult facilities in 2015. That means the US held 21.0% of the world's prisoners in 2015, even though the US represented only around 4.4 percent of the world's population in 2015.

The Department of Corrections is an agency of the Thai Ministry of Justice. Its mission is to keep prisoners in custody and rehabilitate them. Its headquarters is in Suanyai Sub-district, Mueang Nonthaburi District, Nonthaburi Province. As of 2018, Police Colonel Narat Sawatanan is director-general of the department.

References

  1. 1 2 3 4 5 6 7 8 Correctional Populations in the United States, 2016 (NCJ 251211). Published April 2018 by U.S. Bureau of Justice Statistics (BJS). By Danielle Kaeble and Mary Cowhig, BJS statisticians. See PDF. Appendix table 1 on page 11 has rates and counts by state. See page 1 "highlights" section for the "1 in ..." numbers. See table 4 on page 4 for a timeline of nationwide incarceration rates. See appendix table 3 on page 13, for "Persons held in custody in state or federal prisons or in local jails, 2000, 2010, and 2015–2016". That table also has incarceration rates. See appendix table 2 on page 12 for the number or persons incarcerated in territorial prisons, military facilities, and jails in Indian country.
  2. Walmsley, Roy (30 Jan 2009). World Prison Population List (8th Edition). From World Prison Population Lists. By World Prison Brief. "The information is the latest available in early December 2008. … Most figures relate to dates between the beginning of 2006 and the end of November 2008." According to the summary on page one there were 2.29 million U.S. inmates and 9.8 million inmates worldwide. The U.S. held 23.4% of the world's inmates. The U.S. total in this report is for December 31, 2007 (see page 3), and does not include inmates in juvenile detention facilities.
  3. 1 2 Highest to Lowest. World Prison Brief (WPB). Use dropdown menu to choose lists of countries by region, or the whole world. Use menu to select highest-to-lowest lists of prison population totals, prison population rates, percentage of pre-trial detainees / remand prisoners, percentage of female prisoners, percentage of foreign prisoners, and occupancy rate. Column headings in WPB tables can be clicked to reorder columns lowest to highest, or alphabetically. For detailed information for each country click on any country name in lists. See also the WPB main data page and click on the map links and/or the sidebar links to get to the region and country desired.
  4. United States of America. By World Prison Brief.
  5. Mahapatra, Lisa (19 March 2014). Incarcerated In America: Why Are So Many People In US Prisons? (CHARTS). International Business Times. Chart showing incarceration rates of 50 most populous countries. Another chart showing what the inmates in the USA are in for (does not indicate reasons for probation and parole violations. Those offenses, such as drug tests, etc. change the breakdown of what inmates are in for).
  6. National Research Council. The Growth of Incarceration in the United States: Exploring Causes and Consequences. Washington, DC: The National Academies Press, 2014. Retrieved May 10, 2014: "The U.S. penal population of 2.2 million adults is by far the largest in the world. Just under one-quarter of the world's prisoners are held in American prisons."
  7. One in 100: Behind Bars in America 2008. February 28, 2008. The Pew Center on the States.
  8. Liptak, Adam (28 Feb 2008). 1 in 100 U.S. Adults Behind Bars, New Study Says. New York Times .
  9. World Female Imprisonment List (fourth edition). Nov. 9, 2017. World Prison Brief.
  10. Correctional Populations in the United States, 2015. By Danielle Kaeble and Lauren Glaze, BJS Statisticians. Dec. 2016. Bureau of Justice Statistics. See PDF. Appendix table 3 on page 15 says there are 1,942,500 male and 202,600 female inmates in prisons and jails. That is 10.4% female.
  11. Carlen, Pat (2004). Analysing Women's Imprisonment. Portland: Willan Publishing. p. 42.
  12. Canada. World Prison Brief.
  13. United Kingdom: England & Wales. World Prison Brief.
  14. Australia. World Prison Brief.
  15. Spain. World Prison Brief.
  16. France. World Prison Brief.
  17. Germany. World Prison Brief.
  18. Norway. World Prison Brief.
  19. Netherlands. World Prison Brief.
  20. Japan. World Prison Brief.
  21. Alexander, Michelle (2010). The New Jim Crow: Mass Incarceration in the Age of Colorblindness. New York: The New Press. p. 7.
  22. Correctional Populations in the United States, 2015. By Danielle Kaeble and Lauren Glaze, BJS Statisticians. Dec. 2016. Bureau of Justice Statistics. See PDF. Appendix table 3 on page 14 has male and female counts and rates by state. It says there are 1,942,500 male and 202,600 female inmates in prisons and jails. That is 10.4% female.
  23. Sickmund, M., Sladky, T.J., Kang, W., & Puzzanchera, C.. "Easy Access to the Census of Juveniles in Residential Placement". Click "National Crosstabs" at the top, and then choose the census years. Click "Show table" to get the total number of juvenile inmates for those years. Or go here for all the years. Office of Juvenile Justice and Delinquency Prevention.