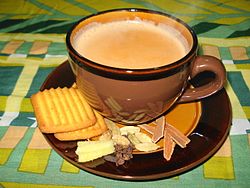
 Masala chai from the Indian subcontinent
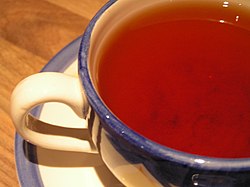 A cup of Earl Grey tea
 Tea kettle over hot coals
 Chai-o Nabat (Persian tea with rock sugar) in Tehran
 A Moroccan tea set
 A glass of iced tea
 First flush Darjeeling tea in cup
 A cup of Japanese hojicha
 Mint tea in Isfahan
 Tea in Azerbaijani armudu (pear-shaped) glass


This is a list of countries ordered by annual per capita consumption of tea, as of 2016 [update] . [2]
Contents
| Rank | Country/region | Tea consumption |
|---|---|---|
| 1 | 3.16 kg (6.96 lb) | |
| 2 | 2.36 kg (5.21 lb) | |
| 3 | 2.10 kg (4.63 lb) | |
| 4 | 1.82 kg (4.01 lb) | |
| 5 | 1.50 kg (3.30 lb) | |
| 6 | 1.50 kg (3.30 lb) | |
| 7 | 1.38 kg (3.05 lb) | |
| 8 | 1.22 kg (2.68 lb) | |
| 9 | 1.19 kg (2.63 lb) | |
| 10 | 1.19 kg (2.62 lb) | |
| 11 | 1.01 kg (2.23 lb) | |
| 12 | 1.00 kg (2.20 lb) | |
| 13 | 0.97 kg (2.13 lb) | |
| 14 | 0.90 kg (1.98 lb) | |
| 15 | 0.81 kg (1.79 lb) | |
| 16 | 0.78 kg (1.72 lb) | |
| 17 | 0.75 kg (1.65 lb) | |
| 18 | 0.72 kg (1.59 lb) | |
| 19 | 0.69 kg (1.52 lb) | |
| 20 | 0.65 kg (1.43 lb) | |
| 21 | 0.58 kg (1.28 lb) | |
| 22 | 0.57 kg (1.25 lb) | |
| 23 | 0.51 kg (1.12 lb) | |
| 24 | 0.48 kg (1.06 lb) | |
| 25 | 0.46 kg (1.01 lb) | |
| 26 | 0.44 kg (0.97 lb) | |
| 27 | 0.42 kg (0.93 lb) | |
| 28 | 0.37 kg (0.81 lb) | |
| 29 | 0.36 kg (0.80 lb) | |
| 30 | 0.33 kg (0.72 lb) | |
| 31 | 0.29 kg (0.65 lb) | |
| 32 | 0.29 kg (0.64 lb) | |
| 33 | 0.28 kg (0.62 lb) | |
| 34 | 0.27 kg (0.60 lb) | |
| 35 | 0.27 kg (0.59 lb) | |
| 36 | 0.24 kg (0.54 lb) | |
| 37 | 0.23 kg (0.50 lb) | |
| 38 | 0.21 kg (0.47 lb) | |
| 39 | 0.20 kg (0.45 lb) | |
| 40 | 0.20 kg (0.44 lb) | |
| 41 | 0.20 kg (0.44 lb) | |
| 42 | 0.17 kg (0.37 lb) | |
| 43 | 0.15 kg (0.32 lb) | |
| 44 | 0.15 kg (0.32 lb) | |
| 45 | 0.14 kg (0.31 lb) | |
| 46 | 0.13 kg (0.28 lb) | |
| 47 | 0.11 kg (0.24 lb) | |
| 48 | 0.073 kg (0.16 lb) | |
| 49 | 0.064 kg (0.14 lb) | |
| 50 | 0.050 kg (0.11 lb) | |
| 51 | 0.027 kg (0.06 lb) | |
| 52 | 0.023 kg (0.05 lb) | |
| 53 | 0.023 kg (0.05 lb) | |
| 54 | 0.023 kg (0.05 lb) | |
| 55 | 0.018 kg (0.04 lb) |


