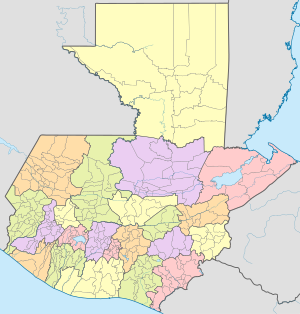
The departments of the Republic of Guatemala are divided into 340 municipalities (Spanish : municipios ). [1] [2] The municipalities are listed below, by department. Department capitals are written in bold.
The departments of the Republic of Guatemala are divided into 340 municipalities (Spanish : municipios ). [1] [2] The municipalities are listed below, by department. Department capitals are written in bold.
| N. | Municipalities | Area (km2) | Population (2018) | Density |
|---|---|---|---|---|
| 1 | Chahal | 336 | 29 590 | 88.07 |
| 2 | Chisec | 1 103 | 106 084 | 62.85 |
| 3 | Cobán | 2 132 | 228 664 | 107.25 |
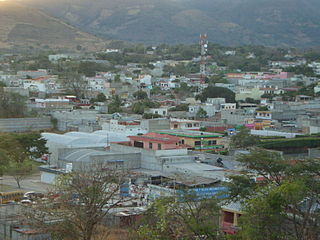
| 4 | Fray Bartolomé de las Casas | 1 135 | 77 896 | 63 38 |
| 5 | Santa Catalina la Tinta | 85 | 45 752 | 536.88 |
| 6 | Lanquín | 208 | 26 551 | 127.65 |
| 7 | Panzós | 638 | 81 063 | 127.06 |
| 8 | Raxruhá | 533 | 40 094 | 75.22 |
| 9 | San Cristóbal Verapaz | 192 | 80 613 | 419.86 |
| 10 | San Juan Chamelco | 180 | 61 634 | 342.41 |
| 11 | San Pedro Carchá | 1 082 | 255 002 | 235.68 |
| 12 | Santa Cruz Verapaz | 48 | 35 878 | 747.46 |
| 13 | Cahabón | 900 | 70 321 | 78.13 |
| 14 | Senahú | 336 | 98 703 | 293.76 |
| 15 | Tamahú | 125 | 24 444 | 195.55 |
| 16 | Tactic | 85 | 38 052 | 447.67 |
| 17 | Tucurú | 96 | 50 971 | 530.95 |
| Alta Verapaz | 8 700 | 1 351 312 | 155.28 |
| N. | Municipalities | Area (km2) | Population (2018) | Density |
|---|---|---|---|---|
| 1 | Cubulco | 444 | 60 706 | 136.73 |
| 2 | Granados | 258 | 14 585 | 58.81 |
| 3 | Purulhá | 248 | 65 340 | 253.47 |
| 4 | Rabinal | 504 | 45 000 | 89.29 |
| 5 | Salamá | 776 | 71 478 | 92.11 |
| 6 | San Jerónimo | 475 | 28 321 | 59.62 |
| 7 | San Miguel Chicaj | 300 | 36 845 | 122.82 |
| 8 | Santa Cruz el Chol | 140 | 10 445 | 74.61 |
| Baja Verapaz | 3 145 | 332 720 | 105.79 |
| N. | Municipalities | Area (km2) | Population (2018) | Density |
|---|---|---|---|---|
| 1 | Chimaltenango | 86 | 116 642 | 1356.3 |
| 2 | San José Poaquíl | 100 | 33 932 | 339.32 |
| 3 | San Martín Jilotepeque | 251 | 94 901 | 378.09 |
| 4 | San Juan Comalapa | 76 | 60 834 | 800.45 |
| 5 | Santa Apolonia | 96 | 23 751 | 247.71 |
| 6 | Tecpán Guatemala | 201 | 112 864 | 561.51 |
| 7 | Patzún | 124 | 71 790 | 578.95 |
| 8 | Pochuta | 170 | 11 239 | 428.66 |
| 9 | Patzicía | 44 | 40 848 | 928.36 |
| 10 | Santa Cruz Balanyá | 40 | 10 981 | 274.53 |
| 11 | Acatenango | 172 | 28 780 | 167.33 |
| 12 | San Pedro Yepocapa | 217 | 42 996 | 198.14 |
| 13 | San Andrés Itzapa | 83 | 35 579 | 428.66 |
| 14 | Parramos | 16 | 20 632 | 1289.5 |
| 15 | Zaragoza | 56 | 29 668 | 529.79 |
| 16 | El Tejar | 144 | 19 492 | 165.14 |
| Chimaltenango | 1 876 | 754 929 | 402.41 |
| N. | Municipalities | Area (km2) | Population (2018) | Density |
|---|---|---|---|---|
| 1 | Camotán | 232 | 61 958 | 267.06 |
| 2 | Chiquimula | 372 | 120 384 | 214.56 |
| 3 | Concepción Las Minas | 225 | 12 615 | 56.07 |
| 4 | Esquipulas | 532 | 56 253 | 118 |
| 5 | Ipala | 228 | 24 024 | 105.37 |
| 6 | Jocotán | 148 | 75 578 | 510.66 |
| 7 | Olopa | 156 | 30 534 | 195.73 |
| 8 | Quetzaltepeque | 236 | 30 136 | 30 136 |
| 9 | San Jacinto | 60 | 13 381 | 223.02 |
| 10 | San José la Arada | 160 | 9 249 | 57.81 |
| 11 | San Juan Ermita | 92 | 18 751 | 203.82 |
| El Progreso | 2 441 | 452 863 | 185.52 |
| N. | Municipalities | Area (km2) | Population (2018) | Density |
|---|---|---|---|---|
| 1 | El Jícaro | 249 | 13 518 | 54.29 |
| 2 | Guastatoya | 182 | 27 407 | 150.59 |
| 3 | Morazán | 329 | 12 672 | 38.52 |
| 4 | San Agustín Acasaguastlán | 360 | 55 508 | 154.19 |
| 5 | San Antonio La Paz | 209 | 22 493 | 107.62 |
| 6 | San Cristóbal Acasaguastlán | 124 | 7 979 | 64.35 |
| 7 | Sanarate | 273 | 42 422 | 155.39 |
| 8 | Sansare | 118 | 13 674 | 115.88 |
| El Progreso | 1 844 | 195 673 | 106.11 |
| N. | Municipalities | Area (km2) | Population (2018) | Density |
|---|---|---|---|---|
| 1 | Escuintla | 332 | 170 280 | 512.89 |
| 2 | Guanagazapa | 220 | 17 485 | 79.35 |
| 3 | Iztapa | 328 | 20 401 | |
| 4 | La Democracia | 321 | 22 884 | 71.29 |
| 5 | La Gomera | 640 | 53 211 | 83.14 |
| 6 | Masagua | 473 | 48 552 | 102.65 |
| 7 | Nueva Concepción | 555 | 82 216 | 156.88 |
| 8 | Palín | 92 | 72 203 | 784.02 |
| 9 | San José | 220 | 68 331 | 310.6 |
| 10 | San Vicente Pacaya | 236 | 18 417 | 78.04 |
| 11 | Santa Lucía Cotzumalguapa | 432 | 127 683 | 295.56 |
| 12 | Sipacate | 265 | 18 212 | 68.72 |
| 13 | Siquinalá | 184 | 26 317 | 143.03 |
| 14 | Tiquisate | 471 | 63 971 | 135.82 |
| Escuintla | 4 769 | 810 163 | 169.88 |
| N. | Municipalities | Area (km2) | Population (2018) | Density |
|---|---|---|---|---|
| 1 | Amatitlán | 204 | 152 296 | 746.55 |
| 2 | Chinautla | 80 | 124 365 | 1 554.56 |
| 3 | Chuarrancho | 98 | 17 057 | 162.45 |
| 4 | Ciudad de Guatemala | 220 | 995 363 | 4 524.37 |
| 5 | Fraijanes | 96 | 63 721 | 667.38 |
| 6 | Mixco | 132 | 517 505 | 3 920.49 |
| 7 | Palencia | 196 | 74 839 | 381.83 |
| 8 | San José del Golfo | 84 | 8 456 | 100.67 |
| 9 | San José Pinula | 220 | 89 636 | 407.45 |
| 10 | San Juan Sacatepéquez | 293 | 284 798 | 972 |
| 11 | San Miguel Petapa | 20 | 150 513 | 5 017.1 |
| 12 | San Pedro Ayampuc | 73 | 67 946 | 930.77 |
| 13 | San Pedro Sacatepéquez | 148 | 56 545 | 382.06 |
| 14 | San Raymundo | 114 | 38 891 | 341.15 |
| 15 | Santa Catarina Pinula | 50 | 87 362 | 1 747.24 |
| 16 | Villa Canales | 353 | 167 779 | 475.29 |
| 17 | Villa Nueva | 114 | 483 897 | 4 244.71 |
| Guatemala | 2 495 | 3 380 969 | 1 355.09 |
| N. | Municipalities | Area (km2) | Population (2018) | Density |
|---|---|---|---|---|
| 1 | Aguacatán | 300 | 59 638 | 198.79 |
| 2 | Chiantla | 493 | 93 780 | 190.22 |
| 3 | Colotenango | 71 | 44 823 | 631.31 |
| 4 | Concepción Huista | 136 | 21 208 | 155.94 |
| 5 | Cuilco | 592 | 67 297 | 113.68 |
| 6 | Huehuetenango | 204 | 136 639 | 669.8 |
| 7 | Jacaltenango | 212 | 44 605 | 210.4 |
| 8 | La Democracia | 136 | 61 486 | 452.1 |
| 9 | La Libertad | 104 | 49 035 | 471.49 |
| 10 | Malacatancito | 268 | 22 589 | 85.29 |
| 11 | Nentón | 787 | 51 349 | 65.25 |
| 12 | Petatán | 17 | 7 138 | 428.19 |
| 13 | San Antonio Huista | 156 | 19 311 | 123.79 |
| 14 | San Gaspar Ixchil | 31 | 10 581 | 341.32 |
| 15 | San Ildefonso Ixtahuacán | 184 | 56 511 | 307.13 |
| 16 | San Juan Atitán | 64 | 26 031 | 406.73 |
| 17 | San Juan Ixcoy | 224 | 31 081 | 138.75 |
| 18 | San Mateo Ixtatán | 560 | 60 203 | 107.51 |
| 19 | San Miguel Acatán | 152 | 36 245 | 238.45 |
| 20 | San Pedro Nécta | 119 | 41 562 | 349.26 |
| 21 | San Pedro Soloma | 264 | 64 772 | 245.35 |
| 22 | San Rafael La Independencia | 64 | 18 733 | 292.7 |
| 23 | San Rafael Pétzal | 25 | 12 786 | 551.44 |
| 24 | San Sebastián Coatán | 168 | 25 935 | 154.38 |
| 25 | San Sebastián Huehuetenango | 108 | 43 261 | 400.56 |
| 26 | Santa Ana Huista | 145 | 10 687 | 73.7 |
| 27 | Santa Bárbara | 132 | 44 809 | 339.46 |
| 28 | Santa Cruz Barillas | 1 112 | 127 991 | 115.1 |
| 29 | Santa Eulalia | 292 | 51 910 | 177.77 |
| 30 | Santiago Chimaltenango | 39 | 14 631 | 375.15 |
| 31 | Tectitán | 68 | 11 928 | 175.41 |
| 32 | Todos Santos Cuchumatán | 269 | 39 638 | 147.35 |
| 33 | Unión Cantinil | 43 | 18 367 | 427.14 |
| Huehuetenango | 7 539 | 1 426 560 | 189.22 |
| N. | Municipalities | Area (km2) | Population (2018) | Density |
|---|---|---|---|---|
| 1 | El Estor | 2 896 | 82 491 | 28.48 |
| 2 | Livingston | 1 940 | 80 249 | 41.37 |
| 3 | Los Amates | 1 615 | 65 475 | 40.54 |
| 4 | Morales | 1 295 | 107 400 | 82.93 |
| 5 | Puerto Barrios | 1 292 | 110 846 | 85.79 |
| Izabal | 9 038 | 446 461 | 49.61 |
| N. | Municipalities | Area (km2) | Population (2018) | Density |
|---|---|---|---|---|
| 1 | Jalapa | 544 | 192 676 | 354.18 |
| 2 | Mataquescuintla | 287 | 47 280 | 164.74 |
| 3 | Monjas | 256 | 31 330 | 122.38 |
| 4 | San Carlos Alzatate | 25 | 21 938 | 1 277.52 |
| 5 | San Luis Jilotepeque | 296 | 26 874 | 90.79 |
| 6 | San Manuel Chaparrón | 123 | 9 126 | 74.20 |
| 7 | San Pedro Pinula | 532 | 78 244 | 147.08 |
| Jalapa | 2 063 | 407 468 | 197.51 |
| N. | Municipalities | Area (km2) | Population (2018) | Density |
|---|---|---|---|---|
| 1 | Agua Blanca | 340 | 17 765 | 52.25 |
| 2 | Asunción Mita | 506 | 53 141 | 105.02 |
| 3 | Atescatempa | 68 | 20 033 | 294.6 |
| 4 | Comapa | 132 | 37 218 | 281.95 |
| 5 | Conguaco | 128 | 29 887 | 233.49 |
| 6 | El Adelanto | 31 | 8 394 | 270.77 |
| 7 | El Progreso | 68 | 25 689 | 257.56 |
| 8 | Jalpatagua | 204 | 31 601 | 154.91 |
| 9 | Jerez | 60 | 6 903 | 115.05 |
| 10 | Jutiapa | 620 | 167 049 | 269.43 |
| 11 | Moyuta | 380 | 50 742 | 133.43 |
| 12 | Pasaco | 308 | 11 229 | 36.46 |
| 13 | Quesada | 84 | 23 822 | 104.94 |
| 14 | San José Acatempa | 68 | 13 938 | 204.97 |
| 15 | Santa Catarina Mita | 132 | 31 709 | 240.22 |
| 16 | Yupiltepeque | 35 | 18 262 | 507.28 |
| 17 | Zapotitlán | 84 | 10 573 | 125.87 |
| Jutiapa | 3 248 | 557 955 | 171.78 |
| N. | Municipalities | Area (km2) | Population (2018) | Density |
|---|---|---|---|---|
| 1 | Dolores | 3 050 | 30 302 | 9.94 |
| 2 | El Chal | 958 | 15 555 | 16.24 |
| 3 | Flores | 4 348 | 88 000 | 20.23 |
| 4 | La Libertad | 5 272 | 86 171 | 16.35 |
| 5 | Las Cruces | 1 775 | 39 188 | 22.32 |
| 6 | Melchor de Mencos | 2 098 | 30 682 | 14.62 |
| 7 | Poptún | 1 766 | 69 437 | 39.42 |
| 8 | San Andrés | 8 874 | 35 465 | 4 |
| 9 | San Benito | 112 | 54 189 | 483.84 |
| 10 | San Francisco | 320 | 16 787 | 52.46 |
| 11 | San José | 2 252 | 7 261 | 3.22 |
| 12 | San Luis | 2 913 | 77 395 | 26.51 |
| 13 | Santa Ana | 1 008 | 24 380 | 24.19 |
| 14 | Sayaxché | 3 904 | 99 787 | 25.56 |
| Petén | 38 650 | 674 599 | 17.45 |
| N. | Municipalities | Area (km2) | Population (2018) | Density |
|---|---|---|---|---|
| 1 | Almolonga | 20 | 17 305 | 865.25 |
| 2 | Cabricán | 60 | 28 124 | 468.73 |
| 3 | Cajolá | 36 | 19 333 | 537.03 |
| 4 | Cantel | 22 | 47 087 | 2 140.32 |
| 5 | Coatepeque | 426 | 120 737 | 283.42 |
| 6 | Colomba Costa Cuca | 212 | 56 487 | 266.45 |
| 7 | Concepción Chiquirichapa | 48 | 20 920 | 435.83 |
| 8 | El Palmar | 171 | 31 706 | 185.41 |
| 9 | Flores Costa Cuca | 63 | 24 888 | 395.05 |
| 10 | Génova | 372 | 46 294 | 118.10 |
| 11 | Huitán | 16 | 14 839 | 927.44 |
| 12 | La Esperanza | 32 | 24 948 | 779.63 |
| 13 | Olintepeque | 36 | 39 383 | 1 093.97 |
| 14 | Palestina de Los Altos | 22 | 20 719 | 941.77 |
| 15 | Quetzaltenango | 120 | 204 075 | 1 700.63 |
| 16 | Salcajá | 12 | 21 577 | 1 798.08 |
| 17 | San Carlos Sija | 148 | 36 001 | 243.25 |
| 18 | San Francisco La Unión | 32 | 9 665 | 302.03 |
| 19 | San Juan Ostuncalco | 109 | 61 517 | 564.38 |
| 20 | San Martín Sacatepéquez | 100 | 33 826 | 338.26 |
| 21 | San Mateo | 20 | 8 946 | 447.30 |
| 22 | San Miguel Sigüilá | 28 | 9 869 | 352.46 |
| 23 | Sibilia | 28 | 9 071 | 323.96 |
| 24 | Zunil | 92 | 15 893 | 172.75 |
| Quetzaltenango | 2 225 | 923 910 | 415.24 |
| N. | Municipalities | Area (km2) | Population (2018) | Density |
|---|---|---|---|---|
| 1 | Canillá | 123 | 12 724 | 103.45 |
| 2 | Chajul | 715 | 52 019 | 72.75 |
| 3 | Chicamán | 516 | 43 139 | 83.60 |
| 4 | Chiché | 144 | 32 271 | 224.10 |
| 5 | Santo Tomás Chichicastenango | 400 | 150 932 | 377.33 |
| 6 | Chinique | 64 | 13 547 | 211.67 |
| 7 | Cunén | 195 | 47 250 | 242.30 |
| 8 | Ixcán | 1 693 | 109 372 | 64.60 |
| 9 | Joyabaj | 338 | 107 634 | 354.06 |
| 10 | Nebaj | 600 | 77 377 | 128.96 |
| 11 | Pachalum | 100 | 9 897 | 98.97 |
| 12 | Patzité | 64 | 7 787 | 121.67 |
| 13 | Sacapulas | 295 | 55 398 | 187.78 |
| 14 | San Andrés Sajcabajá | 446 | 27 962 | 62.70 |
| 15 | San Antonio Ilotenango | 80 | 30 864 | 385.80 |
| 16 | San Bartolomé Jocotenango | 123 | 15 777 | 128.27 |
| 17 | San Juan Cotzal | 228 | 36 298 | 159.20 |
| 18 | San Pedro Jocopilas | 578 | 37 990 | 65.73 |
| 19 | Santa Cruz del Quiché | 271 | 99 749 | 368.07 |
| 20 | Uspantán | 865 | 74 244 | 85.83 |
| 21 | Zacualpa | 336 | 40 003 | 119.06 |
| Quiché | 8 174 | 1 082 234 | 132.39 |
| N. | Municipalities | Area (km2) | Population (2018) | Density |
|---|---|---|---|---|
| 1 | Champerico | 361 | 38 570 | 106.82 |
| 2 | El Asintal | 112 | 43 281 | 386.43 |
| 3 | Nuevo San Carlos | 64 | 41 956 | 655.56 |
| 4 | Retalhuleu | 796 | 109 935 | 138.11 |
| 5 | San Andrés Villa Seca | 254 | 56 050 | 220.71 |
| 6 | San Felipe | 32 | 26 640 | 832.5 |
| 7 | San Martín Zapotitlán | 24 | 13 094 | 545.58 |
| 8 | San Sebastián | 28 | 30 724 | 1 097.29 |
| 9 | Santa Cruz Muluá | 128 | 16 138 | 126.08 |
| Retalhuleu | 1 800 | 376 388 | 209.10 |
| N. | Municipalities | Area (km2) | Population (2018) | Density |
|---|---|---|---|---|
| 1 | Alotenango | 95 | 28 129 | 296.09 |
| 2 | Ciudad Vieja | 51 | 41 010 | 804.12 |
| 3 | Jocotenango | 26 | 23 942 | 910.54 |
| 4 | Antigua Guatemala | 78 | 59 091 | 757.57 |
| 5 | Magdalena Milpas Altas | 19 | 12 766 | 671.89 |
| 6 | Pastores | 19 | 19 661 | 1 034.79 |
| 7 | San Antonio Aguas Calientes | 17 | 12 716 | 748 |
| 8 | San Bartolomé Milpas Altas | 7 | 8 642 | 1 234.57 |
| 9 | San Lucas Sacatepéquez | 25 | 28 819 | 1 176.29 |
| 10 | San Miguel Dueñas | 35 | 15 562 | 444.63 |
| 11 | Santa Catarina Barahona | 31 | 4 569 | 147.39 |
| 12 | Santa Lucía Milpas Altas | 19 | 17 422 | 916.95 |
| 13 | Santa María de Jesús | 34 | 26 769 | 787.32 |
| 14 | Santiago Sacatepéquez | 15 | 36 982 | 2 465.17 |
| 15 | Santo Domingo Xenacoj | 37 | 14 455 | 390.68 |
| 16 | Sumpango | 55 | 46 082 | 837.85 |
| Sacatepéquez | 563 | 396 617 | 704.47 |
| N. | Municipalities | Area (km2) | Population (2018) | Density |
|---|---|---|---|---|
| 1 | Ayutla | 125 | 45 401 | 363.10 |
| 2 | Catarina | 76 | 35 542 | 467.66 |
| 3 | Comitancillo | 138 | 80 612 | 584.14 |
| 4 | Concepción Tutuapa | 176 | 84 138 | 478.06 |
| 5 | El Quetzal | 88 | 25 888 | 294.18 |
| 6 | El Tumbador | 84 | 52 144 | 620.76 |
| 7 | Esquipulas Palo Gordo | 21 | 14 018 | 667.52 |
| 8 | Ixchiguán | 184 | 24 926 | 135.47 |
| 9 | La Blanca | 96 | 34 307 | 357.36 |
| 10 | La Reforma | 100 | 23 717 | 237.17 |
| 11 | Malacatán | 204 | 109 318 | 535.87 |
| 12 | Nuevo Progreso | 140 | 31 968 | 228.34 |
| 13 | Ocós | 75 | 12 776 | 170.35 |
| 14 | Pajapita | 84 | 23 171 | 275.85 |
| 15 | Río Blanco | 36 | 6 085 | 169.03 |
| 16 | San Antonio Sacatepéquez | 79 | 20 994 | 265.75 |
| 17 | San Cristóbal Cucho | 58 | 17 987 | 310.12 |
| 18 | San José El Rodeo | 81 | 19 401 | 239.52 |
| 19 | San José Ojetenam | 37 | 22 768 | 615.35 |
| 20 | San Lorenzo | 25 | 14 085 | 563.40 |
| 21 | San Marcos | 121 | 49 115 | 405.91 |
| 22 | San Miguel Ixtahuacán | 184 | 52 452 | 285.07 |
| 23 | San Pablo | 124 | 52 217 | 421.10 |
| 24 | San Pedro Sacatepéquez | 253 | 85 671 | 338.62 |
| 25 | San Rafael Pie de la Cuesta | 60 | 18 532 | 305.87 |
| 26 | Sibinal | 176 | 17 069 | 96.98 |
| 27 | Sipacapa | 152 | 27 270 | 179.41 |
| 28 | Tacaná | 302 | 82 079 | 271.78 |
| 29 | Tajumulco | 300 | 63 405 | 211.35 |
| 30 | Tejutla | 142 | 44 416 | 312.79 |
| San Marcos | 3 721 | 1 191 742 | 320.27 |
| N. | Municipalities | Area (km2) | Population (2018) | Density |
|---|---|---|---|---|
| 1 | Barberena | 294 | 61 079 | 207.75 |
| 2 | Casillas | 185 | 27 601 | 140.86 |
| 3 | Chiquimulilla | 499 | 64 871 | 130.00 |
| 4 | Cuilapa | 365 | 46 974 | 128.70 |
| 5 | Guazacapán | 172 | 22 197 | 129.05 |
| 6 | Nueva Santa Rosa | 67 | 39 286 | 586.36 |
| 7 | Oratorio | 214 | 27 115 | 126.71 |
| 8 | Pueblo Nuevo Viñas | 290 | 29 418 | 101.44 |
| 9 | San Juan Tecuaco | 80 | 12 825 | 160.31 |
| 10 | San Rafael las Flores | 84 | 13 850 | 164.88 |
| 11 | Santa Cruz Naranjo | 58 | 17 875 | 308.72 |
| 12 | Santa María Ixhuatán | 113 | 26 721 | 236.47 |
| 13 | Santa Rosa de Lima | 134 | 21 415 | 159.58 |
| 14 | Taxisco | 428 | 36 750 | 85.86 |
| Santa Rosa | 2 983 | 447 977 | 150.17 |
| N. | Municipalities | Area (km2) | Population (2018) | Density |
|---|---|---|---|---|
| 1 | Concepción | 40 | 7 214 | 180.35 |
| 2 | Nahualá | 218 | 87 319 | 400.55 |
| 3 | Panajachel | 22 | 16 101 | 731.86 |
| 4 | San Andrés Semetabaj | 48 | 14 681 | 305.85 |
| 5 | San Antonio Palopó | 34 | 15 752 | 463.29 |
| 6 | San José Chacayá | 44 | 5 220 | 118.64 |
| 7 | San Juan La Laguna | 38 | 13 400 | 350.97 |
| 8 | San Lucas Tolimán | 116 | 31 805 | 274.18 |
| 9 | San Marcos La Laguna | 12 | 2 944 | 245.33 |
| 10 | San Pablo La Laguna | 12 | 8 004 | 667 |
| 11 | San Pedro La Laguna | 24 | 11 828 | 492.83 |
| 12 | Santa Catarina Ixtahuacán | 218 | 61 274 | 281.07 |
| 13 | Santa Catarina Palopó | 8 | 4 882 | 610.25 |
| 14 | Santa Clara La Laguna | 12 | 10 390 | 865.83 |
| 15 | Santa Cruz La Laguna | 12 | 7 894 | 657.83 |
| 16 | Santa Lucía Utatlán | 44 | 21 790 | 495.23 |
| 17 | Santa María Visitación | 23 | 2 602 | 216.83 |
| 18 | Santiago Atitlán | 136 | 44 854 | 329.81 |
| 19 | Sololá | 94 | 99 934 | 1063.12 |
| Sololá | 1 155 | 467 888 | 405.09 |
| N. | Municipalities | Area (km2) | Population (2018) | Density |
|---|---|---|---|---|
| 1 | Chicacao | 216 | 67 399 | 312.03 |
| 2 | Cuyotenango | 93 | 37 785 | 408.49 |
| 3 | Mazatenango | 356 | 88 828 | 235.47 |
| 4 | Patulul | 332 | 42 394 | 127.69 |
| 5 | Pueblo Nuevo | 24 | 12 111 | 504.63 |
| 6 | Río Bravo | 302 | 31 303 | 103.65 |
| 7 | Samayac | 16 | 26 665 | 1666.56 |
| 8 | San Antonio Suchitepéquez | 64 | 65 50| | 1023.45 |
| 9 | San Bernardino | 32 | 17 110 | 534.69 |
| 10 | San Francisco Zapotitlán | 60 | 24 763 | 412.72 |
| 11 | San Gabriel | 16 | 8 082 | 505.13 |
| 12 | San José El Ídolo | 88 | 12 017 | 136.56 |
| 13 | San José La Máquina | 147 | 26 062 | 177.29 |
| 14 | San Juan Bautista | 52 | 9 404 | 180.65 |
| 15 | San Lorenzo | 60 | 13 930 | 232.17 |
| 16 | San Miguel Panán | 40 | 12 475 | 311.88 |
| 17 | San Pablo Jocopilas | 26 | 22 490 | 865.00 |
| 18 | Santa Bárbara | 125 | 27 708 | 221.66 |
| 19 | Santo Domingo Suchitepéquez | 242 | 48 825 | 201.76 |
| 20 | Santo Tomás La Unión | 80 | 12 800 | 160.00 |
| 21 | Zunilito | 56 | 8 888 | 158.71 |
| Suchitepéquez | 2 427 | 557 589 | 229.74 |
| N. | Municipalities | Area (km2) | Population (2018) | Density |
|---|---|---|---|---|
| 1 | Momostenango | 305 | 139 552 | 457.55 |
| 2 | San Andrés Xecul | 17 | 29 849 | 1 755.82 |
| 3 | San Bartolo | 8 | 12 459 | 1 557.38 |
| 4 | San Cristóbal Totonicapán | 36 | 36 119 | 1003.31 |
| 5 | San Francisco El Alto | 132 | 65 521 | 496.37 |
| 6 | Santa Lucía La Reforma | 136 | 25 668 | 188.74 |
| 7 | Santa María Chiquimula | 212 | 58 865 | 278.28 |
| 8 | Totonicapán | 328 | 118 960 | 362.68 |
| Totonicapán | 1 174 | 486 993 | 414.81 |
| N. | Municipalities | Area (km2) | Population (2018) | Density |
|---|---|---|---|---|
| 1 | Cabañas | 136 | 14 817 | 108.95 |
| 2 | Estanzuela | 94 | 10 872 | 115.41 |
| 3 | Gualán | 696 | 49 709 | 71.42 |
| 4 | Huité | 89 | 12 021 | 23.25 |
| 5 | La Unión | 214 | 38 473 | 179.79 |
| 6 | Río Hondo | 422 | 23 384 | 55.41 |
| 7 | San Diego | 104 | 7 732 | 74.59 |
| 8 | San Jorge | 82 | 18 000 | 219.51 |
| 9 | Teculután | 211 | 20 272 | 96.08 |
| 10 | Usumatlán | 257 | 13 245 | 51.54 |
| 11 | Zacapa | 517 | 66 423 | 128.47 |
| Zacapa | 2 822 | 274 948 | 97.43 |
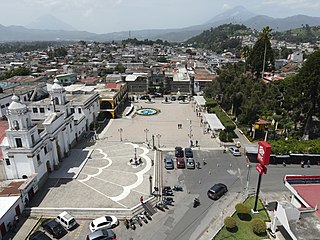
Chimaltenango is a city in Guatemala with a population of 96,985. It serves as both the capital of the department of Chimaltenango and the municipal seat for the surrounding municipality of the same name. Chimaltenango stands some 56 kilometres (35 mi) west of Guatemala City, on the Pan-American Highway. The municipal capital produces textiles and pottery.

Quetzaltenango is both the seat of the namesake Department and municipality, in Guatemala. The city is located in a mountain valley at an elevation of 2,330 meters above sea level at its lowest part. It may reach above 2,400 m (7,900 ft) within the city.

Comitán is the fourth-largest city in the Mexican state of Chiapas. It is the seat of government of the municipality of the same name.

The Republic of Guatemala is divided into 22 departments which in turn are divided into 340 municipalities. The departments are governed by a departmental governor, appointed by the President.
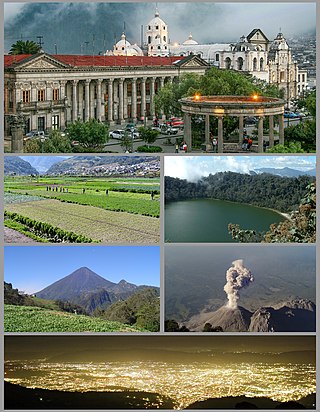
Quetzaltenango is a department in the western highlands of Guatemala. The capital is the city of Quetzaltenango, the second largest city in Guatemala. The department is divided up into 24 municipalities. The inhabitants include Spanish-speaking Ladinos and the Kʼicheʼ and Mam Maya groups, both with their own Maya language. The department consists of mountainous terrain, with its principal river being the Samalá River. the department is seismically active, suffering from both earthquakes and volcanic activity.
San Marcos (elevation: 7,868 feet is a city and municipality in Guatemala. It is the capital of the department of San Marcos. The municipality has a population of 47,063.

Cuilapa, also known as Santa Rosa Cuilapa, is a town, with a population of 41,359, in Guatemala. It serves as the capital of the department of Santa Rosa and as the administrative seat for the surrounding municipality of Cuilapa.
San Juan Chamelco is a town and a municipality in the Guatemalan department of Alta Verapaz. The municipality is situated at 1,350 metres above sea level and covers an area of 228 km2. The annual festival is on June 24. At the 2018 census, the population of the municipality was 57,456 and that of the town of San Juan Chamelco was 13,264.
Nentón is a town and municipality in the Guatemalan department of Huehuetenango. Its territory extends 717 km2 with a population of 45,679. It became a municipality on December 5, 1876 and was formerly known as San Benito Nentón. The population speaks Spanish and Chuj.
Tiquisate is a town, with a population of 29,193, and a municipality in the Escuintla department of Guatemala. The area is a major center of banana production, and the Tiquisate banana workers formed Guatemala's first private sector union in 1944.
San Vicente Pacaya is a town and municipality in the Escuintla department of Guatemala.
Santa Lucía Cotzumalguapa is a town, with a population of 58,877, and a municipality in the Escuintla department of Guatemala.
El Progreso, also El Progreso, Achuapa, is a town and municipality in the Jutiapa department of Guatemala. In 2018 the municipality had a population of 22,114 The Pan American Highway passes to the south of the main town, connecting it with Jutiapa, 11 kilometres (6.8 mi) to the southwest. The Morán, Chiquito and Ostúa rivers flow through the municipality. The main items produced locally include cigars, leather products, furniture, tiles and mud bricks.

Esquipulas Palo Gordo is a town and municipality in the San Marcos department of Guatemala. The town was founded on 24 December 1826 year. In the 1920s it was merged with San Marcos, but in 1948 it recovered its autonomy again.

Ocós is a municipality in the San Marcos Department of Guatemala. It is situated on the Pacific Ocean coast, very close to the border with Mexico at 4 m (13 ft) altitude and two big rivers: the Suchiate and the Naranjo rivers. On 23 January 2014, it lost about 2/3 of its territory when La Blanca was named the thirtieth San Marcos Department municipality.
San Cristóbal Cucho is a town and municipality in the San Marcos department of Guatemala.It was found on 11 October 1825. It was annexed to San Pedro Sacatepéquez, in 1935, but it was named a municipality again on 12 July 1945.
Concepción is a municipality in the Sololá department of Guatemala. The outstanding characteristic of the municipality is that 100% of its inhabitants are native people.
La Blanca is a municipality in the San Marcos department of Guatemala on the Pacific Ocean shore. It was created on 23 January 2014, when it was split from Ocos, along with Chiquirines and Pueblo Nuevo villages and became San Marcos Department thirtieth municipality. When created in 2014, La Blanca had about 25,000 inhabitants.
San José La Máquina is a municipality in the Guatemalan department of Suchitepéquez, located approximately 26 kilometres (16 mi) south of the departmental capital of Mazatenango.
San Jorge is a municipality in the Guatemalan department of Zacapa, located approximately 8 kilometres (5.0 mi) southwest of the departmental capital, also called Zacapa.