Renewable energy in South Dakota

Last updated
Big Bend Dam, Missouri River, South Dakota, USA USACE Fort Thompson Big Bend Dam.jpg
Big Bend Dam, Missouri River, South Dakota, USA
South Dakota Electricity Generation Sources South Dakota Electricity Generation Sources Pie Chart.svg
South Dakota Electricity Generation Sources

Renewable energy in South Dakota involves production of biofuels and generation of electricity from renewable sources of energy such as wind and hydropower. South Dakota is among the states with the highest percentage of electricity generation from renewable resources, typically over 70 percent. In 2011, South Dakota became the first U.S. state to have at least 20% of its electricity generation come from wind power, and by 2022, 84% of its generation was renewable (mostly wind power). [1]

Contents

Biofuel production

Ethanol fuel

Partially lying within the Corn Belt, South Dakota is a leading producer of ethanol fuel from corn. [2] As of December, 2011, South Dakota had 15 ethanol plants with a combined production capacity of over 1 billion U.S. gallons (3.8 million cubic meters) annually. [3] Sioux Falls is home to POET, one of the world's largest producers of ethanol. [4] Ethanol plants in South Dakota used 291 million U.S. bushels (10.3 million cubic meters) of corn in 2009. [5]

Biodiesel

South Dakota grows soybeans and other oil seed crops and has one biodiesel plant. Midwest Biodiesel Producers, located in Alexandria, is not in operation as of 2011 because the economics are not currently profitable. [6]

A type of corn oil suitable for use as a feedstock to biodiesel plants is now being extracted from byproducts of ethanol fuel production at several of POET's plants. [7]

Electrical power generation

About 30 percent of South Dakota's electricity generation is from wind. The state was the first to achieve the 20% mark for full year generation. WindPowrPctg.svg
About 30 percent of South Dakota's electricity generation is from wind. The state was the first to achieve the 20% mark for full year generation.

Hydroelectric power

Four dams on the Missouri River generate the bulk of South Dakota's hydropower. Hydropower is the main source of electricity generation in South Dakota. [8] These dams are Gavins Point Dam near Yankton, the Fort Randall Dam near Pickstown, the Big Bend Dam near Fort Thompson, and the Oahe Dam near Pierre. They have generating capacities of 44 MW, 320 MW, 293 MW, and 786 MW. [9] [10]

Wind power

Electricity generated from wind power constitutes about a quarter of total generation in South Dakota. South Dakota has 583 turbines with a total capacity of 977 megawatts (MW) of wind generation capacity. [11] Although this is not a large capacity compared with other states, because little electrical power is generated in the state and the high capacity factor, this amount still allows South Dakota to be a leading state in terms of the percentage of electricity generation. [12] [13]

Estimates from the U.S. Department of Energy, EERE indicate that over 800,000 MW of wind capacity could be installed in South Dakota. [14] Further expansion of wind power in the state is currently limited by lack of transmission capacity. A line from near Brookings to southeastern Minnesota, expected to be completed in 2015, should help alleviate the problem. [15]

The capacity factor of South Dakota's wind turbine fleet reached 42.9 percent in 2012, this was the highest reported percentage in the country. [16]

Titan Wind Project is a project with 25 MW of generating capacity, but has a proposed expansion to 5050 MW. [17] The Tatanka Wind Farm is on the North Dakota border, with 88.5 MW in South Dakota. [18]

Solar photovoltaic

As of the end of 2015, South Dakota had less than 250 kilowatts of grid connected photovoltaic capacity. [19] The state is ranked 14th in the country in solar power potential. [20]

Renewable portfolio standard

South Dakota legislation enacted a voluntary goal of 10% electrical generation from renewable energy sources by 2015. [21]

See also

Related Research Articles

<span class="mw-page-title-main">Capacity factor</span> Electrical production measure

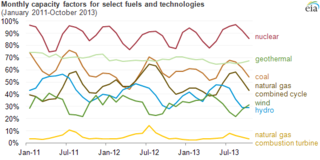
The net capacity factor is the unitless ratio of actual electrical energy output over a given period of time to the theoretical maximum electrical energy output over that period. The theoretical maximum energy output of a given installation is defined as that due to its continuous operation at full nameplate capacity over the relevant period. The capacity factor can be calculated for any electricity producing installation, such as a fuel consuming power plant or one using renewable energy, such as wind, the sun or hydro-electric installations. The average capacity factor can also be defined for any class of such installations, and can be used to compare different types of electricity production.

<span class="mw-page-title-main">Energy in the United States</span>

Energy in the United States is obtained from a diverse portfolio of sources, although the majority came from fossil fuels in 2021, as 36% of the nation's energy originated from petroleum, 32% from natural gas, and 11% from coal. Electricity from nuclear power supplied 8% and renewable energy supplied 12%, which includes biomass, wind, hydro, solar and geothermal.

<span class="mw-page-title-main">Renewable energy in Brazil</span>

As of 2018, renewable energy accounted for 79% of the domestically produced electricity used in Brazil.

<span class="mw-page-title-main">Energy in Brazil</span>

Brazil is the 7th largest energy consumer in the world and the largest in South America. At the same time, it is an important oil and gas producer in the region and the world's second largest ethanol fuel producer. The government agencies responsible for energy policy are the Ministry of Mines and Energy (MME), the National Council for Energy Policy (CNPE), the National Agency of Petroleum, Natural Gas and Biofuels (ANP) and the National Agency of Electricity (ANEEL). State-owned companies Petrobras and Eletrobras are the major players in Brazil's energy sector, as well as Latin America's.

<span class="mw-page-title-main">Renewable energy in the United States</span>

According to data from the US Energy Information Administration, renewable energy accounted for 8.4% of total primary energy production and 21% of total utility-scale electricity generation in the United States in 2022.

<span class="mw-page-title-main">Wind power in Minnesota</span> Electricity from wind in one U.S. state

At the end of 2016, the installed capacity for wind power in Minnesota was 3,500 megawatts (MW). Wind power generated nearly 18 percent of Minnesota’s electricity in 2016, ranking sixth in the nation for wind energy as a share of total electricity generation.

<span class="mw-page-title-main">Renewable energy in India</span>

India is the world's 4th largest consumer of electricity and the world's 3rd largest renewable energy producer with 40% of energy capacity installed in the year 2022 coming from renewable sources. Ernst & Young's (EY) 2021 Renewable Energy Country Attractiveness Index (RECAI) ranked India 3rd behind USA and China. In FY2023-24, India is planning to issue 50 GW tenders for wind, solar and hybrid projects. India has committed for a goal of 500 GW renewable energy capacity by 2030. In line with this commitment, India's installed renewable energy capacity has been experiencing a steady upward trend. From 94.4 GW in 2021, the capacity has gone up to 119.1 GW in 2023 as of Q4.

<span class="mw-page-title-main">Wind power in Illinois</span> Electricity from wind in one U.S. state

Wind power in Illinois provided nearly 10% of the state's generated electrical power in 2020 powering 1,231,900 homes. At the end of 2020, Illinois had 6,300 megawatts (MW) of wind power installed, ranking fifth among states for installed wind turbine capacity. An additional 1,100 MW of wind power was under construction across the state at the end of 2020.

In 2016, Arizona had 268 megawatts (MW) of wind powered electricity generating capacity, producing 0.5% of in-state generated electricity.

<span class="mw-page-title-main">Wind power in South Dakota</span> Electricity from wind in one U.S. state

The state of South Dakota is a leader in the U.S. in wind power generation with over 30% of the state's electricity generation coming from wind in 2017. In 2016, South Dakota had 583 turbines with a total capacity of 977 megawatts (MW) of wind generation capacity. In 2019, the capacity increased to 1525 MW.

<span class="mw-page-title-main">Wind power in Oklahoma</span> Electricity from wind in one U.S. state

The U.S. State of Oklahoma has high potential capacity for wind power in the western half of the state. In 2021, Oklahoma's installed wind generation capacity was almost 10,500 megawatts, supplying over 40% of the state's generated electricity and 85% of Oklahoma's total generating capacity from all renewable resources.

As of the end of 2021, New Mexico had 4,001 megawatts (MW) of wind powered electricity generating capacity, responsible for 30% of electricity produced that year. Wind power in New Mexico has the potential to generate more than all of the electricity consumed in the state.

References

  1. "South Dakota sees new interest in solar power". South Dakota News Watch. April 8, 2024. Archived from the original on May 29, 2024. Retrieved June 7, 2024.
  2. "U.S. Energy Atlas With Total Energy Layers". www.eia.gov. Archived from the original on 2023-12-01. Retrieved 2024-06-07.
  3. "Ethanol production capacity by state". Archived from the original on 2012-02-28. Retrieved 2012-02-10.
  4. "DSM and POET to make advanced biofuels a reality". Archived from the original on 2012-09-09. Retrieved 2012-02-10.
  5. "South Dakota Corn utilization statistics". Archived from the original on 2012-02-02. Retrieved 2012-02-10.
  6. "SDSA Praises Senate Passage of Tax Legislation, Urges Prompt House Passage". South Dakota Soybean Association. Archived from the original on 1 September 2011. Retrieved 27 December 2011.
  7. "POET ramps up production of corn oil for biodiesel". domesticfuel.com. 2 December 2011. Archived from the original on 17 December 2011. Retrieved 27 December 2011.
  8. "South Dakota Profile Analysis". www.eia.gov. Archived from the original on 2023-12-01. Retrieved 2024-06-07.
  9. "U.S. Bureau of Reclamation - Missouri River dams". Archived from the original on 2011-07-04. Retrieved 2012-02-10.
  10. "Lake Oahe Walleye Fishing". Archived from the original on 2009-02-21. Retrieved 2012-02-10.
  11. "South Dakota Fact Sheet". AWEA. Archived from the original on 2016-04-20.
  12. "Electric Power Monthly - U.S. Energy Information Administration (EIA)". www.eia.gov. Archived from the original on 2019-05-09. Retrieved 2024-06-07.
  13. "AWEA 2001 Annual Report". Archived from the original on 2012-04-14. Retrieved 2012-04-17.
  14. "Wind Powering America: South Dakota 80 Meter wind map". Archived from the original on 2012-04-29. Retrieved 2012-04-17.
  15. "South Dakota wind projects limited by lack of power lines - Governors' Wind Energy Coalition". Governors' Wind & Solar Energy Coalition. 2012-01-18. Archived from the original on 2022-10-03. Retrieved 2024-06-07.
  16. "U.S. Wind Capacity Factors – 2012 (preliminary)". National Wind Watch. Archived from the original on 2014-02-02. Retrieved 2014-01-18.
  17. "South Dakota Wind Energy Projects". puc.sd.gov. Archived from the original on 2024-05-23. Retrieved 2024-06-07.
  18. "Tatanka Wind Farm". Archived from the original on 2012-08-08. Retrieved 2012-08-06.
  19. South Dakota Solar Archived 2016-06-04 at the Wayback Machine , SEIA< accessed May 31, 2016
  20. Sherwood, Larry (August 2012), U.S. Solar Market Trends 2011
  21. "South Dakota Renewable, Recycled and Conserved Energy Objective". Archived from the original on 2012-10-30. Retrieved 2012-08-06.