
The Kyoto Protocol (Japanese: 京都議定書, Hepburn: Kyōto Giteisho) was an international treaty which extended the 1992 United Nations Framework Convention on Climate Change (UNFCCC) that commits state parties to reduce greenhouse gas emissions, based on the scientific consensus that global warming is occurring and that human-made CO2 emissions are driving it. The Kyoto Protocol was adopted in Kyoto, Japan, on 11 December 1997 and entered into force on 16 February 2005. There were 192 parties (Canada withdrew from the protocol, effective December 2012) to the Protocol in 2020.
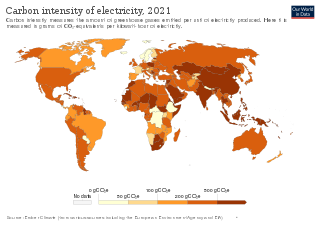
An emission intensity is the emission rate of a given pollutant relative to the intensity of a specific activity, or an industrial production process; for example grams of carbon dioxide released per megajoule of energy produced, or the ratio of greenhouse gas emissions produced to gross domestic product (GDP). Emission intensities are used to derive estimates of air pollutant or greenhouse gas emissions based on the amount of fuel combusted, the number of animals in animal husbandry, on industrial production levels, distances traveled or similar activity data. Emission intensities may also be used to compare the environmental impact of different fuels or activities. In some case the related terms emission factor and carbon intensity are used interchangeably. The jargon used can be different, for different fields/industrial sectors; normally the term "carbon" excludes other pollutants, such as particulate emissions. One commonly used figure is carbon intensity per kilowatt-hour (CIPK), which is used to compare emissions from different sources of electrical power.

The carbon footprint (or greenhouse gas footprint) serves as an indicator to compare the total amount of greenhouse gases emitted from an activity, product, company or country. Carbon footprints are usually reported in tons of emissions (CO2-equivalent) per unit of comparison; such as per year, person, kg protein, km travelled and alike. For a product, its carbon footprint includes the emissions for the entire life cycle from the production along the supply chain to its final consumption and disposal. Similarly for an organization, its carbon footprint includes the direct as well as the indirect emissions caused by the organization (called Scope 1, 2 and 3 in the Greenhouse Gas Protocol that is used for carbon accounting of organizations). Several methodologies and online tools exist to calculate the carbon footprint, depending on whether the focus is on a country, organization, product or individual person. For example, the carbon footprint of a product could help consumers decide which product to buy if they want to be climate aware. In the context of climate change mitigation activities, the carbon footprint can help distinguish those economic activities with a high footprint from those with a low footprint. In other words, the carbon footprint concept allows everyone to make comparisons between the climate-relevant impacts of individuals, products, companies, countries. In doing so, it helps to devise strategies and priorities for reducing the carbon footprint.
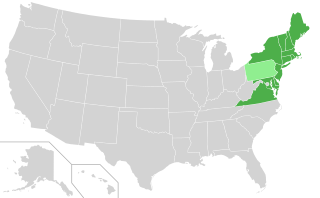
The Regional Greenhouse Gas Initiative (RGGI, pronounced "Reggie") is the first mandatory market-based program to reduce greenhouse gas emissions by the United States. RGGI is a cooperative effort among the states of Connecticut, Delaware, Maine, Maryland, Massachusetts, New Hampshire, New Jersey, New York, Rhode Island, Pennsylvania, Vermont and Virginia to cap and reduce carbon dioxide (CO2) emissions from the power sector. RGGI compliance obligations apply to fossil-fueled power plants 25 megawatts (MW) and larger within the 12-state region. North Carolina is currently considering joining RGGI.

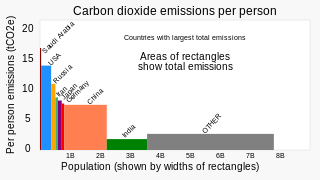
Greenhouse gas emissions from human activities strengthen the greenhouse effect, contributing to climate change. Carbon dioxide, from burning fossil fuels such as coal, oil, and natural gas, is one of the most important factors in causing climate change. The largest emitters are China followed by the US, although the United States has higher emissions per capita. The main producers fueling the emissions globally are large oil and gas companies. Human-caused emissions have increased atmospheric carbon dioxide by about 50% over pre-industrial levels. The growing levels of emissions have varied, but have been consistent among all greenhouse gases. Emissions in the 2010s averaged 56 billion tons a year, higher than any decade before. Total cumulative emissions from 1870 to 2017 were 425±20 GtC from fossil fuels and industry, and 180±60 GtC from land use change. Land-use change, such as deforestation, caused about 31% of cumulative emissions over 1870–2017, coal 32%, oil 25%, and gas 10%.

The United States produced 5.2 billion metric tons of carbon dioxide equivalent greenhouse gas (GHG) emissions in 2020, the second largest in the world after greenhouse gas emissions by China and among the countries with the highest greenhouse gas emissions per person. In 2019 China is estimated to have emitted 27% of world GHG, followed by the United States with 11%, then India with 6.6%. In total the United States has emitted a quarter of world GHG, more than any other country. Annual emissions are over 15 tons per person and, amongst the top eight emitters, is the highest country by greenhouse gas emissions per person. However, the IEA estimates that the richest decile in the US emits over 55 tonnes of CO2 per capita each year. Because coal-fired power stations are gradually shutting down, in the 2010s emissions from electricity generation fell to second place behind transportation which is now the largest single source. In 2020, 27% of the GHG emissions of the United States were from transportation, 25% from electricity, 24% from industry, 13% from commercial and residential buildings and 11% from agriculture. In 2021, the electric power sector was the second largest source of U.S. greenhouse gas emissions, accounting for 25% of the U.S. total. These greenhouse gas emissions are contributing to climate change in the United States, as well as worldwide.

Ensuring adequate energy supply to sustain economic growth has been a core concern of the Chinese Government since the founding of People's Republic of China in 1949. Since the country's industrialization in the 1960s, China is currently the world's largest emitter of greenhouse gases, and coal in China is a major cause of global warming. However, from 2010 to 2015 China reduced energy consumption per unit of GDP by 18%, and CO2 emissions per unit of GDP by 20%. On a per-capita basis, it was only the world's 51st largest emitter of greenhouse gases in 2016. China is also the world's largest renewable energy producer, and the largest producer of hydroelectricity, solar power and wind power in the world. The energy policy of China is connected to its industrial policy, where the goals of China's industrial production dictate its energy demand managements.

The New England Governors and Eastern Canadian Premiers (NEG-ECP) Climate Change Action Plan 2001 is a resolution adopted on August 28, 2001, by the New England Governors and the Eastern Canadian Premiers. The resolution calls for a reduction in greenhouse gas (GHG) emissions to 1990 levels by 2010, at least 10% below 1990 levels by 2020, 35-45% below 1990 levels by 2030, and a 75-85% reduction of 2001 levels by 2050.
This article is intended to give an overview of the greenhouse gas emissions in the U.S. state of Kentucky.
Greenhouse gas emissions by Australia totalled 533 million tonnes CO2-equivalent based on greenhouse gas national inventory report data for 2019; representing per capita CO2e emissions of 21 tons, three times the global average. Coal was responsible for 30% of emissions. The national Greenhouse Gas Inventory estimates for the year to March 2021 were 494.2 million tonnes, which is 27.8 million tonnes, or 5.3%, lower than the previous year. It is 20.8% lower than in 2005. According to the government, the result reflects the decrease in transport emissions due to COVID-19 pandemic restrictions, reduced fugitive emissions, and reductions in emissions from electricity; however, there were increased greenhouse gas emissions from the land and agriculture sectors.

Climate change in Sweden has received significant scientific, public and political attention. In 1896, Swedish chemist Svante Arrhenius was the first scientist to quantify global heating. Sweden has a high energy consumtion per capita, but reducing the dependency on fossil energy has been on the agenda of cabinets of the Governments of Sweden since the 1970s oil crises. In 2014 and 2016, Sweden was ranked #1 in the Global Green Economy Index (GGEI), because the Swedish economy produces relatively low emissions. Sweden has had one of the highest usages of biofuel in Europe and aims at prohibiting new sales of fossil-cars, including hybrid cars, by 2035, and for an energy supply system with zero net atmospheric greenhouse gas emissions by 2045.

The climate change policy of the United States has major impacts on global climate change and global climate change mitigation. This is because the United States is the second largest emitter of greenhouse gasses in the world after China, and is among the countries with the highest greenhouse gas emissions per person in the world. In total, the United States has emitted over 400 billion metric tons of greenhouse gasses, more than any country in the world.
The Kyoto Protocol was an international treaty which extended the 1992 United Nations Framework Convention on Climate Change. A number of governments across the world took a variety of actions.
The Chicago Climate Action Plan (CCAP) is Chicago's climate change mitigation and adaptation strategy that was adopted in September 2008. The CCAP has an overarching goal of reducing Chicago's greenhouse gas emissions to 80 percent below 1990 levels by 2050, with an interim goal of 25 percent below 1990 levels by 2020.

In 2021, net greenhouse gas (GHG) emissions in the United Kingdom (UK) were 427 million tonnes (Mt) carbon dioxide equivalent, 80% of which was carbon dioxide itself. Emissions increased by 5% in 2021 with the easing of COVID-19 restrictions, primarily due to the extra road transport. The UK has over time emitted about 3% of the world total human caused CO2, with a current rate under 1%, although the population is less than 1%.

Climate change in Finland has far reaching impacts on the natural environment and people of Finland. Finland was among the top five greenhouse gas emitters in 2001, on a per capita basis. Emissions increased to 58.8 million tonnes in 2016. Finland needs to triple its current cuts to emissions in order to be carbon neutral by 2035. Finland relies on coal and peat for its energy, but plans to phase out coal by 2029. Finland has a target of carbon neutrality by the year 2035 without carbon credits. The policies include nature conservation, more investments in trains, changes in taxation and more sustainable wood burning. After 2035 Finland will be carbon negative, meaning soaking more carbon than emitting.

Primary energy use in Slovakia was 194 TWh and 36 TWh per million inhabitants in 2009.
Greenhouse gas emissions by China are the largest of any country in the world both in production and consumption terms, and stem mainly from coal burning in China, including coal-fired power stations, coal mining, and blast furnaces producing iron and steel. When measuring production-based emissions, China emitted over 14 gigatonnes (Gt) CO2eq of greenhouse gases in 2019, 27% of the world total. When measuring in consumption-based terms, which adds emissions associated with imported goods and extracts those associated with exported goods, China accounts for 13 gigatonnes (Gt) or 25% of global emissions.

Climate change in the Netherlands is already affecting the country. The average temperature in the Netherlands rose by more than 2 °C from 1901 to 2020. Climate change has resulted in increased frequency of droughts and heatwaves. Because significant portions of the Netherlands have been reclaimed from the sea or otherwise are very near sea level, the Netherlands is very vulnerable to sea level rise.