Attribution of recent climate change

Last updated

Observed temperature from NASA vs the 1850-1900 average used by the IPCC as a pre-industrial baseline. The primary driver for increased global temperatures in the industrial era is human activity, with natural forces adding variability. Global Temperature And Forces With Fahrenheit.svg
Observed temperature from NASA vs the 1850–1900 average used by the IPCC as a pre-industrial baseline. The primary driver for increased global temperatures in the industrial era is human activity, with natural forces adding variability.

Scientific studies have investigated the causes of climate change. They have found that the main cause and driver of recent climate change is elevated levels of greenhouse gases produced by human activities. Natural forces add climate variability as well. Based on many scientific studies, it is "unequivocal that human influence has warmed the atmosphere, ocean and land since pre-industrial times." [4] :3 Studies on attribution have focused on changes observed during the period of instrumental temperature record, particularly in the last 50 years. This is the period when human activity has grown fastest and observations of the atmosphere above the surface have become available. [5] Some of the main human activities that contribute to global warming are: [6] (a) increasing atmospheric concentrations of greenhouse gases (mainly carbon dioxide), for a warming effect; (b) global changes to land surface, such as deforestation, for a warming effect; and (c) increasing atmospheric concentrations of aerosols, mainly for a cooling effect.

Contents

In addition to human activities, some natural mechanisms can also cause climate change, including for example, climate oscillations (for example El Niño–Southern Oscillation (ENSO)), changes in solar activity, and volcanic activity.

The IPCC's attribution of recent global warming to human activities reflects the view of the scientific community, [7] [8] [9] and is also supported by 196 other scientific organizations worldwide. [10]

Four main lines of evidence support attribution of recent climate change to human activities: [11] Firstly, a physical understanding of the climate system: greenhouse gas concentrations have increased and their warming properties are well-established. Secondly, there are historical estimates of past climate changes suggest that the recent changes in global surface temperature are unusual. Thirdly, computer-based climate models are unable to replicate the observed warming unless human greenhouse gas emissions are included. And finally, natural forces alone (such as solar and volcanic activity) cannot explain the observed warming.

Energy flows between space, the atmosphere, and Earth's surface. Rising greenhouse gas levels are contributing to an energy imbalance. Greenhouse Effect.svg
Energy flows between space, the atmosphere, and Earth's surface. Rising greenhouse gas levels are contributing to an energy imbalance.

Factors affecting Earth's climate

CO2 sources and sinks since 1880. While there is little debate that excess carbon dioxide in the industrial era has mostly come from burning fossil fuels, the future strength of land and ocean carbon sinks is an area of study. Carbon Sources and Sinks.svg
CO2 sources and sinks since 1880. While there is little debate that excess carbon dioxide in the industrial era has mostly come from burning fossil fuels, the future strength of land and ocean carbon sinks is an area of study.

Factors affecting Earth's climate can be broken down into forcings, feedbacks and internal variations. [8] :7 A forcing is something that is imposed externally on the climate system. External forcings include natural phenomena such as volcanic eruptions and variations in the sun's output. [13] Human activities can also impose forcings, for example, through changing the composition of Earth's atmosphere.

Radiative forcing is a measure of how various factors alter the energy balance of planet Earth. [14] A positive radiative forcing will lead towards a warming of the surface and, over time, the climate system. Between the start of the Industrial Revolution in 1750, and the year 2005, the increase in the atmospheric concentration of carbon dioxide (chemical formula: CO2) led to a positive radiative forcing, averaged over the Earth's surface area, of about 1.66 watts per square metre (abbreviated W m−2). [15]

Climate feedbacks can either amplify or dampen the response of the climate to a given forcing. [8] :7 There are many feedback mechanisms in the climate system that can either amplify (a positive feedback) or diminish (a negative feedback) the effects of a change in climate forcing.

The climate system will vary in response to changes in forcings. [16] The climate system will show internal variability both in the presence and absence of forcings imposed on it, (see images opposite). This internal variability is a result of complex interactions between components of the climate system, such as the coupling between the atmosphere and ocean (see also the later section on Internal climate variability and global warming). [17] An example of internal variability is the El Niño–Southern Oscillation.

Main causes

Greenhouse gases

Physical Drivers of climate change.svg
The warming influence (called radiative forcing) of different contributors to climate change in 2011, as reported in the fifth IPCC assessment report. [18]
1979- Radiative forcing - climate change - global warming - EPA NOAA.svg
Warming influence of atmospheric greenhouse gases has nearly doubled since 1979, with carbon dioxide and methane being the dominant drivers. [19]

CO2 is absorbed and emitted naturally as part of the carbon cycle, through animal and plant respiration, volcanic eruptions, and ocean-atmosphere exchange. [18] Human activities, such as the burning of fossil fuels and changes in land use (see below), release large amounts of carbon to the atmosphere, causing CO2 concentrations in the atmosphere to rise. [18] [20]

The high-accuracy measurements of atmospheric CO2 concentration, initiated by Charles David Keeling in 1958, constitute the master time series documenting the changing composition of the atmosphere. [21] These data, known as the Keeling Curve, have iconic status in climate change science as evidence of the effect of human activities on the chemical composition of the global atmosphere. [21]

The Keeling Curve shows the long-term increase of atmospheric carbon dioxide (CO2) concentrations from 1958-2018. Monthly CO2 measurements display seasonal oscillations in an upward trend. Each year's maximum occurs during the Northern Hemisphere's late spring. Mauna Loa CO2 monthly mean concentration.svg
The Keeling Curve shows the long-term increase of atmospheric carbon dioxide (CO2) concentrations from 1958–2018. Monthly CO2 measurements display seasonal oscillations in an upward trend. Each year's maximum occurs during the Northern Hemisphere's late spring.

Keeling's initial 1958 measurements showed 313 parts per million by volume (ppm). Atmospheric CO2 concentrations, commonly written "ppm", are measured in parts-per-million by volume (ppmv). In May 2019, the concentration of CO2 in the atmosphere reached 415 ppm. The last time when it reached this level was 2.6–5.3 million years ago. Without human intervention, it would be 280 ppm. [22]

Along with CO2, methane and to a lesser extent nitrous oxide are also major forcing contributors to the greenhouse effect. The Kyoto Protocol lists these together with hydrofluorocarbon (HFCs), perfluorocarbons (PFCs), and sulfur hexafluoride (SF6), [23] which are entirely artificial gases, as contributors to radiative forcing. The chart at right attributes anthropogenic greenhouse gas emissions to eight main economic sectors, of which the largest contributors are power stations (many of which burn coal or other fossil fuels), industrial processes, transportation fuels (generally fossil fuels), and agricultural by-products (mainly methane from enteric fermentation and nitrous oxide from fertilizer use). [24]

Over the past 150 years human activities have released increasing quantities of greenhouse gases into the atmosphere. This has led to increases in mean global temperature, or global warming. Other human effects are relevant—for example, sulphate aerosols are believed to have a cooling effect. Natural factors also contribute. The likely range of human-induced surface-level air warming by 2010–2019 compared to levels in 1850–1900 is 0.8 °C to 1.3 °C, with a best estimate of 1.07 °C. This is close to the observed overall warming during that time of 0.9 °C to 1.2 °C, while temperature changes during that time were likely only ±0.1 °C due to natural forcings and ±0.2 °C due to variability in the climate. [25] [25] :3, 443

Water vapor

Water vapor is the most abundant greenhouse gas and is the largest contributor to the natural greenhouse effect, despite having a short atmospheric lifetime [18] (about 10 days). [26] Some human activities can influence local water vapor levels. However, on a global scale, the concentration of water vapor is controlled by temperature, which influences overall rates of evaporation and precipitation. [18] Therefore, the global concentration of water vapor is not substantially affected by direct human emissions. [18]

Land surface changes

The rate of global tree cover loss has approximately doubled since 2001, to an annual loss approaching an area the size of Italy. 20210331 Global tree cover loss - World Resources Institute.svg
The rate of global tree cover loss has approximately doubled since 2001, to an annual loss approaching an area the size of Italy.
Cumulative land-use change contributions to emissions, by region. 1850-2019 Cumulative greenhouse gas emissions by region - bar chart - IPCC AR6 WG3 - Fig SPM.2b.svg
Cumulative land-use change contributions to emissions, by region.

Climate change is attributed to land use for two main reasons. Between 1750 and 2007, about two-thirds of anthropogenic CO2 emissions were produced from burning fossil fuels, and about one-third of emissions from changes in land use, [29] primarily deforestation. [30] Deforestation reduces the amount of carbon dioxide absorbed by ecosystems and releases greenhouse gases directly, which together with aerosols, exacerbate climate change. [31]

Land use drivers of climate change are sometimes indirect effects of human activity. For example, elephants in Africa are generally protective of slow-growing trees that are good for carbon dioxide sequestration. The sharply declining elephant population, due to human predation, indirectly leads to a tree population which absorbs less carbon dioxide. [32]

A second reason that climate change has been attributed to land use is that the terrestrial albedo is often altered by use, which leads to radiative forcing. This effect is more significant locally than globally. [30]

Livestock and land use

More than 18% of anthropogenic greenhouse gas emissions are attributed to livestock and livestock-related activities such as deforestation and increasingly fuel-intensive farming practices. [33] Specific attributions to the livestock sector include:

Aerosols

With virtual certainty, scientific consensus has attributed various forms of climate change, chiefly cooling effects, to aerosols, which are small particles or droplets suspended in the atmosphere. [34] [ obsolete source ] Key sources to which anthropogenic aerosols are attributed [35] include:

Analytical methods

In detection and attribution, natural factors include changes in the Sun's output and volcanic eruptions, as well as natural modes of variability such as El Nino and La Nina. Human factors include the emissions of heat-trapping "greenhouse" gases and particulates as well as clearing of forests and other land-use changes. Figure source: NOAA NCDC. Detection and attribution of climate change (NOAA NCDC).png
In detection and attribution, natural factors include changes in the Sun's output and volcanic eruptions, as well as natural modes of variability such as El Niño and La Niña. Human factors include the emissions of heat-trapping "greenhouse" gases and particulates as well as clearing of forests and other land-use changes. Figure source: NOAA NCDC.

Detection and attribution

This image shows three examples of internal climate variability measured between 1950 and 2012: the El Nino-Southern oscillation, the Arctic oscillation, and the North Atlantic oscillation. 3 examples of internal climate variability (1950-2012), the El Nino - Southern Oscillation, the Arctic Oscillation, and the North Atlantic Oscillation (NOAA).png
This image shows three examples of internal climate variability measured between 1950 and 2012: the El Niño–Southern oscillation, the Arctic oscillation, and the North Atlantic oscillation.

Detection and attribution of climate signals, as well as its common-sense meaning, has a more precise definition within the climate change literature, as expressed by the IPCC. [38] Detection of a climate signal does not always imply significant attribution. The IPCC's Fourth Assessment Report says "it is extremely likely that human activities have exerted a substantial net warming influence on climate since 1750", where "extremely likely" indicates a probability greater than 95%. [39] Detection of a signal requires demonstrating that an observed change is statistically significantly different from that which can be explained by natural internal variability.

Attribution requires demonstrating that a signal is:

The IPCC Fourth Assessment Report (2007), concluded that attribution was possible for a number of observed changes in the climate (see effects of global warming). However, attribution was found to be more difficult when assessing changes over smaller regions (less than continental scale) and over short time periods (less than 50 years). [40] Over larger regions, averaging reduces natural variability of the climate, making detection and attribution easier.

Lines of evidence

Among the possible factors that could produce changes in global mean temperature are internal variability of the climate system, external forcing, an increase in concentration of greenhouse gases, or any combination of these. Current studies indicate that the increase in greenhouse gases, most notably CO2, is mostly responsible for the observed warming. Evidence for this conclusion includes:

Recent scientific assessments find that most of the warming of the Earth's surface over the past 50 years has been caused by human activities. This conclusion rests on multiple lines of evidence. Like the warming "signal" that has gradually emerged from the "noise" of natural climate variability, the scientific evidence for a human influence on global climate has accumulated over the past several decades, from many hundreds of studies. [44]

The first line of evidence is based on a physical understanding of how greenhouse gases trap heat, how the climate system responds to increases in greenhouse gases, and how other human and natural factors influence climate. The second line of evidence is from indirect estimates of climate changes over the last 1,000 to 2,000 years. These records are obtained from living things and their remains (like tree rings and corals) and from physical quantities (like the ratio between lighter and heavier isotopes of oxygen in ice cores), which change in measurable ways as climate changes. [44]

The third line of evidence is based on the broad, qualitative consistency between observed changes in climate and the computer model simulations of how climate would be expected to change in response to human activities. For example, when climate models are run with historical increases in greenhouse gases, they show gradual warming of the Earth and ocean surface, increases in ocean heat content and the temperature of the lower atmosphere, a rise in global sea level, retreat of sea ice and snow cover, cooling of the stratosphere, an increase in the amount of atmospheric water vapor, and changes in large-scale precipitation and pressure patterns. These and other aspects of modelled climate change are in agreement with observations. [44]

"Fingerprint" studies

Human fingerprints for global warming (summary of observational evidence that human carbon dioxide emissions are causing the climate to warm). Human fingerprints for global warming.jpg
Human fingerprints for global warming (summary of observational evidence that human carbon dioxide emissions are causing the climate to warm).
Top panel: Observed global average temperature change (1870-- ).
Bottom panel: Data from the Fourth National Climate Assessment is merged for display on the same scale to emphasize relative strengths of forces affecting temperature change. Human-caused forces have increasingly dominated. 2017 Global warming attribution - based on NCA4 Fig 3.3.png
Top panel: Observed global average temperature change (1870— ).
Bottom panel: Data from the Fourth National Climate Assessment is merged for display on the same scale to emphasize relative strengths of forces affecting temperature change. Human-caused forces have increasingly dominated.

To determine the human contribution to climate change, unique "fingerprints" for all potential causes are developed and compared with both observed patterns and known internal climate variability. [47] [48] :875–876 For example, solar forcing—whose fingerprint involves warming the entire atmosphere—is ruled out because only the lower atmosphere has warmed. [49] :20 Atmospheric aerosols produce a smaller, cooling effect. Other drivers, such as changes in albedo, are less impactful. [50] :7

Fingerprint studies exploit these unique signatures, and allow detailed comparisons of modelled and observed climate change patterns. Scientists rely on such studies to attribute observed changes in climate to a particular cause or set of causes. In the real world, the climate changes that have occurred since the start of the Industrial Revolution are due to a complex mixture of human and natural causes. The importance of each individual influence in this mixture changes over time. Therefore, climate models are used to study how individual factors affect climate. For example, a single factor (like greenhouse gases) or a set of factors can be varied, and the response of the modelled climate system to these individual or combined changes can thus be studied. [44]

These projections have been confirmed by observations (shown above). [51] For example, when climate model simulations of the last century include all of the major influences on climate, both human-induced and natural, they can reproduce many important features of observed climate change patterns. When human influences are removed from the model experiments, results suggest that the surface of the Earth would actually have cooled slightly over the last 50 years. The clear message from fingerprint studies is that the observed warming over the last half-century cannot be explained by natural factors, and is instead caused primarily by human factors. [44]

Atmospheric fingerprints

Another fingerprint of human effects on climate has been identified by looking at a slice through the layers of the atmosphere, and studying the pattern of temperature changes from the surface up through the stratosphere (see the section on solar activity). The earliest fingerprint work focused on changes in surface and atmospheric temperature. Scientists then applied fingerprint methods to a whole range of climate variables, identifying human-caused climate signals in the heat content of the oceans, the height of the tropopause (the boundary between the troposphere and stratosphere, which has shifted upward by hundreds of feet in recent decades), the geographical patterns of precipitation, drought, surface pressure, and the runoff from major river basins. [52]

Studies published after the appearance of the IPCC Fourth Assessment Report in 2007 have also found human fingerprints in the increased levels of atmospheric moisture (both close to the surface and over the full extent of the atmosphere), in the decline of Arctic sea ice extent, and in the patterns of changes in Arctic and Antarctic surface temperatures. [52]

Extreme event attribution

Extreme event attribution, also known as attribution science, is a relatively new field of study in meteorology and climate science that tries to measure how ongoing climate change directly affects extreme events (rare events), for example extreme weather events. [53] [54] Attribution science aims to determine which such recent events can be explained by or linked to a warming atmosphere and are not simply due to natural variations. [55]
Frequency of occurrence (vertical axis) of local June-July-August temperature anomalies (relative to 1951-1980 mean) for Northern Hemisphere land in units of local standard deviation (horizontal axis). According to Hansen et al. (2012), the distribution of anomalies has shifted to the right as a consequence of global warming, meaning that unusually hot summers have become more common. This is analogous to the rolling of a dice: cool summers now cover only half of one side of a six-sided die, white covers one side, red covers four sides, and an extremely hot (red-brown) anomaly covers half of one side. Shifting Distribution of Summer Temperature Anomalies2.png
Frequency of occurrence (vertical axis) of local June–July–August temperature anomalies (relative to 1951–1980 mean) for Northern Hemisphere land in units of local standard deviation (horizontal axis). According to Hansen et al. (2012), the distribution of anomalies has shifted to the right as a consequence of global warming, meaning that unusually hot summers have become more common. This is analogous to the rolling of a dice: cool summers now cover only half of one side of a six-sided die, white covers one side, red covers four sides, and an extremely hot (red-brown) anomaly covers half of one side.

Potential causes that have been ruled out

Scientists have investigated other possible causes of recent climate change but these have been ruled out:

With regards to solar variation, scientists reject the notion that the warming observed in the global mean surface temperature record since about 1850 is the result of solar variations: "The observed rapid rise in global mean temperatures seen after 1985 cannot be ascribed to solar variability, whichever of the mechanisms is invoked and no matter how much the solar variation is amplified." [57]

The consensus position is that solar radiation may have increased by 0.12 W/m2 since 1750, compared to 1.6 W/m2 for the net anthropogenic forcing. [58] :3 Already in 2001, the IPCC Third Assessment Report had found that, "The combined change in radiative forcing of the two major natural factors (solar variation and volcanic aerosols) is estimated to be negative for the past two, and possibly the past four, decades." [59]

See also

Related Research Articles

<span class="mw-page-title-main">Greenhouse effect</span> Atmospheric phenomenon causing planetary warming

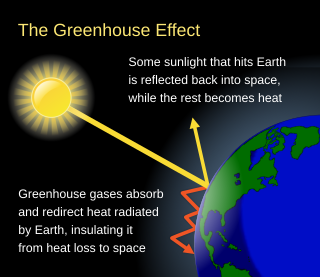
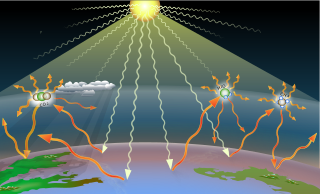
The greenhouse effect occurs when greenhouse gases in a planet's atmosphere trap some of the heat radiated from the planet's surface, raising its temperature. This process happens because stars emit shortwave radiation that passes through greenhouse gases, but planets emit longwave radiation that is partly absorbed by greenhouse gases. That difference reduces the rate at which a planet can cool off in response to being warmed by its host star. Adding to greenhouse gases further reduces the rate a planet emits radiation to space, raising its average surface temperature.

<span class="mw-page-title-main">Global warming potential</span> Potential heat absorbed by a greenhouse gas

Global warming potential (GWP) is an index to measure of how much infrared thermal radiation a greenhouse gas would absorb over a given time frame after it has been added to the atmosphere. The GWP makes different greenhouse gases comparable with regards to their "effectiveness in causing radiative forcing". It is expressed as a multiple of the radiation that would be absorbed by the same mass of added carbon dioxide, which is taken as a reference gas. Therefore, the GWP is one for CO2. For other gases it depends on how strongly the gas absorbs infrared thermal radiation, how quickly the gas leaves the atmosphere, and the time frame being considered.

<span class="mw-page-title-main">Climate variability and change</span> Change in the statistical distribution of climate elements for an extended period

Climate variability includes all the variations in the climate that last longer than individual weather events, whereas the term climate change only refers to those variations that persist for a longer period of time, typically decades or more. Climate change may refer to any time in Earth's history, but the term is now commonly used to describe contemporary climate change, often popularly referred to as global warming. Since the Industrial Revolution, the climate has increasingly been affected by human activities.

<span class="mw-page-title-main">Radiative forcing</span> Difference between solar irradiance absorbed by the Earth and energy radiated back to space

Radiative forcing is a concept used in climate science to quantify the change in energy balance in the Earth's atmosphere caused by various factors, such as concentrations of greenhouse gases, aerosols, and changes in solar radiation. In more technical terms, it is "the change in the net, downward minus upward, radiative flux due to a change in an external driver of climate change." These external drivers are distinguished from feedbacks and variability that are internal to the climate system, and that further influence the direction and magnitude of imbalance.

This glossary of climate change is a list of definitions of terms and concepts relevant to climate change, global warming, and related topics.

<span class="mw-page-title-main">IPCC Third Assessment Report</span> Assessment of available scientific and socio-economic information on climate change by the IPCC

The IPCC Third Assessment Report (TAR), Climate Change 2001, is an assessment of available scientific and socio-economic information on climate change by the IPCC. Statements of the IPCC or information from the TAR were often used as a reference showing a scientific consensus on the subject of global warming. The Third Assessment Report (TAR) was completed in 2001 and consists of four reports, three of them from its Working Groups: Working Group I: The Scientific Basis; Working Group II: Impacts, Adaptation and Vulnerability; Working Group III: Mitigation; Synthesis Report. A number of the TAR's conclusions are given quantitative estimates of how probable it is that they are correct, e.g., greater than 66% probability of being correct. These are "Bayesian" probabilities, which are based on an expert assessment of all the available evidence.

<span class="mw-page-title-main">IPCC Second Assessment Report</span>

The Second Assessment Report (SAR) of the Intergovernmental Panel on Climate Change (IPCC), published in 1995, is an assessment of the then available scientific and socio-economic information on climate change. The report was split into four parts: a synthesis to help interpret UNFCCC article 2, The Science of Climate Change, Impacts, Adaptations and Mitigation of Climate Change, Economic and Social Dimensions of Climate Change. Each of the last three parts was completed by a separate Working Group (WG), and each has a Summary for Policymakers (SPM) that represents a consensus of national representatives.

<span class="mw-page-title-main">Climate sensitivity</span> Change in Earths temperature caused by changes in atmospheric carbon dioxide concentrations

Climate sensitivity is a measure of how much Earth's surface will warm for a doubling in the atmospheric carbon dioxide concentration. In technical terms, climate sensitivity is the average change in global mean surface temperature in response to a radiative forcing, which drives a difference between Earth's incoming and outgoing energy. Climate sensitivity is a key measure in climate science, and a focus area for climate scientists, who want to understand the ultimate consequences of anthropogenic global warming.

<span class="mw-page-title-main">Kerry Emanuel</span> American professor of meteorology

Kerry Andrew Emanuel is an American professor of meteorology currently working at the Massachusetts Institute of Technology in Cambridge. In particular he has specialized in atmospheric convection and the mechanisms acting to intensify hurricanes.

Climate Change 2007, the Fourth Assessment Report (AR4) of the United Nations Intergovernmental Panel on Climate Change (IPCC), was published in 2007 and is the fourth in a series of reports intended to assess scientific, technical and socio-economic information concerning climate change, its potential effects, and options for adaptation and mitigation. The report is the largest and most detailed summary of the climate change situation ever undertaken, produced by thousands of authors, editors, and reviewers from dozens of countries, citing over 6,000 peer-reviewed scientific studies. People from over 130 countries contributed to the IPCC Fourth Assessment Report, which took six years to produce. Contributors to AR4 included more than 2,500 scientific expert reviewers, more than 800 contributing authors, and more than 450 lead authors.

<span class="mw-page-title-main">Climate change</span> Current rise in Earths average temperature and its effects

In common usage, climate change describes global warming—the ongoing increase in global average temperature—and its effects on Earth's climate system. Climate change in a broader sense also includes previous long-term changes to Earth's climate. The current rise in global average temperature is more rapid than previous changes, and is primarily caused by humans burning fossil fuels. Fossil fuel use, deforestation, and some agricultural and industrial practices add to greenhouse gases, notably carbon dioxide and methane. Greenhouse gases absorb some of the heat that the Earth radiates after it warms from sunlight. Larger amounts of these gases trap more heat in Earth's lower atmosphere, causing global warming.

<span class="mw-page-title-main">Climate system</span> Interactions that create Earths climate and may result in climate change

Earth's climate system is a complex system with five interacting components: the atmosphere (air), the hydrosphere (water), the cryosphere, the lithosphere and the biosphere. Climate is the statistical characterization of the climate system, representing the average weather, typically over a period of 30 years, and is determined by a combination of processes in the climate system, such as ocean currents and wind patterns. Circulation in the atmosphere and oceans is primarily driven by solar radiation and transports heat from the tropical regions to regions that receive less energy from the Sun. The water cycle also moves energy throughout the climate system. In addition, different chemical elements, necessary for life, are constantly recycled between the different components.

<span class="mw-page-title-main">IPCC First Assessment Report</span> 1990 IPCC report

The First Assessment Report (FAR) of the Intergovernmental Panel on Climate Change (IPCC) was completed in 1990. It served as the basis of the United Nations Framework Convention on Climate Change (UNFCCC). This report had effects not only on the establishment of the UNFCCC, but also on the first session of the Conference of the Parties (COP), held in Berlin in 1995. The executive summary of the WG I Summary for Policymakers report that said they were certain that emissions resulting from human activities are substantially increasing the atmospheric concentrations of the greenhouse gases, resulting on average in an additional warming of the Earth's surface. They calculated with confidence that CO2 had been responsible for over half the enhanced greenhouse effect.

<span class="mw-page-title-main">IPCC Fifth Assessment Report</span> Intergovernmental report on climate change

The Fifth Assessment Report (AR5) of the United Nations Intergovernmental Panel on Climate Change (IPCC) is the fifth in a series of such reports and was completed in 2014. As had been the case in the past, the outline of the AR5 was developed through a scoping process which involved climate change experts from all relevant disciplines and users of IPCC reports, in particular representatives from governments. Governments and organizations involved in the Fourth Report were asked to submit comments and observations in writing with the submissions analysed by the panel. Projections in AR5 are based on "Representative Concentration Pathways" (RCPs). The RCPs are consistent with a wide range of possible changes in future anthropogenic greenhouse gas emissions. Projected changes in global mean surface temperature and sea level are given in the main RCP article.

<span class="mw-page-title-main">Greenhouse gas</span> Gas in an atmosphere that absorbs and emits radiation at thermal infrared wavelengths

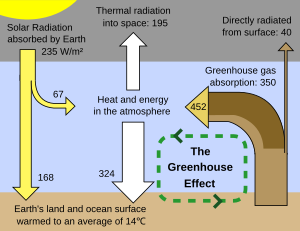
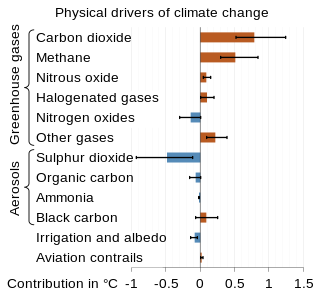
Greenhouse gases are the gases in the atmosphere that raise the surface temperature of planets such as the Earth. What distinguishes them from other gases is that they absorb the wavelengths of radiation that a planet emits, resulting in the greenhouse effect. The Earth is warmed by sunlight, causing its surface to radiate heat, which is then mostly absorbed by greenhouse gases. Without greenhouse gases in the atmosphere, the average temperature of Earth's surface would be about −18 °C (0 °F), rather than the present average of 15 °C (59 °F).

<span class="mw-page-title-main">Atmospheric methane</span> Methane in Earths atmosphere

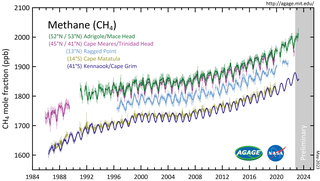
Atmospheric methane is the methane present in Earth's atmosphere. The concentration of atmospheric methane is increasing due to methane emissions, and is causing climate change. Methane is one of the most potent greenhouse gases. Methane's radiative forcing (RF) of climate is direct, and it is the second largest contributor to human-caused climate forcing in the historical period. Methane is a major source of water vapour in the stratosphere through oxidation; and water vapour adds about 15% to methane's radiative forcing effect. The global warming potential (GWP) for methane is about 84 in terms of its impact over a 20-year timeframe. That means it traps 84 times more heat per mass unit than carbon dioxide (CO2) and 105 times the effect when accounting for aerosol interactions.

<span class="mw-page-title-main">History of climate change science</span> Aspect of the history of science

The history of the scientific discovery of climate change began in the early 19th century when ice ages and other natural changes in paleoclimate were first suspected and the natural greenhouse effect was first identified. In the late 19th century, scientists first argued that human emissions of greenhouse gases could change Earth's energy balance and climate. The existence of the greenhouse effect, while not named as such, was proposed as early as 1824 by Joseph Fourier. The argument and the evidence were further strengthened by Claude Pouillet in 1827 and 1838. In 1856 Eunice Newton Foote demonstrated that the warming effect of the sun is greater for air with water vapour than for dry air, and the effect is even greater with carbon dioxide.

<span class="mw-page-title-main">Representative Concentration Pathway</span> Projections used in climate change modeling

A Representative Concentration Pathway (RCP) is a greenhouse gas concentration trajectory adopted by the IPCC. Four pathways were used for climate modeling and research for the IPCC Fifth Assessment Report (AR5) in 2014. The pathways describe different climate change scenarios, all of which are considered possible depending on the amount of greenhouse gases (GHG) emitted in the years to come. The RCPs – originally RCP2.6, RCP4.5, RCP6, and RCP8.5 – are labelled after a possible range of radiative forcing values in the year 2100. The higher values mean higher greenhouse gas emissions and therefore higher global temperatures and more pronounced effects of climate change. The lower RCP values, on the other hand, are more desirable for humans but require more stringent climate change mitigation efforts to achieve them.

<span class="mw-page-title-main">Gabriele Hegerl</span> German climatologist (born 1962)

Gabriele Clarissa Hegerl is a German climatologist. She is a professor of climate system science at the University of Edinburgh School of GeoSciences. Prior to 2007 she held research positions at Texas A&M University and at Duke University's Nicholas School of the Environment, during which time she was a co-ordinating lead author for the Intergovernmental Panel on Climate Change (IPCC) Fourth and Fifth Assessment Report.

References

  1. "Global Annual Mean Surface Air Temperature Change". NASA. Archived from the original on 16 April 2020. Retrieved 23 February 2020..
  2. IPCC AR5 SYR Glossary 2014 , p. 124.
  3. USGCRP Chapter 3 2017 Figure 3.1 panel 2 Archived 9 April 2018 at the Wayback Machine , Figure 3.3 panel 5 .
  4. Eyring, Veronika; Gillett, Nathan P.; Achutarao, Krishna M.; Barimalala, Rondrotiana; et al. (2021). "Chapter 3: Human influence on the climate system" (PDF). IPCC AR6 WG1 2021 .
  5. "NASA – What's in a Name? Global Warming vs. Climate Change". nasa.gov. Archived from the original on 14 November 2019. Retrieved 29 October 2018.
  6. IPCC AR4 WG1 2007, chapter "9.7 Combining Evidence of Anthropogenic Climate Change Archived 11 November 2018 at the Wayback Machine "
  7. Committee on the Science of Climate Change, US National Research Council (2001). "Summary". Climate Change Science: An Analysis of Some Key Questions. Washington, D.C., US: National Academies Press. pp. 1–3. doi:10.17226/10139. ISBN   0-309-07574-2. Archived from the original on 5 June 2011. Retrieved 20 May 2011. "The IPCC's conclusion that most of the observed warming of the last 50 years is likely to have been due to the increase in greenhouse gas concentrations accurately reflects the current thinking of the scientific community on this issue" (page 3).
  8. 1 2 3 US National Research Council (2008). Understanding and responding to climate change: Highlights of National Academies Reports, 2008 edition (PDF). Washington D.C.: National Academy of Sciences. Archived from the original (PDF) on 13 December 2011. Retrieved 20 May 2011.
  9. Cook, John; Nuccitelli, Dana; Green, Sarah A; Richardson, Mark; Winkler, Bärbel; Painting, Rob; Way, Robert; Jacobs, Peter; Skuce, Andrew (1 June 2013). "Quantifying the consensus on anthropogenic global warming in the scientific literature". Environmental Research Letters. 8 (2): 024024. Bibcode:2013ERL.....8b4024C. doi:10.1088/1748-9326/8/2/024024. ISSN   1748-9326.
  10. OPR (n.d.), Office of Planning and Research (OPR) List of Organizations, OPR, Office of the Governor, State of California, archived from the original on 1 April 2014, retrieved 30 November 2013. Archived page: The source appears to incorrectly list the Society of Biology (UK) twice.
  11. "EPA's Endangerment Finding Climate Change Facts". National Service Center for Environmental Publications (NSCEP). 2009. Report ID: 430F09086. Archived from the original on 23 December 2017. Retrieved 22 December 2017.
  12. "CO2 is making Earth greener—for now". NASA. Archived from the original on 27 February 2020. Retrieved 28 February 2020.
  13. Le Treut et al., Chapter 1: Historical Overview of Climate Change Science Archived 21 December 2011 at the Wayback Machine , FAQ 1.1, What Factors Determine Earth's Climate? Archived 26 June 2011 at the Wayback Machine , in IPCC AR4 WG1 2007.
  14. Forster et al., Chapter 2: Changes in Atmospheric Constituents and Radiative Forcing Archived 21 December 2011 at the Wayback Machine , FAQ 2.1, How do Human Activities Contribute to Climate Change and How do They Compare with Natural Influences? Archived 6 July 2011 at the Wayback Machine in IPCC AR4 WG1 2007.
  15. IPCC, Summary for Policymakers Archived 2 November 2018 at the Wayback Machine , Human and Natural Drivers of Climate Change Archived 2 November 2018 at the Wayback Machine , Figure SPM.2, in IPCC AR4 WG1 2007.
  16. Committee on the Science of Climate Change, US National Research Council (2001). "2. Natural Climatic Variations". Climate Change Science: An Analysis of Some Key Questions. Washington, D.C., US: National Academies Press. p. 8. doi:10.17226/10139. ISBN   0-309-07574-2. Archived from the original on 27 September 2011. Retrieved 20 May 2011.
  17. Albritton et al., Technical Summary Archived 24 December 2011 at the Wayback Machine , Box 1: What drives changes in climate? Archived 19 January 2017 at the Wayback Machine , in IPCC TAR WG1 2001.
  18. 1 2 3 4 5 6 Quote from public-domain source: US Environmental Protection Agency (EPA) (28 June 2012). "Causes of Climate Change: The Greenhouse Effect causes the atmosphere to retain heat". EPA. Archived from the original on 8 March 2017. Retrieved 1 July 2013.
  19. "The NOAA Annual Greenhouse Gas Index (AGGI)". NOAA.gov. National Oceanic and Atmospheric Administration (NOAA). Spring 2023. Archived from the original on 24 May 2023.
  20. See also: 2.1 Greenhouse Gas Emissions and Concentrations, vol. 2. Validity of Observed and Measured Data, archived from the original on 27 August 2016, retrieved 1 July 2013, in EPA 2009
  21. 1 2 Le Treut, H.; et al., "1.3.1 The Human Fingerprint on Greenhouse Gases", Historical Overview of Climate Change Science, archived from the original on 29 December 2011, retrieved 18 August 2012, in IPCC AR4 WG1 2007.
  22. Rosane, Olivia (13 May 2019). "CO2 Levels Top 415 PPM for First Time in Human History". Ecowatch. Archived from the original on 14 May 2019. Retrieved 14 May 2019.
  23. "The Kyoto Protocol". UNFCCC. Archived from the original on 25 August 2009. Retrieved 9 September 2007.
  24. 7. Projecting the Growth of Greenhouse-Gas Emissions (PDF), pp. 171–4, archived from the original (PDF) on 4 November 2012, in Stern Review Report on the Economics of Climate Change (pre-publication edition) (2006)
  25. The IPCC in this report uses "likely" to indicate a statement with an assessed probability of 66% to 100%. IPCC (2021). "Summary for Policymakers" (PDF). IPCC AR6 WG1 2021 . p. 4 n.4. ISBN   978-92-9169-158-6.
  26. Schmidt, Gavin A. (6 April 2005). "Water vapour: feedback or forcing?". RealClimate. Archived from the original on 18 April 2009. Retrieved 7 April 2008.
  27. Butler, Rhett A. (31 March 2021). "Global forest loss increases in 2020". Mongabay. Archived from the original on 1 April 2021.Mongabay graphing WRI data from "Forest Loss / How much tree cover is lost globally each year?". research.WRI.org. World Resources Institute — Global Forest Review. January 2021. Archived from the original on 2 August 2023.
  28. Fig. SPM.2b from Working Group III (4 April 2022). "Climate Change 2022 / Mitigation of Climate Change / Summary for Policymakers" (PDF). IPCC.ch. Intergovernmental Panel on Climate Change. p. SPM-11. Archived (PDF) from the original on 4 April 2022. Data is for 2019.
  29. Solomon, S.; et al., "TS.2.1.1 Changes in Atmospheric Carbon Dioxide, Methane and Nitrous Oxide", Technical Summary, archived from the original on 15 October 2012, retrieved 18 August 2012, in IPCC AR4 WG1 2007.
  30. 1 2 Solomon, S.; et al., Technical Summary, archived from the original on 28 November 2018, retrieved 25 September 2011, in IPCC AR4 WG1 2007. [ full citation needed ]
  31. Braghiere, Renato Kerches; Yamasoe, Marcia Akemi; Évora do Rosário, Nilton Manuel; Ribeiro da Rocha, Humberto; de Souza Nogueira, José; de Araújo, Alessandro Carioca (24 March 2020). "Characterization of the radiative impact of aerosols on CO2 and energy fluxes in the Amazon deforestation arch using artificial neural networks". Atmospheric Chemistry and Physics. 20 (6): 3439–3458. doi: 10.5194/acp-20-3439-2020 . ISSN   1680-7316.
  32. Cimons, Marlene (9 August 2019). "Elephants and Monkeys Are Working to Protect You From Climate Change". Ecowatch. Archived from the original on 10 August 2019. Retrieved 11 August 2019.
  33. 1 2 Steinfeld, Henning; Gerber, Pierre; Wassenaar, Tom; Castel, Vincent; Rosales, Mauricio; de Haan, Cees (2006). Livestock's Long Shadow (PDF). Food and Agricultural Organization of the U.N. ISBN   9251055718. Archived from the original (PDF) on 25 June 2008.
  34. ??[ citation needed ] in IPCC AR4 WG1 2007.
  35. Geerts, B. "Aerosols and Climate". Archived from the original on 21 January 2019. Retrieved 21 August 2021.[ verification needed ]
  36. PD-icon.svg This article incorporates public domain material from Figure 14: Detection and Attribution as Forensics (source: NOAA NCDC), in: Walsh, J.; et al. (11 January 2013), "Appendix II: The Science of Climate Change" (PDF), FEDERAL ADVISORY COMMITTEE DRAFT CLIMATE ASSESSMENT. A report by the National Climate Assessment Development Advisory Committee, archived from the original on 13 September 2013, retrieved 23 July 2013, p.1139 (p.23 of chapter PDF).
  37. "Climate.gov". NOAA. Global Climate Dashboard > Climate Variability. Archived from the original on 3 July 2011. Retrieved 22 December 2017.
  38. Mitchell et al., Chapter 12: Detection of Climate Change and Attribution of Causes Archived 19 January 2017 at the Wayback Machine , Section 12.1.1: The Meaning of Detection and Attribution Archived 24 October 2003 at the Wayback Machine , in IPCC TAR WG1 2001.
  39. IPCC AR4 WG1 2007, chapter "TS.6 Robust Findings and Key Uncertainties Archived 2 November 2018 at the Wayback Machine "
  40. Hegerl et al., Chapter 9: Understanding and Attributing Climate Change Archived 28 November 2011 at the Wayback Machine , Executive Summary Archived 18 November 2018 at the Wayback Machine , in IPCC AR4 WG1 2007.
  41. IPCC, Summary for Policymakers Archived 17 June 2016 at the Wayback Machine .[ page needed ] in IPCC TAR WG1 2001.
  42. Mitchell et al., Chapter 12: Detection of Climate Change and Attribution of Causes Archived 19 January 2017 at the Wayback Machine Section 12.4.3, Optimal Fingerprint Methods Archived 11 October 2003 at the Wayback Machine , in IPCC TAR WG1 2001.
  43. [ author missing ] Figure 4, Simulated annual global mean surface temperatures Archived 12 March 2007 at the Wayback Machine , in IPCC TAR WG1 2001.[ verification needed ]
  44. 1 2 3 4 5 Karl & others 2009, page 19.
  45. "Human Fingerprints". Skeptical Science. Retrieved 23 January 2024.
  46. "Climate Science Special Report: Fourth National Climate Assessment, Volume I - Chapter 3: Detection and Attribution of Climate Change". science2017.globalchange.gov. U.S. Global Change Research Program (USGCRP): 1–470. 2017. Archived from the original on 23 September 2019. Adapted directly from Fig. 3.3.
  47. Knutson, T., 2017: Detection and attribution methodologies overview. In: Climate Science Special Report: Fourth National Climate Assessment, Volume I [Wuebbles, D.J., D.W. Fahey, K.A. Hibbard, D.J. Dokken, B.C. Stewart, and T.K. Maycock (eds.)]. U.S. Global Change Research Program, Washington, DC, USA, pp. 443-451, doi: 10.7930/J0319T2J
  48. Bindoff, N.L., P.A. Stott, K.M. AchutaRao, M.R. Allen, N. Gillett, D. Gutzler, K. Hansingo, G. Hegerl, Y. Hu, S. Jain, I.I. Mokhov, J. Overland, J. Perlwitz, R. Sebbari and X. Zhang, 2013: Chapter 10: Detection and Attribution of Climate Change: from Global to Regional. In: Climate Change 2013: The Physical Science Basis. Contribution of Working Group I to the Fifth Assessment Report of the Intergovernmental Panel on Climate Change [Stocker, T.F., D. Qin, G.-K. Plattner, M. Tignor, S.K. Allen, J. Boschung, A. Nauels, Y. Xia, V. Bex and P.M. Midgley (eds.)]. Cambridge University Press, Cambridge, United Kingdom and New York, NY, USA.
  49. Global climate change impacts in the United States: a state of knowledge report. Cambridge [England]: Cambridge university press. 2009. ISBN   978-0-521-14407-0.
  50. IPCC, 2021: Summary for Policymakers. In: Climate Change 2021: The Physical Science Basis. Contribution of Working Group I to the Sixth Assessment Report of the Intergovernmental Panel on Climate Change [Masson-Delmotte, V., P. Zhai, A. Pirani, S.L. Connors, C. Péan, S. Berger, N. Caud, Y. Chen, L. Goldfarb, M.I. Gomis, M. Huang, K. Leitzell, E. Lonnoy, J.B.R. Matthews, T.K. Maycock, T. Waterfield, O. Yelekçi, R. Yu, and B. Zhou (eds.)]. Cambridge University Press, Cambridge, United Kingdom and New York, NY, USA, pp. 3−32, doi:10.1017/9781009157896.001.
  51. Schneider, S., Climate Science, Stephen H. Schneider, Stanford University, It is likely that human activities have caused a discernible impact on observed warming trends, archived from the original on 21 March 2013, retrieved 28 September 2012
  52. 1 2 Karl & others 2009, page 20.
  53. NASEM (2016). Attribution of Extreme Weather Events in the Context of Climate Change. Washington, D.C.: The National Academies Press. ISBN   978-0-309-38094-2 . Retrieved 3 September 2021.
  54. "The Science Connecting Extreme Weather to Climate Change". Union of Concerned Scientists. Retrieved 3 September 2021.
  55. Zeng, Zubin (25 August 2021). "Is climate change to blame for extreme weather events? Attribution science says yes, for some – here's how it works". The Conversation . Retrieved 3 September 2021.
  56. 1 2 3 Hansen, J.; et al. (July 2012), The New Climate Dice: Public Perception of Climate Change (PDF), New York City: Dr James E. Hansen, Columbia University, pp. 3–4, archived (PDF) from the original on 22 December 2012, retrieved 8 March 2013
  57. Lockwood, Mike; Lockwood, Claus (2007). "Recent oppositely directed trends in solar climate forcings and the global mean surface air temperature" (PDF). Proceedings of the Royal Society A. 463 (2086): 2447–2460. Bibcode:2007RSPSA.463.2447L. doi:10.1098/rspa.2007.1880. S2CID   14580351. Archived from the original (PDF) on 26 September 2007. Retrieved 21 July 2007. There are many interesting palaeoclimate studies that suggest that solar variability had an influence on pre-industrial climate. There are also some detection–attribution studies using global climate models that suggest there was a detectable influence of solar variability in the first half of the twentieth century and that the solar radiative forcing variations were amplified by some mechanism that is, as yet, unknown. However, these findings are not relevant to any debates about modern climate change. Our results show that the observed rapid rise in global mean temperatures seen after 1985 cannot be ascribed to solar variability, whichever of the mechanisms is invoked and no matter how much the solar variation is amplified.
  58. IPCC, 2007: Summary for Policymakers. In: Climate Change 2007: The Physical Science Basis. Contribution of Working Group I to the Fourth Assessment Report of the Intergovernmental Panel on Climate Change [Solomon, S., D. Qin, M. Manning, Z. Chen, M. Marquis, K.B. Averyt, M.Tignor and H.L. Miller (eds.)]. Cambridge University Press, Cambridge, United Kingdom and New York, NY, USA.
  59. IPCC (2001) Summary for Policymakers - A Report of Working Group I of the Intergovernmental Panel on Climate Change. In: TAR Climate Change 2001: The Scientific Basis

Sources

Public-domain sources