San Tan Valley is a town in northern Pinal County, Arizona, United States. The population was 99,894 at the 2020 census.[4] Proposition 495, a measure to incorporate San Tan Valley as a municipality, passed in 2025.[7]
San Tan Valley derives its name from the nearby San Tan Mountains. San Tan Valley was picked as the name for the area based on an informal public poll commissioned by now former Pinal County Supervisor Bryan Martyn.[8] Previously referred to as San Tan Heights, San Tan Foothills, Greater San Tan and simply the San Tan Area, the community lacked any official name and residents used nearby Queen Creek for their mailing addresses. This practice led to confusion, as the Town of Queen Creek is located primarily in neighboring Maricopa County.[9] To coincide with the addition of a new ZIP Code for the community on July 1, 2009, the United States Postal Service was petitioned to provide the area with a new name. As part of the initial request, "Bella Vista" name was submitted to the postal service, drawing the ire of some local residents who opposed the suggested name. In response, the Greater San Tan Area Coalition organized a non-binding vote on June 23, offering residents the opportunity to vote on a name for the community.[10]
The area, which had consisted primarily of undeveloped desert and agriculture prior to 2000, experienced considerable growth in the early part of the decade. As early as 2004, attempts to incorporate the area were underway. An initial attempt, which proposed a name of simply "San Tan" for the area, was blocked by the neighboring town of Florence after rural residents there expressed concern that allowing incorporation would accelerate the urbanization of the area.[11] A subsequent effort in 2005 failed to gain traction. Following the renaming of the area in 2009, a renewed effort at incorporation sought to put the issue to a vote in 2010, this time with the support of Pinal County.[12] The Town Council of Florence unanimously rejected a resolution that would have approved San Tan Valley's proposed boundaries over concerns of their allotment of state shared revenue.[13]
In 2025, a group of residents filed a petition to incorporate San Tan Valley as a town.[14] A proposition was then submitted to the residents of San Tan Valley, who approved incorporation at an election on August 5.[15] On September 17, 2025, the Pinal County government formally declared the town appointed.[1]
Geography
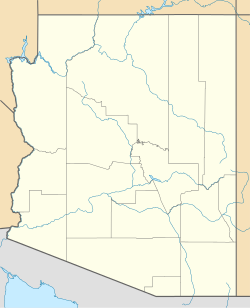
San Tan Valley is located in the unincorporated area between the towns of Queen Creek to the north and west, and Florence to the south. The area is also bound by the San Tan Mountains Regional Park on the west and the Gila River Indian Community on the southwest. The area consists largely of planned communities, such as Pecan Creek South, San Tan Heights, Archer Meadows, and Johnson Ranch.[9]
Climate
Situated east of the San Tan Mountains, the community is located in the Sonoran Desert. As such, it experiences the hot, arid summers and moderate winters that typify the area. According to the Köppen climate classification, San Tan Valley has a hot desert climate (abbreviated BWh).
Climate data for San Tan Valley, 1991–2020 simulated normals (1542 ft elevation)
San Tan Valley CDP, Arizona – Racial composition Note: the US Census treats Hispanic/Latino as an ethnic category. This table excludes Latinos from the racial categories and assigns them to a separate category. Hispanics/Latinos may be of any race.
As of the 2020 census, there were 99,894 people. The racial and ethnic composition of the population was 68.7% white, 5.0% black or African American, 1.4% Native American, 1.9% Asian, 0.4% Pacific Islander, 13.4% two more or races, 9.3% reporting some other race. The population was 25.4% Hispanic or Latino (of any race).
2010 census
As of the 2010 census, there were 81,321 people. The racial and ethnic composition of the population was 66.2% non-Hispanic white, 5.0% black or African American, 1.2% Native American, 2.1% Asian, 0.3% Pacific Islander, 0.2% non-Hispanic reporting some other race and 23.4% Hispanic or Latino.
Education
San Tan Valley is serviced by the following school districts.[20] Each district has its own high school located within San Tan Valley:
This page is based on this Wikipedia article Text is available under the CC BY-SA 4.0 license; additional terms may apply. Images, videos and audio are available under their respective licenses.