Queen Creek, Arizona

Last updated

Queen Creek, Arizona
Queen Creek-Queen Creek Town Hall.jpg
Queen Creek Town Hall
Flag of Queen Creek, Arizona.svg
Queencreekaz seal.png
Maricopa County and Pinal County Arizona Incorporated and Unincorporated areas Queen Creek Highlighted 0458150.svg
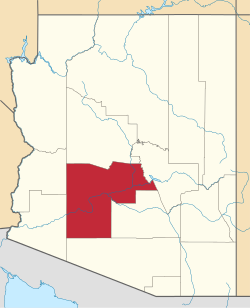
Location in Maricopa and Pinal counties
Coordinates: 33°14′55″N111°38′03″W / 33.24861°N 111.63417°W / 33.24861; -111.63417
CountryUnited States
State Arizona
Counties Maricopa, Pinal
Incorporated September 5, 1989
Government
   Mayor Julia Wheatley [1]
Area
[2]
  Total
42.130 sq mi (109.116 km2)
  Land42.102 sq mi (109.043 km2)
  Water0.028 sq mi (0.073 km2)
Elevation
[3]
1,417 ft (432 m)
Population
 (2024) [4]
  Total
83,700
  Estimate 
(2025) [5]
87,006
  RankUS: 483th
AZ: 16th
  Density1,688/sq mi (651.6/km2)
Time zone UTC–7 (Mountain (MST) (no DST))
ZIP Codes
85140, 85142, 85143, 85144
Area code 480
FIPS code 04-58150
GNIS feature ID2412518 [3]
Sales tax 8.55% [6]
Website queencreekaz.gov

Queen Creek is a town in Maricopa and Pinal counties in Arizona, United States. The population was 59,519 at the 2020 census, and is at a population of 83,700 as of 2024. [4] It is a suburb of Phoenix, located in the far southeast area of the Phoenix Metropolitan Area.

Contents

History

Based on the post office form on file at the National Archives, Queen Creek was originally known as Rittenhouse, after C. H. Rittenhouse—the community having grown out of a railroad stop he constructed after forming the Queen Creek Farms Company in 1919 and needing a shipping point for his produce. [7] The eponymous "creek" (typically more of a dry arroyo), originally called Picket Post Creek, once flowed through Queen Canyon and was named for the Silver Queen Mine. [7]

Geography

The town of Queen Creek is primarily within Maricopa County, but the town limits extended into Pinal County on the eastern and southern borders when they annexed the Ironwood Crossing neighborhood in 2018. [8] The town is bordered to the south and east in Pinal County by the unincorporated community of San Tan Valley (population 99,894).

According to the United States Census Bureau, the town of Queen Creek has a total area of 42.130 square miles (109.12 km2), of which 0.028 square miles (0.07 km2), or 0.07%, are water. [2]

Climate

Typical of the Sonoran Desert, Queen Creek has a hot desert climate (Köppen: BWh), characterized by long, extremely hot summers and mild winters. The region is one of the sunniest on Earth, receiving over 3,800 hours of bright sunshine annually. While precipitation is sparse, it follows a bimodal pattern. The primary rainy season is the North American Monsoon, which occurs from July to mid-September, bringing moisture from the south that results in dramatic thunderstorms. A secondary, gentler rainy season occurs during the winter from Pacific frontal systems. This two-season rainfall pattern makes the Sonoran Desert the most biodiverse desert in the world, supporting a richer ecology than drier, single-season rainfall climates like the Mojave Desert.

The official weather observation station is located at the nearby Phoenix-Mesa Gateway Airport. The all-time record high temperature is 119°F (48°C), recorded on two separate occasions, while the all-time record low is 15°F (−9°C). This record low was set during the "Great Freeze of 1963," a historic arctic outbreak that devastated the agricultural industry across the Southwest. Specifically citrus was hit the hardest. Citrus groves took years to recover. Summers are defined by persistent and extreme heat; on average, temperatures reach or exceed 100°F (38°C) on 103 days per year, with 11 of those days reaching 110°F (43°C) or more. In contrast, while light frosts can occur, a hard freeze where temperatures drop to 28°F (−2°C) or below is rare, happening only every couple of years on average.

The following table contains the monthly climate normals and record extremes for Queen Creek.

Climate data for Queen Creek, Arizona (Phoenix-Mesa Gateway Airport), 1991–2020 normals, extremes 1948–present
MonthJanFebMarAprMayJunJulAugSepOctNovDecYear
Record high °F (°C)88
(31)
92
(33)
99
(37)
106
(41)
114
(46)
119
(48)
119
(48)
116
(47)
113
(45)
107
(42)
94
(34)
83
(28)
119
(48)
Mean maximum °F (°C)75
(24)
79
(26)
88
(31)
97
(36)
105
(41)
113
(45)
114
(46)
112
(44)
107
(42)
99
(37)
85
(29)
74
(23)
115
(46)
Mean daily maximum °F (°C)66.5
(19.2)
69.6
(20.9)
76.9
(24.9)
84.8
(29.3)
93.9
(34.4)
103.1
(39.5)
104.9
(40.5)
103.5
(39.7)
98.5
(36.9)
87.0
(30.6)
74.7
(23.7)
65.4
(18.6)
85.7
(29.8)
Daily mean °F (°C)54.2
(12.3)
57.0
(13.9)
63.3
(17.4)
70.1
(21.2)
79.1
(26.2)
87.8
(31.0)
92.2
(33.4)
91.1
(32.8)
85.8
(29.9)
73.5
(23.1)
61.6
(16.4)
53.3
(11.8)
72.4
(22.4)
Mean daily minimum °F (°C)41.9
(5.5)
44.4
(6.9)
49.6
(9.8)
55.5
(13.1)
64.2
(17.9)
72.4
(22.4)
79.5
(26.4)
78.7
(25.9)
73.0
(22.8)
60.0
(15.6)
48.5
(9.2)
41.2
(5.1)
59.1
(15.1)
Mean minimum °F (°C)31
(−1)
34
(1)
39
(4)
45
(7)
53
(12)
63
(17)
72
(22)
71
(22)
63
(17)
48
(9)
36
(2)
30
(−1)
28
(−2)
Record low °F (°C)15
(−9)
22
(−6)
26
(−3)
32
(0)
37
(3)
49
(9)
58
(14)
55
(13)
42
(6)
30
(−1)
22
(−6)
19
(−7)
15
(−9)
Average precipitation inches (mm)0.91
(23)
1.02
(26)
0.88
(22)
0.27
(6.9)
0.18
(4.6)
0.06
(1.5)
1.08
(27)
1.11
(28)
0.69
(18)
0.57
(14)
0.63
(16)
0.88
(22)
8.28
(210)
Average precipitation days (≥ 0.01 in)3.93.72.91.41.10.43.74.12.52.12.23.531.5
Source 1: NOAA [9]
Source 2: Western Regional Climate Center [10]

Demographics

Historical population
CensusPop.Note
1980 1,378
1990 2,66793.5%
2000 4,31661.8%
2010 26,361510.8%
2020 59,519125.8%
2025 (est.)87,006 [5] 46.2%
U.S. Decennial Census [11]
2020 Census [4]

2020 census

Queen Creek town, Arizona – Racial composition
Note: the US Census treats Hispanic/Latino as an ethnic category. This table excludes Latinos from the racial categories and assigns them to a separate category. Hispanics/Latinos may be of any race.
Race (NH = Non-Hispanic)2020 [12] 2010 [13] 2000 [14] 1990 [15]
White alone (NH)72.6%
(43,202)
74%
(19,516)
67.7%
(2,921)
67.8%
(1,807)
Black alone (NH)3.2%
(1,875)
3.2%
(841)
0.3%
(14)
1%
(27)
American Indian alone (NH)0.6%
(377)
0.5%
(123)
0.5%
(22)
0.8%
(21)
Asian alone (NH)2.4%
(1,430)
2.7%
(709)
0.3%
(14)
0.7%
(19)
Pacific Islander alone (NH)0.2%
(98)
0.1%
(31)
0.1%
(3)
Other race alone (NH)0.4%
(250)
0.1%
(30)
0%
(1)
0.3%
(9)
Multiracial (NH)4.5%
(2,651)
2.1%
(545)
1.1%
(47)
Hispanic/Latino (any race)16.2%
(9,636)
17.3%
(4,566)
30%
(1,294)
29.4%
(784)

As of the 2020 census, there were 59,519 people, 17,965 households, and 15,549 families residing in the town. [16] The population density was 1,476.3 inhabitants per square mile (570.0/km2). There were 19,628 housing units. The racial makeup of the town was 77.2% White, 3.3% African American, 0.9% Native American, 2.5% Asian, 0.2% Pacific Islander, 4.2% from some other races and 11.7% from two or more races. Hispanic or Latino of any race were 16.2% of the population. [17] 30.8% of residents were under the age of 18, 6.3% were under 5 years of age, and 12.6% were 65 and older.

2010 census

As of the 2010 census, there were 26,361 people, 7,720 households, 6,557 families residing in the town. The population density was 940.1 inhabitants per square mile (363.0/km2). There were 8,557 housing units at an average density of 49.6 per square mile (19.2/km2). The racial makeup of the town was 83.6% White, 3.4% African American, 0.7% Native American, 2.8% Asian, 0.1% Pacific Islander, 5.8% from some other races and 3.6% from two or more races. Hispanic or Latino of any race were 17.3% of the population.

There were 7,720 households, out of which 50.7% had children under the age of 18 living with them, 75.9% were married couples living together, 7.2% had a female householder with no husband present, and 11.8% were non-families. 8.0% of all households were made up of individuals, and 2.8% had someone living alone who was 65 years of age or older. The average household size was 3.54 and the average family size was 3.77.

In the town, the population age spread was: 35.4% under the age of 18, 8.7% from 18 to 24, 30.1% from 25 to 44, 20.9% from 45 to 64, and 4.8% who were 65 years of age or older. The median age was 31 years. For every 100 females, there were 104.8 males. For every 100 females age 18 and over, there were 105.3 males.

The median income for a household in the town was $63,702, and the median income for a family was $65,679. Males had a median income of $45,000 versus $31,447 for females. The per capita income for the town was $21,592. About 6.0% of families and 9.2% of the population were below the poverty line, including 10.0% of those under age 18 and 6.5% of those age 65 or over.

Education

The town of Queen Creek is served by six public school districts, as well as public charter schools and a private school.

The portion in Maricopa County is mostly in the Queen Creek Unified School District, with portions in the Higley Unified School District and the Chandler Unified School District. [18]

The portion in Pinal County is divided between the Florence Unified School District, J. O. Combs Unified School District, and the Apache Junction Unified School District. [19]

Elementary

  • Auxier Elementary
  • Cortina Elementary
  • Desert Mountain Elementary
  • Faith Mather Sossaman Elementary
  • Frances Brandon-Pickett Elementary
  • Jack Barnes Elementary
  • Katherine Mecham Barney Elementary
  • Queen Creek Elementary
  • Schnepf Elementary

Junior/Senior High

Public Charter Schools

Higher Education

Rittenhouse Elementary School/San Tan Historical Society Museum

Transportation

Queen Creek is a member of Valley Metro. [21] Queen Creek is not currently served by scheduled service. Valley Metro provides vanpools in Queen Creek. [22]

Notable people

Historic properties

There are various properties in the town of Queen Creek which are considered historical and have been included either in the National Register of Historic Places [24] or listed as such by the San Tan Historical Society. The following are images of some of these properties with a short description of the same.

See also

References

  1. "Mayor Julia Wheatley". Town of Queen Creek. Archived from the original on March 21, 2025. Retrieved May 24, 2025.
  2. 1 2 "2023 U.S. Gazetteer Files". United States Census Bureau. Retrieved February 10, 2024.
  3. 1 2 U.S. Geological Survey Geographic Names Information System: Queen Creek, Arizona
  4. 1 2 3 "Explore Census Data". United States Census Bureau . Retrieved February 10, 2024.
  5. 1 2 "City and Town Population Totals: 2020-2023". United States Census Bureau. May 29, 2024. Retrieved May 29, 2024.
  6. "Queen Creek (AZ) sales tax rate" . Retrieved February 10, 2024.
  7. 1 2 Granger, Byrd Howell (1983). Arizona's Names (X Marks the Place). Tucson, AZ: The Falconer Publishing Company. pp. 508 & 525. ISBN   0918080185.
  8. "Queen Creek Approves Annexation at March 7 Town Council Meeting". Town of Queen Creek, Arizona. March 8, 2018.
  9. "NOWData - NOAA Online Weather Data". National Oceanic and Atmospheric Administration. Retrieved December 2, 2025.
  10. "PHOENIX MESA GATEWAY AP, ARIZONA". Western Regional Climate Center. Retrieved December 2, 2025.
  11. "Census of Population and Housing". census.gov. Retrieved June 4, 2015.
  12. "HISPANIC OR LATINO, AND NOT HISPANIC OR LATINO BY RACE (2020)". data.census.gov. U.S. Census Bureau.
  13. "HISPANIC OR LATINO, AND NOT HISPANIC OR LATINO BY RACE (2010)". data.census.gov. U.S. Census Bureau.
  14. Arizona: 2000 (PDF). U.S. Census Bureau. pp. 34–35.
  15. Arizona: 1990 (PDF). U.S. Census Bureau. p. 20.
  16. "US Census Bureau, Table P16: Household Type". United States Census Bureau. Retrieved May 29, 2024.
  17. "How many people live in Queen Creek town, Arizona". USA Today. Retrieved May 29, 2024.
  18. "2020 CENSUS - SCHOOL DISTRICT REFERENCE MAP: Maricopa County, AZ" (PDF). United States Census Bureau. p. 7 (PDF p. 8/11). Archived (PDF) from the original on October 9, 2022. Retrieved November 8, 2024. - Text list
  19. "2020 CENSUS - SCHOOL DISTRICT REFERENCE MAP: Pinal County, AZ" (PDF). U.S. Census Bureau . Retrieved November 7, 2024. - Text list
  20. "Communiversity at Queen Creek". riosalado.edu. Archived from the original on March 6, 2016. Retrieved January 28, 2016.
  21. "Overview | Valley Metro". Archived from the original on December 4, 2020. Retrieved August 24, 2025.
  22. "Town of Queen Creek - Multimodal transportation master plan". Archived from the original on March 9, 2025.
  23. "Revolution sign rookie goalkeeper Donovan Parisian". New England Revolution . January 3, 2025. Retrieved January 7, 2026.
  24. "National Register of Historical Places – Arizona (AZ), Maricopa County". National Register of Historic Places . Retrieved January 28, 2016.