Washington's 5th congressional district | |
---|---|
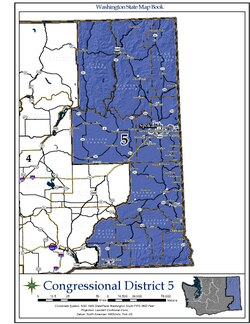
![]() Interactive map of district boundaries since January 3, 2023. Points indicate major cities in the district (Spokane, Spokane Valley, Pullman, and Walla Walla respectively). | |
Representative | |
Population (2023) | 788,598 |
Median household income | $71,773 [1] |
Ethnicity |
|
Cook PVI | R+8 [2] |
Washington's 5th congressional district encompasses the Eastern Washington counties of Ferry, Stevens, Pend Oreille, Lincoln, Spokane, Whitman, Walla Walla, Columbia, Garfield, and Asotin, along with parts of Adams and Franklin. It is centered on Spokane, the state's second largest city.
Since 2025, the 5th district has been represented in the U.S. House of Representatives by Michael Baumgartner, a Republican. The seat was held by former Democratic Speaker of the House Tom Foley between 1965 and 1995 before he lost reelection to reelection to George Nethercutt in 1994.
In presidential elections, the 5th district was once fairly competitive, but in recent years has generally been a safe bet for the Republicans. John McCain only narrowly won the district in 2008 with 52% of the vote. Mitt Romney won the district with 56% in 2012, while Donald Trump won this district all three times he ran, with 53% in both 2016 and 2020, and 54% in 2024.
The first election in the 5th district was in 1914, won by Democrat Clarence Dill. Following the 1910 census, Washington gained two seats in the U.S. House, from three to five, but did not reapportion for the 1912 election. The two new seats were elected as statewide at-large, with each voter casting ballots for three congressional seats, their district and two at-large. After that election, the state was reapportioned to five districts for the 1914 election. The state's 6th district was added after the 1930 census and first contested in the 1932 election.
Year | Office | Results [3] [4] [5] |
---|---|---|
2008 | President | McCain 52% - 46% |
2010 | Senate | Rossi 59% - 41% |
2012 | President | Romney 56% - 44% |
2016 | President | Trump 53% - 39% |
Senate | Vance 53% - 47% | |
Governor | Bryant 56% - 44% | |
Lt. Governor | McClendon 60% - 40% | |
Secretary of State | Wyman 66% - 34% | |
Auditor | Miloscia 58% - 42% | |
Attorney General | Ferguson 56% - 44% | |
2018 | Senate | Hutchison 53% - 47% |
2020 | President | Trump 53% - 43% |
Governor | Culp 58% - 42% | |
Secretary of State | Wyman 63% - 37% | |
Treasurer | Davidson 59% - 41% | |
Auditor | Leyba 55% - 45% | |
Attorney General | Larkin 56% - 43% | |
2022 | Senate | Smiley 58% - 42% |
Secretary of State (Spec.) | Anderson 55% - 38% | |
2024 | President | Trump 54% - 43% |
Senate | Garcia 54% - 45% | |
Governor | Reichert 58% - 42% | |
Lt. Governor | Matthews 59% - 40% | |
Secretary of State | Whitaker 56% - 44% | |
Treasurer | Hanek 57% - 43% | |
Auditor | Hawkins 57% - 43% | |
Attorney General | Serrano 59% - 41% | |
Commissioner of Public Lands | Herrera Beutler 61% - 39% |
For the 118th and successive Congresses (based on redistricting following the 2020 census), the district contains all or portions of the following counties and communities: [6]
AdamsCounty (4)
AsotinCounty (5)
ColumbiaCounty (2)
FerryCounty (12)
FranklinCounty (7)
GarfieldCounty (2)
LincolnCounty (8)
SpokaneCounty (20)
StevensCounty (11)
Walla WallaCounty (10)
WhitmanCounty (17)
Party | Candidate | Votes | % | |
---|---|---|---|---|
Republican | Cathy McMorris Rodgers (Incumbent) | 191,066 | 61.9 | |
Democratic | Rich Cowan | 117,512 | 38.1 | |
Total votes | 308,578 | 100.0 |
Party | Candidate | Votes | % | |
---|---|---|---|---|
Republican | Cathy McMorris Rodgers (incumbent) | 135,470 | 60.7 | |
Democratic | Joseph Pakootas | 87,772 | 39.3 | |
Total votes | 223,242 | 100.0 | ||
Republican hold |
Party | Candidate | Votes | % | |
---|---|---|---|---|
Republican | Cathy McMorris Rodgers (incumbent) | 192,959 | 59.6 | |
Democratic | Joe Pakootas | 130,575 | 40.4 | |
Total votes | 323,534 | 100.0 | ||
Republican hold |
Party | Candidate | Votes | % | |
---|---|---|---|---|
Republican | Cathy McMorris Rodgers (incumbent) | 175,422 | 54.8 | |
Democratic | Lisa Brown | 144,925 | 45.2 | |
Total votes | 320,347 | 100.0 | ||
Republican hold |
Party | Candidate | Votes | % | |
---|---|---|---|---|
Republican | Cathy McMorris Rodgers (incumbent) | 247,815 | 61.3 | |
Democratic | Dave Wilson | 155,737 | 38.5 | |
Write-in | 808 | 0.2 | ||
Total votes | 404,360 | 100 | ||
Republican hold |
Party | Candidate | Votes | % | |
---|---|---|---|---|
Republican | Cathy McMorris Rodgers (incumbent) | 188,648 | 59.5 | |
Democratic | Natasha Hill | 127,585 | 40.3 | |
Write-in | 773 | 0.2 | ||
Total votes | 317,006 | 100 | ||
Republican hold |
Party | Candidate | Votes | % | |
---|---|---|---|---|
Republican | Michael Baumgartner | 240,619 | 60.6 | |
Democratic | Carmela Conroy | 156,074 | 39.3 | |
Write-in | 753 | 0.1 | ||
Total votes | 422,622 | 100 | ||
Republican hold |