The 2011 Basildon Council election took place on 5 May 2011 to elect members of Basildon Borough Council in Essex, England. One third of the council was up for election and the Conservative party stayed in overall control of the council. [1]
Borough status in the United Kingdom is granted by royal charter to local government districts in England, Wales and Northern Ireland. The status is purely honorary, and does not give any additional powers to the council or inhabitants of the district. In Scotland, similarly chartered communities were known as royal burghs, although the status is no longer granted.
Essex is a county in the south-east of England, north-east of London. One of the home counties, it borders Suffolk and Cambridgeshire to the north, Hertfordshire to the west, Kent across the estuary of the River Thames to the south, and London to the south-west. The county town is Chelmsford, the only city in the county. For government statistical purposes Essex is placed in the East of England region.
England is a country that is part of the United Kingdom. It shares land borders with Wales to the west and Scotland to the north-northwest. The Irish Sea lies west of England and the Celtic Sea lies to the southwest. England is separated from continental Europe by the North Sea to the east and the English Channel to the south. The country covers five-eighths of the island of Great Britain, which lies in the North Atlantic, and includes over 100 smaller islands, such as the Isles of Scilly and the Isle of Wight.
After the election, the composition of the council was
The results saw the Conservatives stay in control of the council after retaining all of the seats they had been defending. [3] This left the Conservatives with 29 seats, compared to 11 for Labour. [4] Meanwhile, the Liberal Democrats were reduced to 2 councillors and the party lost vote share across the council. [5] Overall turnout in the election was 35%. [6]
The Labour Party is a centre-left political party in the United Kingdom which has been described as an alliance of social democrats, democratic socialists and trade unionists. The party's platform emphasises greater state intervention, social justice and strengthening workers' rights.
The Liberal Democrats are a liberal political party in the United Kingdom. They presently have 11 Members of Parliament in the House of Commons, 96 members of the House of Lords, and one member of the European Parliament. They also have five Members of the Scottish Parliament and a member each in the Welsh Assembly and London Assembly. The party reached the height of its influence in the early 2010s, forming a junior partner in a coalition government from 2010 to 2015. It is presently led by Vince Cable.
A Councillor is a member of a local government council.
The only change in the election saw Labour gain 1 seat from the Liberal Democrats in Nethermayne, with the winning Labour candidate, Andrew Gordon, becoming the youngest councillor at the age of 18. [5] Among the other winners was Daniel Munyambu for Labour in Vange, who became the second Kenyan to be elected as a councillor in the United Kingdom, [7] and the former council leader Nigel Smith who returned to the council in Lee Chapel North. [5]
Vange is a former village now subsumed within the urban area of the Basildon Borough of Essex. As it is much smaller than Basildon, Laindon and Pitsea, it does not have its own town centre or railway station. The London Road (B1464) is the main road through Vange and used to be part of the A13 until it was bypassed in the 1970s. The population of the Vange ward within the Basildon Borough taken at the 2011 Census was 10,048.
The United Kingdom, officially the United Kingdom of Great Britain and Northern Ireland but more commonly known as the UK or Britain, is a sovereign country lying off the north-western coast of the European mainland. The United Kingdom includes the island of Great Britain, the north-eastern part of the island of Ireland and many smaller islands. Northern Ireland is the only part of the United Kingdom that shares a land border with another sovereign state—the Republic of Ireland. Apart from this land border, the United Kingdom is surrounded by the Atlantic Ocean, with the North Sea to the east, the English Channel to the south and the Celtic Sea to the south-west, giving it the 12th-longest coastline in the world. The Irish Sea lies between Great Britain and Ireland. With an area of 242,500 square kilometres (93,600 sq mi), the United Kingdom is the 78th-largest sovereign state in the world. It is also the 22nd-most populous country, with an estimated 66.0 million inhabitants in 2017.
Party | Seats | Gains | Losses | Net gain/loss | Seats % | Votes % | Votes | +/− | |
---|---|---|---|---|---|---|---|---|---|
Conservative | 8 | 0 | 0 | 0 | 53.3 | 46.0 | 19,430 | -3.6% | |
Labour | 7 | 1 | 0 | +1 | 46.7 | 32.1 | 13,532 | +10.7% | |
Liberal Democrat | 0 | 0 | 1 | -1 | 0 | 8.9 | 3,766 | -9.4% | |
UKIP | 0 | 0 | 0 | 0 | 0 | 8.2 | 3,475 | +4.7% | |
Independent | 0 | 0 | 0 | 0 | 0 | 3.2 | 1,336 | +3.2% | |
BNP | 0 | 0 | 0 | 0 | 0 | 0.8 | 356 | -6.4% | |
National Front | 0 | 0 | 0 | 0 | 0 | 0.6 | 244 | +0.6% | |
None of The Above | 0 | 0 | 0 | 0 | 0 | 0.1 | 63 | +0.1% | |
Party | Candidate | Votes | % | ± | |
---|---|---|---|---|---|
Conservative | David Dadds | 2,626 | 64.6 | +3.5 | |
Labour | Patricia Reid | 567 | 13.9 | +2.9 | |
Liberal Democrat | Nigel Horn | 528 | 13.0 | -7.3 | |
UKIP | Susan McCaffery | 346 | 8.5 | +3.9 | |
Majority | 2,059 | 50.6 | +9.9 | ||
Turnout | 4,067 | 44.2 | -30 | ||
Conservative hold | Swing | ||||
Party | Candidate | Votes | % | ± | |
---|---|---|---|---|---|
Conservative | Stephen Horgan | 2,416 | 59.3 | -3.9 | |
UKIP | Terry Gandy | 665 | 16.3 | +12.7 | |
Labour | Geoffrey Bores | 584 | 14.3 | +3.0 | |
Liberal Democrat | John James | 407 | 10.0 | -8.6 | |
Majority | 1,751 | 43.0 | -1.6 | ||
Turnout | 4,072 | 43.5 | -30 | ||
Conservative hold | Swing | ||||
Party | Candidate | Votes | % | ± | |
---|---|---|---|---|---|
Conservative | Kevin Blake | 2,330 | 62.9 | +4.6 | |
Labour | Sandra Bennett | 615 | 16.6 | +5.1 | |
Liberal Democrat | Stewart Goshawk | 393 | 10.6 | -6.1 | |
UKIP | Cherry Young | 367 | 9.9 | +0.5 | |
Majority | 1,715 | 46.3 | +4.8 | ||
Turnout | 3,705 | 43.6 | -29 | ||
Conservative hold | Swing | ||||
Party | Candidate | Votes | % | ± | |
---|---|---|---|---|---|
Labour | Allan Davies | 1,365 | 27.6 | ||
Labour | David Kirkman | 1,190 | 24.1 | ||
Conservative | Gwen Ball | 806 | 16.3 | ||
Conservative | James Paton | 588 | 11.9 | ||
UKIP | David Sheppard | 365 | 7.4 | ||
BNP | Len Heather | 356 | 7.2 | ||
Liberal Democrat | Arnold Lutton | 269 | 5.4 | ||
Turnout | 4,939 | 30.1 | -26 | ||
Labour hold | Swing | ||||
Party | Candidate | Votes | % | ± | |
---|---|---|---|---|---|
Conservative | Jilly Hyde | 1,318 | 49.1 | +6.0 | |
Labour | John McCrea | 1,166 | 43.4 | +13.2 | |
Liberal Democrat | Colin Grant | 201 | 7.5 | -9.3 | |
Majority | 152 | 5.7 | -7.2 | ||
Turnout | 2,685 | 32.3 | -27 | ||
Conservative hold | Swing | ||||
Party | Candidate | Votes | % | ± | |
---|---|---|---|---|---|
Labour | Nigel Smith | 1,408 | 54.9 | +17.5 | |
Conservative | Christine Hedley | 740 | 28.8 | -5.1 | |
National Front | Thomas Beaney | 244 | 9.5 | +9.5 | |
Liberal Democrat | Emma Peall | 173 | 6.7 | -10.9 | |
Majority | 668 | 26.0 | +22.5 | ||
Turnout | 2,565 | 29.2 | -26 | ||
Labour hold | Swing | ||||
Party | Candidate | Votes | % | ± | |
---|---|---|---|---|---|
Labour | Andrew Gordon | 926 | 30.2 | +6.5 | |
Liberal Democrat | Phil Jenkins | 752 | 24.5 | -11.9 | |
Conservative | Stephen Foster | 709 | 23.1 | -8.1 | |
UKIP | Kerry Smith | 619 | 20.2 | +20.2 | |
Independent | None of the Above X | 63 | 2.1 | +2.1 | |
Majority | 174 | 5.7 | |||
Turnout | 3,069 | 34.9 | -28 | ||
Labour gain from Liberal Democrat | Swing | ||||
Party | Candidate | Votes | % | ± | |
---|---|---|---|---|---|
Labour | Keith Bobbin | 1,111 | 47.3 | +16.2 | |
Conservative | Danny Lawrence | 702 | 29.9 | -4.2 | |
UKIP | Terry McBride | 391 | 16.7 | +7.4 | |
Liberal Democrat | Martin Howard | 143 | 6.1 | -9.8 | |
Majority | 409 | 17.4 | |||
Turnout | 2,347 | 25.5 | -27 | ||
Labour hold | Swing | ||||
Party | Candidate | Votes | % | ± | |
---|---|---|---|---|---|
Conservative | Mo Larkin | 1,197 | 43.6 | +3.9 | |
Labour | Mark Walker | 1,056 | 38.4 | +6.6 | |
UKIP | Imelda Clancy | 384 | 14.0 | +5.5 | |
Liberal Democrat | Vivien Howard | 110 | 4.0 | -7.6 | |
Majority | 141 | 5.1 | -2.9 | ||
Turnout | 2,747 | 32.3 | -26 | ||
Conservative hold | Swing | ||||
Party | Candidate | Votes | % | ± | |
---|---|---|---|---|---|
Labour | Patricia Rackley | 1,004 | 57.8 | +19.7 | |
Conservative | Andrew Schrader | 557 | 32.0 | +3.2 | |
Liberal Democrat | Michael Dickinson | 177 | 10.2 | -1.3 | |
Majority | 447 | 25.7 | +16.4 | ||
Turnout | 1,738 | 29.5 | +6 | ||
Labour hold | Swing | ||||
Party | Candidate | Votes | % | ± | |
---|---|---|---|---|---|
Labour | Daniel Munyambu | 1,089 | 52.3 | +21.4 | |
Conservative | Andrew Morris | 554 | 26.6 | -9.2 | |
UKIP | Kim Gandy | 338 | 16.2 | +16.2 | |
Liberal Democrat | Elizabeth Grant | 102 | 4.9 | -1.4 | |
Majority | 535 | 25.7 | |||
Turnout | 2,083 | 30.6 | +7 | ||
Labour hold | Swing | ||||
Party | Candidate | Votes | % | ± | |
---|---|---|---|---|---|
Conservative | Sylvia Buckley | 1,434 | 59.7 | +0.4 | |
Independent | Alan Ball | 446 | 18.6 | +18.6 | |
Labour | Sarah Davies | 397 | 16.5 | -0.8 | |
Liberal Democrat | Tony Morris | 127 | 5.3 | -11.6 | |
Majority | 988 | 41.1 | -0.9 | ||
Turnout | 2,404 | 38.9 | -30 | ||
Conservative hold | Swing | ||||
Party | Candidate | Votes | % | ± | |
---|---|---|---|---|---|
Conservative | Michael Mowe | 1,925 | 54.1 | -4.0 | |
Independent | Dave Harrison | 890 | 25.0 | +25.0 | |
Labour | Thomas Kirkman | 590 | 16.6 | +0.2 | |
Liberal Democrat | John Spriggs | 155 | 4.4 | -13.0 | |
Majority | 1,035 | 29.1 | -11.6 | ||
Turnout | 3,560 | 37.3 | -29 | ||
Conservative hold | Swing | ||||
Party | Candidate | Votes | % | ± | |
---|---|---|---|---|---|
Conservative | Chris Jackman | 1,528 | 68.8 | +10.1 | |
Labour | Andrew Buxton | 464 | 20.9 | +5.3 | |
Liberal Democrat | John McGarrigle | 229 | 10.3 | -8.2 | |
Majority | 1,064 | 47.9 | +7.7 | ||
Turnout | 2,221 | 32.1 | -32 | ||
Conservative hold | Swing | ||||
The 2008 Wokingham Borough Council election took place on 1 May 2008 to elect members of Wokingham Unitary Council in Berkshire, England. One third of the council was up for election and the Conservative party stayed in overall control of the council.
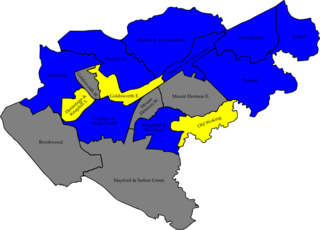
The 2007 Woking Council election took place on 3 May 2007 to elect members of Woking Borough Council in Surrey, England. One third of the council was up for election and the Conservative party gained overall control of the council from no overall control.
The 2004 Welwyn Hatfield District Council election took place on 10 June 2004 to elect members of Welwyn Hatfield District Council in Hertfordshire, England. One third of the council was up for election and the Conservative party stayed in overall control of the council.
The 2008 Fareham Council election took place on 1 May 2008 to elect members of Fareham Borough Council in Hampshire, England. Half of the council was up for election and the Conservative party stayed in overall control of the council.
The 1999 Solihull Metropolitan Borough Council election took place on 6 May 1999 to elect members of Solihull Metropolitan Borough Council in the West Midlands, England. One third of the council was up for election and the council stayed under no overall control.
The 2007 Pendle Borough Council election took place on 3 May 2007 to elect members of Pendle Borough Council in Lancashire, England. One third of the council was up for election and the Liberal Democrats stayed in overall control of the council.
The 2007 Sandwell Metropolitan Borough Council election took place on 3 May 2007 to elect members of Sandwell Metropolitan Borough Council in the West Midlands, England. One third of the council was up for election and the Labour party stayed in overall control of the council.
The 2006 Maidstone Borough Council election took place on 4 May 2006 to elect members of Maidstone Borough Council in Kent, England. One third of the council was up for election and the council stayed under no overall control.
The 1999 Basildon District Council election took place on 6 May 1999 to elect members of Basildon District Council in Essex, England. One third of the council was up for election and the Labour party stayed in overall control of the council.
The 2000 Basildon District Council election took place on 4 May 2000 to elect members of Basildon District Council in Essex, England. One third of the council was up for election and the Labour party lost overall control of the council to no overall control.
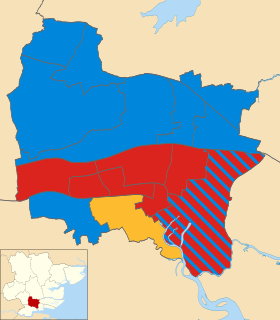
The 2002 Basildon District Council election took place on 2 May 2002 to elect members of Basildon District Council in Essex, England. The whole council was up for election with boundary changes since the last election in 2000. The council stayed under no overall control.
The 2003 Basildon District Council election took place on 1 May 2003 to elect members of Basildon District Council in Essex, England. One third of the council was up for election and the Conservative party gained overall control of the council from no overall control.
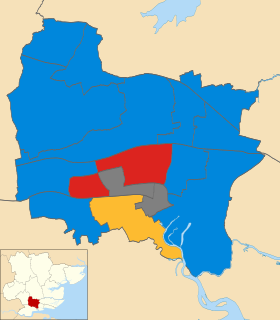
The 2006 Basildon District Council election took place on 4 May 2006 to elect members of Basildon District Council in Essex, England. One third of the council was up for election and the Conservative party stayed in overall control of the council.
The 2007 Basildon District Council election took place on 3 May 2007 to elect members of Basildon District Council in Essex, England. One third of the council was up for election and the Conservative party stayed in overall control of the council.
The 2008 Basildon District Council election took place on 1 May 2008 to elect members of Basildon District Council in Essex, England. One third of the council was up for election and the Conservative party stayed in overall control of the council.
The 2010 Basildon District Council election took place on 6 May 2010 to elect members of Basildon District Council in Essex, England. One third of the council was up for election and the Conservative party stayed in overall control of the council.
The 2007 Basingstoke and Deane Council election took place on 3 May 2007 to elect members of Basingstoke and Deane Borough Council in Hampshire, England. One third of the council was up for election and the Conservative party stayed in overall control of the council.
The 2007 Walsall Metropolitan Borough Council election took place on 3 May 2007 to elect members of Walsall Metropolitan Borough Council in the West Midlands, England. One third of the council was up for election and the Conservative party stayed in overall control of the council.
The 2003 Hertsmere Borough Council election took place on 1 May 2003 to elect members of Hertsmere Borough Council in Hertfordshire, England. One third of the council was up for election and the Conservative party stayed in overall control of the council.
The 2007 Hertsmere Borough Council election took place on 3 May 2007 to elect members of Hertsmere Borough Council in Hertfordshire, England. One third of the council was up for election and the Conservative party stayed in overall control of the council.