The 2014 Basildon District Council election took place on 22 May 2014 to elect members of Basildon District Council in England. [1] This was on the same day as other local elections and elections to the European Parliament. This election was to elect one third of the council, plus one additional seat which was vacant. These seats were last up for election in 2010.
Party | Seats | Gains | Losses | Net gain/loss | Seats % | Votes % | Votes | +/− | |
---|---|---|---|---|---|---|---|---|---|
UKIP | 9 | 9 | 0 | +9 | 60.0 | 39.2 | 16,087 | +35.7 | |
Conservative | 4 | 0 | -7 | -7 | 26.7 | 33.8 | 13,877 | -15.8 | |
Labour | 2 | 0 | -3 | -3 | 13.3 | 21.9 | 9,011 | +0.6 | |
Liberal Democrat | 0 | 0 | 0 | 0 | 0 | 4.7 | 1,937 | -13.6 | |
National Front | 0 | 0 | 0 | 0 | 0 | 0.2 | 101 | N/A | |
TUSC | 0 | 0 | 0 | 0 | 0 | 0.1 | 39 | N/A | |
Independent | 0 | 0 | 0 | 0 | 0 | 0.1 | 36 | N/A |
The turnout was 32.8%, and there were 160 ballots rejected.
Prior to election, the composition of the council was:
24 | 11 | 4 | 2 | 1 |
Conservative | Labour | IND | L | UK |
After election, the composition of the council was:
17 | 12 | 9 | 3 | 1 |
Conservative | UKIP | Labour | IND | L |
UK - UKIP
IND - Independent
L - Liberal Democrats
Party | Candidate | Votes | % | ± | |
---|---|---|---|---|---|
Conservative | Andrew Schrader | 1,724 | 50.8 | -10.3 | |
UKIP | Terry Gandy | 987 | 29.1 | +24.5 | |
Labour | Patricia Reid | 414 | 12.2 | +1.2 | |
Liberal Democrat | Nigel Horn | 266 | 7.8 | -12.5 | |
Majority | 737 | 21.7 | |||
Turnout | 3,404 | 36.3 | |||
Conservative hold | Swing | ||||
Party | Candidate | Votes | % | ± | |
---|---|---|---|---|---|
Conservative | Anthony Hedley* | 1,912 | 57.7 | -5.5 | |
UKIP | Susan McCaffery | 868 | 26.2 | +22.6 | |
Labour | Andrew Ansell | 344 | 10.4 | -0.9 | |
Liberal Democrat | Jenny Cole | 192 | 5.8 | -12.8 | |
Majority | 1,044 | 31.5 | |||
Turnout | 3,326 | 35.2 | |||
Conservative hold | Swing | ||||
Party | Candidate | Votes | % | ± | |
---|---|---|---|---|---|
Conservative | Andrew Baggott | 1,798 | 55.0 | -3.3 | |
UKIP | Paul Downes | 932 | 28.5 | +19.1 | |
Labour | Wendy Aitken | 382 | 11.7 | +0.2 | |
Liberal Democrat | Ben Williams | 156 | 4.8 | -11.9 | |
Majority | 866 | 26.5 | |||
Turnout | 3,284 | 38.0 | |||
Conservative hold | Swing | ||||
Party | Candidate | Votes | % | ± | |
---|---|---|---|---|---|
Conservative | Terri Sargeant* | 1,004 | 46.5 | -15.9 | |
UKIP | Clifford Hammans | 884 | 41.0 | N/A | |
Labour | Malcolm Reid | 270 | 12.5 | -3.2 | |
Majority | 120 | 5.6 | |||
Turnout | 2,166 | 33.7 | |||
Conservative hold | Swing | ||||
Party | Candidate | Votes | % | ± | |
---|---|---|---|---|---|
UKIP | David Sheppard | 1,199 | 42.9 | +37.5 | |
Labour | William Archibald* | 983 | 35.1 | -1.5 | |
Conservative | Ian Dwyer | 502 | 17.9 | -12.9 | |
Liberal Democrat | Colin Grant | 74 | 2.6 | -13.4 | |
TUSC | David Murray | 39 | 1.4 | N/A | |
Majority | 216 | 7.7 | |||
Turnout | 2,807 | 28.5 | |||
UKIP gain from Labour | Swing | ||||
Party | Candidate | Votes | % | ± | |
---|---|---|---|---|---|
UKIP | Mark Ellis | 1,122 | 41.0 | N/A | |
Labour | Lauren Brown | 885 | 32.3 | +2.1 | |
Conservative | John Dornan* | 599 | 21.9 | -21.2 | |
Liberal Democrat | Francis Barnes-Challinor | 112 | 4.1 | -12.7 | |
National Front | Anthony Harms | 21 | 0.8 | N/A | |
Majority | 237 | 8.7 | |||
Turnout | 2,747 | 30.3 | |||
UKIP gain from Conservative | Swing | ||||
Party | Candidate | Votes | % | ± | |
---|---|---|---|---|---|
UKIP | Linda Allport-Hodge | 1,033 | 40.9 | +34.5 | |
Conservative | Sandra Hillier* | 958 | 37.9 | -16.2 | |
Labour | Matthew Whaley | 425 | 16.8 | -1.5 | |
Liberal Democrat | Alan Richards | 111 | 4.4 | -11.6 | |
Majority | 75 | 3.0 | |||
Turnout | 2,538 | 36.0 | |||
UKIP gain from Conservative | Swing | ||||
Party | Candidate | Votes | % | ± | |
---|---|---|---|---|---|
UKIP | Frank Ferguson | 983 | 39.1 | N/A | |
UKIP | 'Trevor Malsbury | 924 | 36.8 | N/A | |
Labour | Alan Bennett* | 922 | 36.7 | -0.7 | |
Labour | Jenefer Taylor | 919 | 36.6 | N/A | |
Conservative | Andrew Barnes | 329 | 13.1 | -20.8 | |
Conservative | Nicole Stephens | 263 | 10.5 | N/A | |
Liberal Democrat | Phil Jenkins | 99 | 3.9 | -13.7 | |
Liberal Democrat | Steve Nice | 91 | 3.6 | N/A | |
National Front | Thomas Beaney | 80 | 3.2 | N/A | |
Majority | 2 | 0.1 | |||
Turnout | 2,530 | 26.5 | |||
UKIP gain from Labour | Swing | ||||
UKIP gain from Independent | Swing | ||||
The second vacancy was caused by the resignation of an Independent councillor who had been elected in 2012 as a Labour candidate. Malsbury will fill this seat, and will thus be up for re-election in May 2016. Ferguson will fill the seat that was ordinarily due for election in 2014, and will face re-election in 2018.
Party | Candidate | Votes | % | ± | |
---|---|---|---|---|---|
UKIP | Kerry Smith | 1,340 | 43.5 | N/A | |
Liberal Democrat | Linda Williams* | 700 | 22.7 | -13.7 | |
Labour | David Kirkman | 559 | 18.1 | -5.6 | |
Conservative | Colin Grant | 446 | 14.5 | -16.7 | |
Independent | None of the Above X | 36 | 1.2 | N/A | |
Majority | 640 | 20.8 | |||
Turnout | 3,085 | 34.1 | |||
UKIP gain from Liberal Democrat | Swing | ||||
Party | Candidate | Votes | % | ± | |
---|---|---|---|---|---|
UKIP | Imelda Clancy | 1,156 | 45.1 | +35.8 | |
Labour | Melissa McGeorge | 906 | 35.3 | +4.2 | |
Conservative | Luke Mackenzie | 427 | 16.7 | -17.4 | |
Liberal Democrat | Martin Howard | 73 | 2.8 | -13.1 | |
Majority | 250 | 9.8 | |||
Turnout | 2,573 | 27.5 | |||
UKIP gain from Conservative | Swing | ||||
Party | Candidate | Votes | % | ± | |
---|---|---|---|---|---|
UKIP | Stephen Ward | 1,061 | 37.9 | +29.4 | |
Labour | David Burton-Sampson | 966 | 34.5 | +2.7 | |
Conservative | David Abrahall* | 709 | 25.3 | -14.4 | |
Liberal Democrat | Vivien Howard | 63 | 2.3 | -9.3 | |
Majority | 95 | 3.4 | |||
Turnout | 2,815 | 31.4 | |||
UKIP gain from Conservative | Swing | ||||
Party | Candidate | Votes | % | ± | |
---|---|---|---|---|---|
UKIP | Alan Ball | 1,118 | 48.7 | N/A | |
Conservative | Malcolm Buckley* | 909 | 40.0 | -19.3 | |
Labour | Andrew Buxton | 269 | 11.7 | -5.6 | |
Majority | 209 | 9.1 | |||
Turnout | 2,312 | 36.6 | |||
UKIP gain from Conservative | Swing | ||||
Party | Candidate | Votes | % | ± | |
---|---|---|---|---|---|
UKIP | Peter Holliman | 1,487 | 44.8 | ||
Conservative | Tony Ball* | 1,357 | 40.9 | ||
Labour | Albert Ede | 475 | 14.3 | ||
Majority | 130 | 3.9 | |||
Turnout | 3,331 | 33.7 | |||
UKIP gain from Conservative | Swing | ||||
Party | Candidate | Votes | % | ± | |
---|---|---|---|---|---|
UKIP | David Harrison | 993 | 44.6 | N/A | |
Conservative | Donald Morris* | 940 | 42.2 | -16.5 | |
Labour | George Wake | 292 | 13.1 | -2.5 | |
Majority | 53 | 2.4 | |||
Turnout | 2,237 | 31.6 | |||
UKIP gain from Conservative | Swing | ||||
In December 2014, Kerry Smith, the then leader of the UKIP group and newly selected parliamentary candidate for South Basildon and East Thurrock resigned from the party after the release of a tape recording of a private phone call in which he made offensive remarks about fellow UKIP members. [2] Imelda Clancy also left the party later that month, and the two sit as "Independence Group" members on the council, reducing UKIP's strength to ten seats, though they remain the second-largest party ahead of Labour on nine seats. [3]
South Basildon and East Thurrock is a constituency represented in the House of Commons of the UK Parliament since its 2010 creation by Stephen Metcalfe, a Conservative.
A third independent councilor (originally elected as Labour) joined the Independence Group in January 2015.
The Social Democratic Party is a minor political party in the United Kingdom, established in 1990. It traces its origin to the Social Democratic Party (SDP) which was formed in 1981 by a group of dissident Labour Party Members of Parliament (MPs) and former MPs: Roy Jenkins, David Owen, Bill Rodgers and Shirley Williams, who became known as the ‘Gang of Four’. The original SDP merged with the Liberal Party in 1988 to form the Liberal Democrats, but Owen, two other MPs and a minority of party activists formed a breakaway group with the same name immediately afterward. That party continuing dissolved itself in 1990, but some activists met and voted to continue the party in defiance of its National Executive, leading to the creation of a new Social Democratic Party.
This article lists the election results and representation of the UK Independence Party with respect to the House of Commons of the United Kingdom, Scottish Parliament, National Assembly for Wales, Northern Ireland Assembly, London Assembly, European Parliament and local authorities.
Thanet District Council in Kent, England is elected every four years.
The 2008 Basildon District Council election took place on 1 May 2008 to elect members of Basildon District Council in Essex, England. One third of the council was up for election and the Conservative party stayed in overall control of the council.
The 2012 Plymouth City Council election took place on 3 May 2012 to elect members of Plymouth City Council in England. This was on the same day as other local elections. The election was won by the Labour Party, who gained control of the council from the Conservative Party.
The 2014 St Albans City and District Council election took place on 22 May 2014 to elect members of St Albans District Council in Hertfordshire, England. One third of the council was up for election and the council stayed under no overall control.
The 2014 Barking and Dagenham Council election took place on 23 May 2014 to elect members of Barking and Dagenham Council in England. This was on the same day as other local elections.
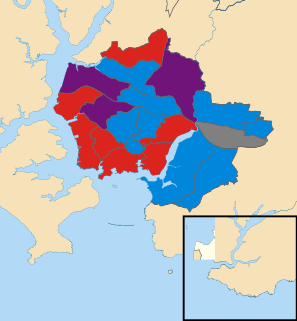
The 2014 Plymouth City Council election took place on 22 May 2014 to elect members of Plymouth City Council in England. This was on the same day as other local elections. The election was won by the Labour Party, who maintained their overall majority. The UK Independence Party gained representation on the council for the first time, and this was the only election in which the party won seats in Plymouth.
The 2014 Havant Borough Council election took place on 22 May 2014 to elect members of Havant Borough Council in Hampshire, England. One third of the council was up for election and the Conservative party stayed in overall control of the council.
The 2010 Huntingdonshire District Council election took place on 6 May 2010 to elect members of Huntingdonshire District Council in Cambridgeshire, England. One third of the council was up for election and the Conservative party stayed in overall control of the council.
The 2011 Huntingdonshire District Council election took place on 5 May 2011 to elect members of Huntingdonshire District Council in Cambridgeshire, England. One third of the council was up for election and the Conservative party stayed in overall control of the council.
The 2012 Huntingdonshire District Council election took place on 3 May 2012 to elect members of Huntingdonshire District Council in Cambridgeshire, England. One third of the council was up for election and the Conservative party stayed in overall control of the council.
The 2014 Castle Point Borough Council election took place on 22 May 2014 to elect members of Castle Point Borough Council in Essex, England. One third of the council was up for election and the Conservative Party lost overall control of the council to no overall control.
The 2014 Harlow District Council election took place on 22 May 2014 to elect members of Harlow District Council in Essex, England. One third of the council was up for election and the Labour party stayed in overall control of the council.
The by-thirds 2015 Rotherham Metropolitan Borough Council election took place on Thursday 7 May 2015, to elect approximately one third of the members of the Rotherham Metropolitan Borough Council in England as part of the United Kingdom local elections, 2015 held on the same day as the general election. All seats contested at this election were last contested in 2011, and of these, 20 were held by Labour Party councillors.
The 2015 Harlow District Council election took place on 7 May 2015 to elect members of Harlow District Council in Essex, England. One third of the council was up for election and Labour party councillors increased their control of the council as the governing group, gaining one councillor and suffering no losses.
The 2014 West Oxfordshire District Council election took place on 22 May 2014 to elect members of West Oxfordshire District Council in Oxfordshire, England. One third of the council was up for election and the Conservative party stayed in overall control of the council.
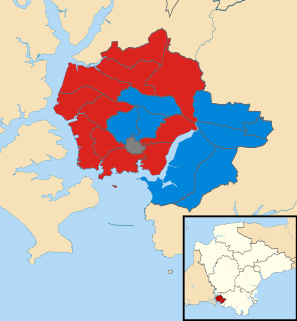
The 2016 Plymouth City Council election took place on 5 May 2016 to elect members of Plymouth City Council in England. The Conservatives gained one seat from Labour, resulting in both parties having twenty-seven members of the council. A coalition of Conservative and UKIP members took overall control of the Council, having thirty members in total and a working majority.
The 2018 Thurrock Council elections took place on 3 May 2018 to elect members of Thurrock Council in England. Councillors in 16 out of the 20 electoral wards were be up for election.The council remained under overall control, with a minority Conservative administration running the council.
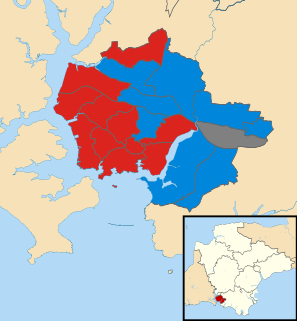
The 2018 Plymouth City Council election took place on 3 May 2018 to elect members of Plymouth City Council in England. The election was won by the Labour Party, who gained enough seats to achieve an overall majority and took control of the council.