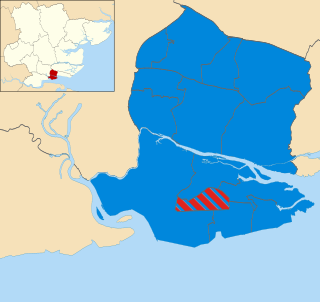
The 2006 Castle Point Borough Council election took place on 4 May 2006 to elect members of Castle Point Borough Council in Essex, England. One third of the council was up for election and the Conservative party stayed in overall control of the council. [1]
Castle Point is a local government district with borough status in south Essex, 30 miles (48 km) east of central London. The borough comprises the towns and villages of Canvey Island, Hadleigh, South Benfleet, and Thundersley where the council has its headquarters.
Borough status in the United Kingdom is granted by royal charter to local government districts in England, Wales and Northern Ireland. The status is purely honorary, and does not give any additional powers to the council or inhabitants of the district. In Scotland, similarly chartered communities were known as royal burghs, although the status is no longer granted.
Essex is a county in the south-east of England, north-east of London. One of the home counties, it borders Suffolk and Cambridgeshire to the north, Hertfordshire to the west, Kent across the estuary of the River Thames to the south, and London to the south-west. The county town is Chelmsford, the only city in the county. For government statistical purposes Essex is placed in the East of England region.
After the election, the composition of the council was
The Conservative Party, officially the Conservative and Unionist Party, is a centre-right political party in the United Kingdom. Presently led by Theresa May, it has been the governing party since 2010. It presently has 314 Members of Parliament in the House of Commons, 249 members of the House of Lords, and 18 members of the European Parliament. It also has 31 Members of the Scottish Parliament, 12 members of the Welsh Assembly, eight members of the London Assembly and 9,008 local councillors. One of the major parties of UK politics, it has formed the government on 45 occasions, more than any other party.
The Canvey Island Independent Party (CIIP) is a local political party active on Canvey Island, in Essex, England. It was established in 2004 to campaign for a separate district council for Canvey Island.
The Labour Party is a centre-left political party in the United Kingdom which has been described as an alliance of social democrats, democratic socialists and trade unionists. The party's platform emphasises greater state intervention, social justice and strengthening workers' rights.
The Conservative party stayed in control of the council but lost 5 seats on Canvey Island to the Canvey Island Independent Party. [3] The Conservatives won all 8 mainland seats that were contested, while the Canvey Island Independent Party won 5 of the 6 seats on the island. [4]
Party | Seats | Gains | Losses | Net gain/loss | Seats % | Votes % | Votes | +/− | |
---|---|---|---|---|---|---|---|---|---|
Conservative | 9 | 0 | 5 | -5 | 64.3 | 50.1 | 12,121 | +1.3% | |
Canvey Independent | 5 | 5 | 0 | +5 | 35.7 | 19.3 | 4,678 | +2.6% | |
Labour | 0 | 0 | 0 | 0 | 0 | 21.9 | 5,300 | -5.2% | |
Green | 0 | 0 | 0 | 0 | 0 | 6.7 | 1,634 | +0.4% | |
Liberal Democrat | 0 | 0 | 0 | 0 | 0 | 1.9 | 459 | +1.9% | |
PFRC | 0 | 0 | 0 | 0 | 0 | 0.1 | 25 | +0.1% |
Party | Candidate | Votes | % | ± | |
---|---|---|---|---|---|
Conservative | Pamela Freeman | 1,179 | 65.3 | +0.7 | |
Labour | Lorna Trollope | 627 | 34.7 | -0.7 | |
Majority | 552 | 30.6 | +1.5 | ||
Turnout | 1,806 | ||||
Conservative hold | Swing |
Party | Candidate | Votes | % | ± | |
---|---|---|---|---|---|
Conservative | Norman Smith | 1,202 | 63.4 | -0.5 | |
Labour | Anthony Wright | 381 | 20.1 | -2.3 | |
Liberal Democrat | Barry Newman | 314 | 16.6 | +16.6 | |
Majority | 821 | 43.3 | +1.8 | ||
Turnout | 1,897 | ||||
Conservative hold | Swing |
Party | Candidate | Votes | % | ± | |
---|---|---|---|---|---|
Canvey Independent | Peter May | 907 | 52.0 | +7.8 | |
Conservative | Jane King | 514 | 29.5 | +2.9 | |
Labour | Margaret Curtis-McArther | 267 | 15.3 | -11.5 | |
Green | Clifford Hughes | 55 | 3.2 | +0.8 | |
Majority | 393 | 22.5 | +5.1 | ||
Turnout | 1,743 | ||||
Canvey Independent gain from Conservative | Swing | ||||
Party | Candidate | Votes | % | ± | |
---|---|---|---|---|---|
Canvey Independent | Philip Davies | 772 | 44.1 | -1.6 | |
Conservative | Shirley Coates | 537 | 30.7 | +3.2 | |
Labour | Jacqueline Reilly | 373 | 21.3 | - -2.9 | |
Green | Irene Willis | 67 | 3.8 | +3.8 | |
Majority | 235 | 13.4 | -4.8 | ||
Turnout | 1,749 | ||||
Canvey Independent gain from Conservative | Swing | ||||
Party | Candidate | Votes | % | ± | |
---|---|---|---|---|---|
Canvey Independent | Nigel Harvey | 911 | 50.1 | +2.5 | |
Conservative | Patricia Haunts | 458 | 25.2 | +2.4 | |
Labour | Derek Kennedy | 388 | 21.4 | -4.3 | |
Green | Christopher Keene | 60 | 3.3 | -0.6 | |
Majority | 453 | 24.9 | +3.0 | ||
Turnout | 1,817 | ||||
Canvey Independent gain from Conservative | Swing | ||||
Party | Candidate | Votes | % | ± | |
---|---|---|---|---|---|
Canvey Independent | John Liddiard | 855 | 44.6 | +2.7 | |
Conservative | Sylvia Waymark | 624 | 32.6 | +0.1 | |
Labour | Daniel Curtis | 378 | 19.7 | +5.8 | |
Green | Miles Willis | 59 | 3.1 | +0.4 | |
Majority | 231 | 12.1 | +2.7 | ||
Turnout | 1,916 | ||||
Canvey Independent gain from Conservative | Swing | ||||
Party | Candidate | Votes | % | ± | |
---|---|---|---|---|---|
Conservative | Anthony Belford | 574 | 43.5 | ||
Canvey Independent | Christine Andrews | 545 | 41.3 | ||
Labour | William Deal | 161 | 12.2 | ||
Green | Korinna Willis | 41 | 3.1 | ||
Majority | 29 | 2.2 | |||
Turnout | 1,321 | ||||
Conservative hold | Swing |
Party | Candidate | Votes | % | ± | |
---|---|---|---|---|---|
Canvey Independent | Peter Greig | 688 | 48.9 | +3.4 | |
Conservative | Dorothy Best | 431 | 30.6 | -2.9 | |
Labour | John Payne | 193 | 13.7 | -4.1 | |
Green | Grant Fryatt | 96 | 6.8 | +6.8 | |
Majority | 257 | 18.3 | +6.2 | ||
Turnout | 1,408 | ||||
Canvey Independent gain from Conservative | Swing | ||||
Party | Candidate | Votes | % | ± | |
---|---|---|---|---|---|
Conservative | Alexis Iles | 1,070 | 66.2 | -1.6 | |
Labour | Kevin Blanking | 547 | 33.8 | +1.6 | |
Majority | 523 | 32.3 | -3.3 | ||
Turnout | 1,617 | ||||
Conservative hold | Swing |
Party | Candidate | Votes | % | ± | |
---|---|---|---|---|---|
Conservative | Andrew Cole | 859 | 54.0 | -6.5 | |
Labour | Joseph Cooke | 535 | 33.6 | -5.9 | |
Green | Peggy Smith | 196 | 12.3 | +12.3 | |
Majority | 324 | 20.4 | -0.6 | ||
Turnout | 1,590 | ||||
Conservative hold | Swing |
Party | Candidate | Votes | % | ± | |
---|---|---|---|---|---|
Conservative | Godfrey Isaacs | 1,327 | 69.5 | +11.6 | |
Green | Nanine Pachy | 383 | 20.1 | -1.7 | |
Labour | Frederick Jones | 200 | 10.5 | -9.8 | |
Majority | 944 | 49.4 | +13.3 | ||
Turnout | 1,910 | ||||
Conservative hold | Swing |
Party | Candidate | Votes | % | ± | |
---|---|---|---|---|---|
Conservative | Alan Meager | 1,014 | 54.4 | +1.7 | |
Labour | Brian Wilson | 590 | 31.6 | -15.7 | |
Liberal Democrat | Thomas Newman | 145 | 7.8 | +7.8 | |
Green | Lesley Morgan | 116 | 6.2 | +6.2 | |
Majority | 424 | 22.7 | +17.2 | ||
Turnout | 1,865 | ||||
Conservative hold | Swing |
Party | Candidate | Votes | % | ± | |
---|---|---|---|---|---|
Conservative | Pamela Challis | 1,171 | 65.2 | +4.8 | |
Labour | John Trollope | 345 | 19.2 | -4.4 | |
Green | Eileen Peck | 254 | 14.2 | -1.8 | |
PFRC | Anton Hoenderkamp | 25 | 1.4 | +1.4 | |
Majority | 826 | 46.0 | +9.2 | ||
Turnout | 1,795 | ||||
Conservative hold | Swing |
Party | Candidate | Votes | % | ± | |
---|---|---|---|---|---|
Conservative | Clifford Brunt | 1,161 | 65.1 | +6.1 | |
Labour | Harry Brett | 315 | 17.7 | -4.9 | |
Green | Douglas Copping | 307 | 17.2 | -1.3 | |
Majority | 846 | 47.4 | +11.0 | ||
Turnout | 1,783 | ||||
Conservative hold | Swing |
Castle Point is a constituency represented in the House of Commons of the UK Parliament since 2010 by Rebecca Harris of the Conservative Party.
One third of Castle Point Borough Council in Essex, England is elected each year, followed by one year without election. Until 2003 the whole council was elected every four years. Since the last boundary changes in 2003, 41 councillors have been elected from 14 wards.
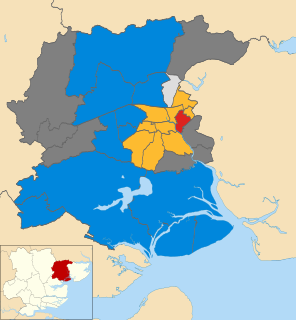
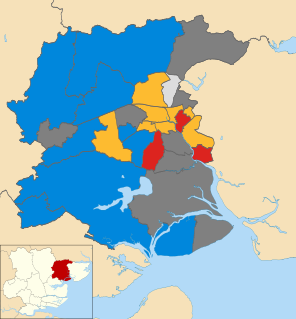
The 2006 Colchester Borough Council election took place on 4 May 2006 to elect members of Colchester Borough Council in Essex, England. One third of the council was up for election and the council stayed under no overall control.
The 2003 Southend-on-Sea Council election took place on 1 May 2003 to elect members of Southend-on-Sea Unitary Council in Essex, England. One third of the council was up for election and the Conservative party stayed in overall control of the council.
The 2008 Basildon District Council election took place on 1 May 2008 to elect members of Basildon District Council in Essex, England. One third of the council was up for election and the Conservative party stayed in overall control of the council.
The 2004 Colchester Borough Council election took place on 10 June 2004 to elect members of Colchester Borough Council in Essex, England. This was the same day as the other 2004 United Kingdom local elections and as the 2004 European Parliament Elections. One third of the seats were up for election and the council stayed under no overall control.
The 2000 Colchester Borough Council election took place on 4 May 2000 to elect members of Colchester Borough Council in Essex, England. One third of the council was up for election and the council stayed under no overall control.
The 2007 Colchester Borough Council election took place on 3 May 2007 to elect members of Colchester Borough Council in Essex, England. One third of the council was up for election and the council stayed under no overall control.
The 2008 Colchester Borough Council election took place on 1 May 2008 to elect members of Colchester Borough Council in Essex, England. One third of the council was up for election and the Conservative party lost overall control of the council to no overall control.
The 1999 Castle Point Borough Council election took place on 6 May 1999 to elect members of Castle Point Borough Council in Essex, England. The whole council was up for election and the Labour party stayed in overall control of the council.
The 2003 Castle Point Borough Council election took place on 1 May 2003 to elect members of Castle Point Borough Council in Essex, England. The whole council was up for election after boundary changes increased the number of seats by 2. The Conservative party gained overall control of the council from the Labour party.
The 2004 Castle Point Borough Council election took place on 10 June 2004 to elect members of Castle Point Borough Council in Essex, England. One third of the council was up for election and the Conservative party stayed in overall control of the council.
The 2007 Castle Point Borough Council election took place on 3 May 2007 to elect members of Castle Point Borough Council in Essex, England. One third of the council was up for election and the Conservative party stayed in overall control of the council.
The 2008 Castle Point Borough Council election took place on 1 May 2008 to elect members of Castle Point Borough Council in Essex, England. One third of the council was up for election and the Conservative party stayed in overall control of the council.
The 2010 Castle Point Borough Council election took place on 6 May 2010 to elect members of Castle Point Borough Council in Essex, England. One third of the council was up for election and the Conservative party stayed in overall control of the council.
The 2011 Castle Point Borough Council election took place on 5 May 2011 to elect members of Castle Point Borough Council in Essex, England. One third of the council was up for election and the Conservative party stayed in overall control of the council.
The 2012 Castle Point Borough Council election took place on 3 May 2012 to elect members of Castle Point Borough Council in Essex, England. One third of the council was up for election and the Conservative party stayed in overall control of the council.
The 2014 Castle Point Borough Council election took place on 22 May 2014 to elect members of Castle Point Borough Council in Essex, England. One third of the council was up for election and the Conservative Party lost overall control of the council to no overall control.