The meteorological history of Hurricane Ivan, the longest tracked tropical cyclone of the 2004 Atlantic hurricane season, lasted from late August through late September. The hurricane developed from a tropical wave that moved off the coast of Africa on August 31. Tracking westward due to a ridge, favorable conditions allowed it to develop into Tropical Depression Nine on September 2 in the deep tropical Atlantic Ocean. The cyclone gradually intensified until September 5, when it underwent rapid deepening and reached Category 4 status on the Saffir-Simpson Hurricane Scale; at the time Ivan was the southernmost major North Atlantic hurricane on record.
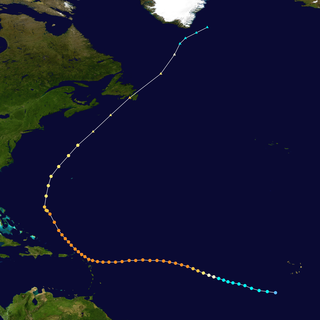
The meteorological history of Hurricane Luis spanned sixteen days between August 27 to September 11, 1995. The storm originated from an area of low pressure associated with a tropical wave on August 26. The following day, the low became sufficiently organized to be classified as a tropical depression, while tracking general westward. By August 29, the depression intensified into a tropical storm and was given the name Luis by the National Hurricane Center. Luis attained hurricane status the following day as an eye began to develop. On September 1 the cyclone intensified into a major hurricane—a storm with winds of 111 mph (179 km/h) or higher—and further strengthened to a Category 4 hurricane later that day.

The meteorological history of Hurricane Georges spanned seventeen days from September 15 to October 1, 1998. Hurricane Georges began as a tropical wave that moved off the coast of Africa during mid-September 1998. Tracking westward, the wave spawned an area of low pressure two days later, which quickly strengthened into a tropical depression. On September 16, the depression was upgraded to Tropical Storm Georges, and to Hurricane Georges the next day. Over the next few days, an eye developed and deep Atmospheric convection persisted around it. Strong outflow and warm sea surface temperatures allowed the storm to intensify as it tracked towards the west-northwest. The storm reached its peak intensity on September 20 with winds of 155 mph (250 km/h), just below Category 5 status on the Saffir–Simpson hurricane scale, and a barometric pressure of 937 mbar.

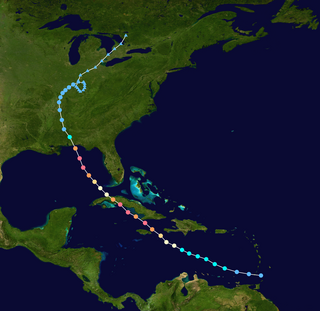
Hurricane Andrew lasted from mid to late August 1992. The hurricane developed from a tropical wave that moved off the coast of Africa on August 14. Tracking westward due to a ridge, favorable conditions allowed it to develop into Tropical Depression Three on August 16 in the deep tropical Atlantic Ocean. The cyclone gradually intensified, becoming a tropical storm on August 17. However, wind shear soon impacted the storm, causing significant increases in barometric pressure and nearly destroying its low-level circulation by August 20. Wind shear sharply decreased starting on August 21, and with warm sea surface temperatures, Andrew began rapid deepening, starting on the following day. By August 23, Andrew peaked as a Category 5 hurricane on the Saffir–Simpson hurricane wind scale while approaching The Bahamas.

Hurricane Rick was the third-most intense Pacific hurricane on record and the second-most intense tropical cyclone worldwide in 2009, only behind Typhoon Nida. Developing off the southern coast of Mexico on October 15, Rick traversed an area with favorable environmental conditions, favoring rapid intensification, allowing it to become a hurricane within 24 hours of being declared a tropical depression. An eye began to form during the afternoon of October 16; once fully formed, the storm underwent another period of rapid strengthening. During the afternoon of October 17, the storm attained Category 5 status on the Saffir–Simpson hurricane wind scale. Several hours later, Rick attained its peak intensity as the third-strongest Pacific hurricane on record with winds of 180 mph (290 km/h) and a barometric pressure of 906 mbar.

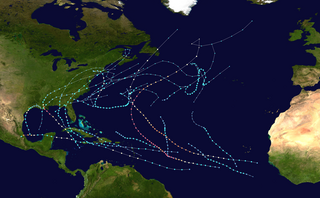
The 2020 Atlantic hurricane season is the most active Atlantic hurricane season on record, in terms of number of systems. It featured a total of 31 tropical or subtropical cyclones, with all but one cyclone becoming a named storm. Of the 30 named storms, 14 developed into hurricanes, and a record-tying seven further intensified into major hurricanes. It was the second and final season to use the Greek letter storm naming system, the first being 2005, the previous record. Of the 30 named storms, 11 of them made landfall in the contiguous United States, breaking the record of nine set in 1916. During the season, 27 tropical storms established a new record for earliest formation date by storm number. This season also featured a record ten tropical cyclones that underwent rapid intensification, tying it with 1995, as well as tying the record for most Category 4 hurricanes in a singular season in the Atlantic Basin. This unprecedented activity was fueled by a La Niña that developed in the summer months of 2020, continuing a stretch of above-average seasonal activity that began in 2016. Despite the record-high activity, this was the first season since 2015 in which no Category 5 hurricanes formed.

Hurricane Mitch's meteorological history began with its origins over Africa as a tropical wave and lasted until its dissipation as an extratropical cyclone north of the United Kingdom. Tropical Depression Thirteen formed on October 22, 1998, over the southwestern Caribbean Sea from a tropical wave that exited Africa on October 10. It executed a small loop, and while doing so intensified into Tropical Storm Mitch. A weakness in a ridge allowed the storm to track slowly to the north. After becoming disorganized due to wind shear from a nearby upper-level low, Mitch quickly intensified in response to improving conditions which included warm waters and good outflow. It became a hurricane on October 24 and developed an eye. After turning to the west, Mitch rapidly intensified, first into a major hurricane on October 25 and then into a Category 5 on the Saffir-Simpson Hurricane Scale the next day.
Hurricane Dennis lasted twenty-two days, beginning with its inception as a tropical wave over Africa on June 26, 2005, and terminating with its dissipation on July 18 over the Great Lakes of North America. The incipient wave that became Dennis emerged over the Atlantic Ocean on June 29 and moved briskly to the west. Dry air initially inhibited development, though once this abated the wave was able to consolidate into a tropical depression on July 4. The depression soon crossed Grenada before entering the Caribbean whereupon increasingly favorable environmental factors, such as low wind shear and high sea surface temperatures, fueled intensification. Turning west-northwest, the system achieved tropical storm status on July 5 and hurricane status the following day.

Hurricane Patricia was the most intense tropical cyclone ever recorded in the Western Hemisphere and the second-most intense worldwide in terms of barometric pressure. It also featured the highest one-minute maximum sustained winds ever recorded in a tropical cyclone. Originating from a sprawling disturbance near the Gulf of Tehuantepec in mid-October 2015, Patricia was first classified a tropical depression on October 20. Initial development was slow, with only modest strengthening within the first day of its classification. The system later became a tropical storm and was named Patricia, the twenty-fourth named storm of the annual hurricane season. Exceptionally favorable environmental conditions fueled explosive intensification on October 22. A well-defined eye developed within an intense central dense overcast and Patricia grew from a tropical storm to a Category 5 hurricane in just 24 hours—a near-record pace. The magnitude of intensification was poorly forecast and both forecast models and meteorologists suffered from record-high prediction errors.
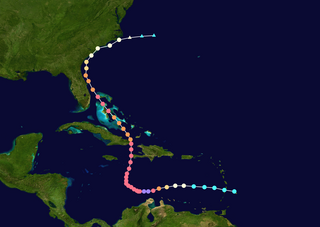
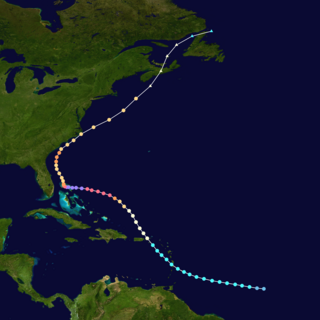
Hurricane Matthew was the first Category 5 Atlantic hurricane since Felix in 2007 and the southernmost Category 5 Atlantic hurricane on record. The system originated from a tropical wave that emerged off the west coast of Africa on September 22, and ultimately dissipated as an extratropical cyclone near Atlantic Canada on October 10. Late on September 29, it began a period of explosive intensification that brought it to Category 5 strength early on October 1. It weakened slightly and remained a Category 4 until its landfalls in Haiti and Cuba, afterwards it traversed through the Bahamas and paralleled the coast of Florida until making landfall in South Carolina as a Category 1 hurricane. Matthew later transitioned into a post-tropical cyclone on October 10.

Hurricane Harvey was the costliest tropical cyclone on record, inflicting roughly $125 billion in damage across the Houston metropolitan area and Southeast Texas. It lasted from mid-August until early September 2017, with many records for rainfall and landfall intensity set during that time. The eighth named storm, third hurricane, and first major hurricane of the 2017 Atlantic hurricane season, Harvey originated from a broad area of low pressure southwest of Cape Verde that was first monitored on August 13. Tracking steadily westward, the disturbance developed strong convection, a well-defined circulation, and sustained tropical storm-force winds, leading to the classification of Tropical Storm Harvey late on August 17. Moderate easterly vertical wind shear kept Harvey weak, as it continued westwards into the Caribbean Sea; despite repeated predictions for gradual intensification by the National Hurricane Center, Harvey eventually opened up into a tropical wave on August 19. The remnants of Harvey continued to move westwards and reached the Yucatán Peninsula on August 22, and were forecast to regenerate into a tropical cyclone after exiting land.

Hurricane Irma was an extremely powerful Cape Verde hurricane that caused extensive damage in the Caribbean and Florida. Lasting from late August to mid-September 2017, the storm was the strongest open-Atlantic tropical cyclone on record and the first Category 5 hurricane to strike the Leeward Islands. Classified as the ninth named storm, fourth hurricane, and second major hurricane of the hyperactive 2017 Atlantic hurricane season, Irma developed from a tropical wave near the Cape Verde Islands on August 30. Favorable conditions allowed the cyclone to become a hurricane on the following day and then rapidly intensify into a major hurricane by September 1 as it moved generally westward across the Atlantic. However, dry air and eyewall replacement cycles disrupted further strengthening, with fluctuations in intensity during the next few days. Irma resumed deepening upon encountering warmer sea surface temperatures, while approaching the Lesser Antilles on September 4. The system reached Category 5 intensity on the following day and peaked with winds of 180 mph (290 km/h) shortly thereafter.

Hurricane Maria was the tenth-most intense Atlantic hurricane on record and caused catastrophic damage in Puerto Rico in late September 2017. Originating from a tropical wave, it developed into a tropical depression on September 16 while situated to the east of the Lesser Antilles. Gradual intensification occurred over the next day or two and it strengthened into a tropical storm, which was named Maria. By late on September 17, Maria had intensified into a hurricane. As it approached the island arc, it underwent explosive intensification on September 18, with the hurricane reaching Category 5 intensity as it made landfall on the island of Dominica early on September 19. Land interaction weakened the storm somewhat, although it was able to quickly recover and later peaked that night with sustained winds of 175 mph (280 km/h) and a pressure of 908 mbar (26.8 inHg). Early the next morning it weakened to a high-end Category 4 hurricane before making landfall in Puerto Rico. Maria weakened significantly due to crossing the island, but was able to strengthen somewhat as it passed close to Hispaniola and The Bahamas on September 21–23. Structural changes in the hurricane as it moved further north and close to the Outer Banks in the United States ultimately caused Maria to weaken quickly. Turning away from the United States as a weakened tropical storm, it became extratropical on September 30, dissipating 3 days later.
The 2021 Atlantic hurricane season was the third-most active Atlantic hurricane season on record in terms of number of tropical cyclones, although many of them were weak and short-lived. With 21 named storms forming, it became the second season in a row and third overall in which the designated 21-name list of storm names was exhausted. Seven of those storms strengthened into a hurricane, four of which reached major hurricane intensity, which is slightly above-average. The season officially began on June 1 and ended on November 30. These dates historically describe the period in each year when most Atlantic tropical cyclones form. However, subtropical or tropical cyclogenesis is possible at any time of the year, as demonstrated by the development of Tropical Storm Ana on May 22, making this the seventh consecutive year in which a storm developed outside of the official season.
Hurricane Dorian was the strongest hurricane to affect The Bahamas on record, causing catastrophic damage on the islands of Abaco Islands and Grand Bahama, in early September 2019. The cyclone's intensity, as well as its slow forward motion near The Bahamas, broke numerous records. The fifth tropical cyclone, fourth named storm, second hurricane, and first major hurricane of the 2019 Atlantic hurricane season, Dorian originated from a westward-traveling tropical wave, that departed from the western coast of Africa on August 19. The system organized into a tropical depression and later a tropical storm, both on August 24.

Hurricane Marco was the first of two tropical cyclones to threaten the Gulf Coast of the United States within a three-day period. The thirteenth named storm and third hurricane of the record-breaking 2020 Atlantic hurricane season, Marco developed from a fast-moving tropical wave west of the Windward Islands and south of Jamaica on August 20. The fast motion of the wave inhibited intensification initially, but as the wave slowed down and entered a more favorable environment, the system developed into a tropical depression, which in turn rapidly intensified into a strong tropical storm. Due to strong wind shear, Marco's intensification temporarily halted. However, after entering the warm waters of the Gulf of Mexico on August 23, Marco briefly intensified into a hurricane, only to quickly weaken later that evening due to another rapid increase in wind shear. Marco subsequently weakened to a tropical depression before degenerating into a remnant low early the next morning. Marco's remnants subsequently dissipated on August 26.

Hurricane Laura tied the record for the strongest hurricane to make landfall in Louisiana as measured by maximum sustained winds, along with the 1856 Last Island hurricane and Hurricane Ida, and was overall the tenth-strongest hurricane to make landfall in the United States. The thirteenth tropical cyclone, twelfth named storm, fourth hurricane, and first major hurricane of the 2020 Atlantic hurricane season, Laura originated from a large tropical wave that moved off the West African coast on August 16. The tropical wave gradually organized, becoming a tropical depression on August 20. Though in only a marginally conducive environment for intensification, the depression nevertheless intensified into a tropical storm a day later, becoming the earliest twelfth named storm on record in the North Atlantic basin, forming eight days earlier than 1995's Hurricane Luis. The depression received the name Laura and tracked west-northwest towards the Lesser Antilles.

Hurricane Gamma was a Category 1 hurricane that brought heavy rains, flooding, and landslides to the Yucatán Peninsula in early October 2020. The twenty-fifth depression, twenty-fourth named storm and ninth hurricane of the extremely active 2020 Atlantic hurricane season, Gamma developed from a vigorous tropical wave that had been monitored as it was entering the Eastern Caribbean on September 29. The wave moved westward and slowed down as it moved into the Western Caribbean, where it began to interact with a dissipating cold front. A low formed within the disturbance on October 1 and the next day, it organized into a tropical depression. It further organized into Tropical Storm Gamma early the next day. It continued to intensify and made landfall as a minimal hurricane near Tulum, Mexico, on October 3. It weakened over land before reemerging in the Gulf of Mexico. Gamma then briefly restrengthened some before being blasted by high amounts of wind shear, causing it to weaken again. It made a second landfall as a tropical depression in Nichili, Mexico on October 6 before dissipating as it was absorbed by the approaching Hurricane Delta.

Hurricane Iota was the second-most powerful November tropical cyclone on record in the Atlantic basin, behind only the 1932 Cuba hurricane. It was also the strongest and most intense hurricane of the hyperactive 2020 Atlantic hurricane season. At the end of October, a tropical wave emerged off Africa and traversed the Atlantic Ocean with little note. The system later impacted northern South America and the Lesser Antilles before becoming more organized, eventually becoming a tropical depression on November 13 over the Caribbean Sea. Initially stymied by adverse environmental conditions the system, which soon became Tropical Storm Iota, struggled to organize as it took an atypical southwest track. After developing a small, well-organized core, Iota entered a region exceptionally favorable for explosive intensification and dramatically developed. Within a 42-hour period from November 15 to 16, Iota strengthened from a tropical storm to a high-end Category 4 hurricane with peak winds of 155 mph (249 km/h). The hurricane's eyewall impacted the Colombian islands of Providencia and Santa Catalina around this time. Moving along a westward course, Iota slowly weakened and eventually made landfall in Nicaragua with winds of 145 mph (233 km/h) in nearly the same location as Hurricane Eta two weeks prior. Once inland, interaction with the region's mountainous terrain caused the system to rapidly deteriorate and its surface circulation dissipated on November 18. Its remnants persisted another day before last being noted southwest of Guatemala.
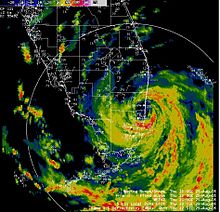

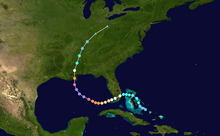
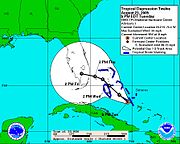 August 23: The NHC forecast the storm to move along a northwest and later west trajectory into the Florida Peninsula
 August 24: forecasts remained largely consistent
 August 25: forecasts remained easterly, with an eventual landfall in the Florida Panhandle
 Afternoon of August 26: forecasts shifted significantly west to the Mississippi/Alabama coast
 Evening of August 26: forecasts shifted farther west, with Katrina posing an imminent threat to Louisiana and Mississippi. [23]