The Dakota Territory legislature created the county (as Mountraille County) on January 4, 1873, with an area annexed from Buffalo County. The origin of its name came from Joseph Mountraille, a locally famed Metis voyageur and mail carrier from Pembina under Norman Kittson's employment.[8] The county was not organized at that time, nor was it attached to another county for administrative or judicial purposes. The new county lost territory in 1885 when a portion was annexed off to create Garfield County (now extinct). This situation continued until February 21, 1891, when Mountrail County was attached to Ward County for "judicial and other purposes." The following year (November 8, 1892), the North Dakota legislature voted to dissolve the county and have its territory absorbed by Ward County.
An election held in Ward County on November 3, 1908, authorized the re-creation of Mountrail County, although with different boundaries than the previous county proposal. The countywide vote totals were 4207 to 4024, but the result was contested in court. On January 16, 1909, the state Supreme Court upheld the vote,[9] so the county government was organized on January 29 of that year.[4]
Oil production from the Bakken formation in the early 21st century attracted workers and reversed decades of population decline in the county. From 2010 to 2015, especially, population markedly increased, creating its own strains.
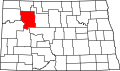
Outline map of Mountrail County, North Dakota, 1917
Geography
The Missouri River flows southeastward along the SW boundary line of Mountrail County, and Shell Creek drains the lower central part of the county into the Missouri, discharging at Shell Creek Bay. The terrain consists of rolling hills, largely devoted to agriculture. Its NE portion is dotted with ponds and lakes.[10] The Laurentian Divide runs east–west through the central part of the county, with the northern areas sloping to the north and the southern areas sloping to the south. Its highest point is on the upper west boundary line, at 2,480ft (760m) ASL.[11]
According to the United States Census Bureau, the county has a total area of 1,941.419 square miles (5,028.25km2), of which 1,825.163 square miles (4,727.15km2) is land and 116.256 square miles (301.10km2) (5.99%) is water.[12] It is the 9th largest county in North Dakota by total area.[13]
Mountrail County is one of several western North Dakota counties with significant exposure to the Bakken Formation in the Williston Basin.
U.S. Decennial Census[15] 1790–1960[16] 1900–1990[17] 1990–2000[18] 2010–2020[2]
As of the fourth quarter of 2024, the median home value in Mountrail County was $235,433.[19]
As of the 2023 American Community Survey, there are 3,839 estimated households in Mountrail County with an average of 2.46 persons per household. The county has a median household income of $81,292. Approximately 11.6% of the county's population lives at or below the poverty line. Mountrail County has an estimated 63.3% employment rate, with 22.4% of the population holding a bachelor's degree or higher and 88.6% holding a high school diploma.[2]
The top five reported ancestries (people were allowed to report up to two ancestries, thus the figures will generally add to more than 100%) were English (88.5%), Spanish (6.5.%), Indo-European (1.0%), Asian and Pacific Islander (0.4%), and Other (3.6%).
The median age in the county was 35.1 years.
Mountrail County, North Dakota – racial and ethnic composition Note: the US Census treats Hispanic/Latino as an ethnic category. This table excludes Latinos from the racial categories and assigns them to a separate category. Hispanics/Latinos may be of any race.
As of the 2024 estimate, there were 9,474 people and 3,839 households residing in the county. There were 5,176 housing units at an average density of 2.84 per square mile (1.1/km2). The racial makeup of the county was 62.9% White (57.5% NH White), 2.0% African American, 30.4% Native American, 1.0% Asian, 0.1% Pacific Islander, _% from some other races and 3.7% from two or more races. Hispanic or Latino people of any race were 8.9% of the population.[25]
2020 census
As of the 2020 census, there were 9,809 people, 3,715 households, and 2,407 families residing in the county.[26] The population density was 5.4 inhabitants per square mile (2.1/km2).[27]
Of the residents, 27.9% were under the age of 18 and 13.5% were 65 years of age or older; the median age was 35.0 years. For every 100 females there were 109.3 males, and for every 100 females age 18 and over there were 112.3 males.[28]
There were 3,715 households in the county, of which 35.5% had children under the age of 18 living with them and 21.0% had a female householder with no spouse or partner present. About 28.4% of all households were made up of individuals and 8.5% had someone living alone who was 65 years of age or older.[28]
There were 5,018 housing units, of which 26.0% were vacant. Among occupied housing units, 60.6% were owner-occupied and 39.4% were renter-occupied. The homeowner vacancy rate was 2.6% and the rental vacancy rate was 21.5%.[28]
2010 census
As of the 2010 census, there were 7,673 people, 2,793 households, and 1,852 families residing in the county. The population density was 4.2 inhabitants per square mile (1.6/km2). There were 4,117 housing units at an average density of 2.26 per square mile (0.9/km2). The racial makeup of the county was 65.55% White, 0.21% African American, 30.60% Native American, 0.20% Asian, 0.01% Pacific Islander, 0.81% from some other races and 2.55% from two or more races. Hispanic or Latino people of any race were 3.73% of the population.
There were 2,793 households, 31.1% had children under the age of 18 living with them, 48.3% were married couples living together, 11.4% had a female householder with no husband present, 33.7% were non-families, and 28.3% of all households were made up of individuals. The average household size was 2.55 and the average family size was 3.11. The median age was 37.0 years.
The median income for a household in the county was $53,912 and the median income for a family was $63,238. Males had a median income of $43,386 versus $29,432 for females. The per capita income for the county was $25,762. About 13.5% of families and 16.5% of the population were below the poverty line, including 24.2% of those under age 18 and 14.2% of those age 65 or over.
Mountrail County was historically a swing county but now leans strongly Republican. Bill Clinton won both of his terms, and Barack Obama carried this country in the 2008 election. However, he wasn't able to carry this county in 2012, falling to Republican Mitt Romney by over 16%. Kamala Harris received the smallest vote by a Democratic candidate (27.6%) since Progressive Party candidate Robert La Follette received an overwhelming vote in 1924.
United States presidential election results for Mountrail County, North Dakota[30][31]
This page is based on this Wikipedia article Text is available under the CC BY-SA 4.0 license; additional terms may apply. Images, videos and audio are available under their respective licenses.