Opinion polling for UK general elections |
---|
October 1974 election |
Opinion polls |
1979 election |
Opinion polls |
1983 election |
Opinion polls |
1987 election |
Opinion polls |
1992 election |
Opinion polls |
In the run-up to the 1983 general election, various organisations carried out opinion polling to gauge voting intention. Results of such polls are displayed in this article. The date ranges for these opinion polls are from the 1979 general election until 6 June 1983.
All data is from UK Polling Report. [1]
Survey end date | Pollster | Client | Con | Lab | All | Lead |
---|---|---|---|---|---|---|
9 June | 1983 general election | 42.4% | 27.6% | 25.4% | 14.8% | |
8 Jun | Harris | The Observer | 47% | 26% | 25% | 21% |
8 Jun | Gallup | The Daily Telegraph | 47% | 25% | 26% | 21% |
8 Jun | Marplan | The Guardian | 45.5% | 26.5% | 26% | 19% |
8 Jun | NOP | Northcliffe | 46% | 26% | 26% | 20% |
8 Jun | MORI | Evening Standard | 47% | 25% | 26% | 21% |
8 Jun | NOP | Daily Mail | 44% | 28% | 26% | 16% |
7 Jun | Audience Selection | The Sun | 46% | 28% | 24% | 18% |
7 Jun | Marplan | The Guardian | 46% | 23% | 29% | 17% |
6 Jun | Audience Selection | The Sun | 47% | 26% | 25% | 21% |
5 Jun | Harris | The Observer | 45% | 24% | 28% | 17% |
3 Jun | Marplan | Sunday Mirror | 47% | 28% | 23% | 19% |
3 Jun | NOP | The Mail on Sunday | 44% | 27% | 27.5% | 16.5% |
3 Jun | Gallup | The Sunday Telegraph | 47% | 29% | 23% | 18% |
2 Jun | MORI | The Sunday Times | 45.5% | 31.5% | 22% | 14% |
2 Jun | MORI | Daily Express | 45% | 28% | 25% | 17% |
2 Jun | Marplan | The Guardian | 43% | 32% | 23% | 11% |
1 Jun | Harris | TV-Eye | 47% | 30% | 22% | 17% |
1 Jun | MORI | Daily Star | 46% | 28% | 24% | 18% |
31 May | Audience Selection | The Sun | 44% | 32% | 21% | 12% |
31 May | Gallup | The Daily Telegraph | 44% | 29% | 25% | 15% |
30 May | Audience Selection | TV-AM | 47.5% | 28% | 23% | 19.5% |
30 May | Harris | The Observer | 41% | 30% | 24% | 11% |
27 May | Marplan | Sunday Mirror | 47% | 30% | 21% | 17% |
27 May | Gallup | The Daily Telegraph | 49.5% | 31% | 19% | 18.5% |
26 May | MORI | Daily Express | 49% | 31.5% | 18% | 17.5% |
26 May | Marplan | The Guardian | 51% | 29% | 19% | 22% |
25 May | Harris | Thames | 47.5% | 32.5% | 19% | 15% |
25 May | MORI | The Sunday Times | 48% | 33% | 18% | 15% |
25 May | Audience Selection | The Sun | 46% | 30% | 23% | 16% |
24 May | Gallup | The Daily Telegraph | 45% | 32% | 21% | 13% |
23 May | Audience Selection | TV-AM | 48% | 33% | 18% | 15% |
23 May | MORI | Daily Star | 45% | 32% | 20% | 13% |
23 May | NOP | Daily Mail | 51% | 33% | 15% | 18% |
23 May | Harris | The Observer | 52% | 33% | 14% | 19% |
20 May | Marplan | Sunday Mirror | 45% | 36% | 18% | 9% |
20 May | MORI | Daily Express | 47% | 34% | 18% | 13% |
19 May | MORI | The Sunday Times | 46% | 37% | 16% | 9% |
18 May | Harris | Thames | 47% | 30% | 21% | 17% |
18 May | NOP | Daily Mail | 45% | 35% | 17% | 10% |
17 May | Audience Selection | The Sun | 49% | 31% | 19% | 18% |
17 May | Gallup | The Daily Telegraph | 44% | 33% | 21% | 11% |
16 May | MORI | Daily Star | 46% | 33% | 19% | 13% |
16 May | Audience Selection | TV-AM | 44% | 37% | 17% | 7% |
16 May | MORI | Daily Express | 46% | 31% | 21% | 15% |
13 May | The Dissolution of the 48th Parliament and campaigning officially begins | |||||
12 May | MORI | N/A | 49% | 34% | 15% | 15% |
11 May | Harris | Thames | 46% | 32% | 22% | 14% |
11 May | MORI | Daily Star | 52% | 31% | 17% | 21% |
10 May | Gallup | The Daily Telegraph | 46% | 31% | 21% | 15% |
9 May | MORI | N/A | 49% | 31.5% | 17.5% | 17.5% |
5 May | 1983 local elections [2] | |||||
25 Apr | MORI | N/A | 45% | 30% | 23% | 15% |
23 Apr | MORI | N/A | 46% | 33% | 21% | 13% |
12 Apr | Gallup | The Daily Telegraph | 43% | 34% | 22% | 9% |
11 Apr | MORI | N/A | 40.5% | 35% | 22.5% | 5.5% |
24 Mar | Darlington by-election | |||||
23 Mar | Gallup | The Daily Telegraph | 43% | 28% | 28% | 15% |
21 Mar | MORI | N/A | 39.5% | 28.5% | 29% | 10.5% |
16 Mar | MORI | N/A | 42% | 28% | 27% | 14% |
9 Mar | MORI | N/A | 41% | 27% | 30% | 11% |
26 Feb | MORI | N/A | 39% | 26% | 34% | 5% |
24 Feb | Bermondsey by-election | |||||
23 Feb | Gallup | The Daily Telegraph | 46% | 32% | 21% | 14% |
14 Feb | MORI | N/A | 43.5% | 32.5% | 22% | 11% |
9 Feb | MORI | N/A | 45% | 32% | 21% | 13% |
26 Jan | Gallup | The Daily Telegraph | 44% | 36% | 19% | 8% |
17 Jan | MORI | N/A | 44% | 31.5% | 22.5% | 12.5% |
12 Jan | MORI | N/A | 44% | 35% | 20% | 9% |
Survey end date | Pollster | Client | Con | Lab | All | Lead |
---|---|---|---|---|---|---|
15 Dec | Gallup | The Daily Telegraph | 42% | 35% | 21% | 7% |
13 Dec | MORI | N/A | 41% | 34.5% | 22% | 6.5% |
2 Dec | Glasgow Queen's Park by-election | |||||
24 Nov | Gallup | The Daily Telegraph | 43% | 35% | 21% | 8% |
15 Nov | MORI | N/A | 42% | 34.5% | 21.5% | 7.5% |
10 Nov | MORI | N/A | 42% | 33% | 23% | 9% |
28 Oct | Birmingham Northfield and Peckham by-elections | |||||
26 Oct | Gallup | The Daily Telegraph | 43% | 32% | 23% | 11% |
25 Oct | MORI | N/A | 40.5% | 29% | 27% | 11.5% |
20 Oct | 1982 Northern Ireland Assembly election [3] | |||||
12 Oct | Gallup | The Daily Telegraph | 42% | 33% | 23% | 9% |
16 Sep | Gower by-election | |||||
13 Sep | MORI | N/A | 44% | 30.5% | 23% | 13.5% |
31 Aug | Gallup | The Daily Telegraph | 42% | 30% | 27% | 12% |
16 Aug | MORI | N/A | 44.5% | 26.5% | 27.5% | 17% |
31 Jul | Gallup | The Daily Telegraph | 44% | 30% | 23% | 14% |
12 Jul | MORI | N/A | 46.5% | 27.5% | 24% | 19% |
2 Jul | Roy Jenkins is elected leader of the Social Democratic Party [4] | |||||
30 Jun | MORI | N/A | 45% | 31% | 22% | 14% |
24 Jun | Coatbridge and Airdrie by-election | |||||
23 Jun | Gallup | The Daily Telegraph | 51% | 24% | 23% | 27% |
14 Jun | MORI | N/A | 45% | 25% | 28.5% | 16.5% |
14 Jun | The Falklands War ends [5] | |||||
3 Jun | Mitcham and Morden by-election | |||||
31 May | MORI | N/A | 48% | 28% | 24% | 20% |
27 May | Beaconsfield by-election | |||||
26 May | MORI | N/A | 51% | 25% | 23% | 26% |
23 May | Gallup | The Daily Telegraph | 48% | 31% | 20% | 17% |
16 May | MORI | N/A | 41.5% | 28% | 29% | 12.5% |
16 May | MORI | N/A | 48% | 33% | 17% | 15% |
6 May | 1982 United Kingdom local elections [6] | |||||
5 May | MORI | N/A | 38% | 32% | 28% | 6% |
30 Apr | MORI | N/A | 44% | 30% | 24% | 14% |
30 Apr | MORI | N/A | 43% | 30% | 25% | 13% |
24 Apr | MORI | N/A | 39% | 32% | 27% | 7% |
21 Apr | MORI | N/A | 36% | 30% | 31% | 5% |
14 Apr | Gallup | The Daily Telegraph | 33% | 34% | 30% | 1% |
12 Apr | MORI | N/A | 31.5% | 29% | 37% | 5.5% |
2 Apr | The Falklands War begins [7] | |||||
31 Mar | Gallup | The Daily Telegraph | 35% | 30% | 33% | 2% |
25 Mar | Glasgow Hillhead by-election | |||||
15 Mar | MORI | N/A | 31.5% | 33% | 33% | Tie |
4 Mar | Belfast South by-election | |||||
28 Feb | Gallup | The Daily Telegraph | 34% | 34% | 30% | Tie |
15 Feb | NOP | Daily Mail | 27.5% | 34% | 36% | 2% |
5 Feb | MORI | N/A | 41% | 36% | 21% | 5% |
31 Jan | MORI | N/A | 30% | 33% | 34% | 1% |
25 Jan | Gallup | The Daily Telegraph | 29% | 30% | 40% | 10% |
18 Jan | Gallup | The Daily Telegraph | 27.5% | 29.5% | 39.5% | 10% |
Survey end date | Pollster | Client | Con | Lab | All | Lead |
---|---|---|---|---|---|---|
14 Dec | MORI | N/A | 23% | 23.5% | 50.5% | 27% |
14 Dec | NOP | N/A | 27% | 29% | 43% | 14% |
3 Dec | MORI | N/A | 30.5% | 34.3% | 33.1% | 1.2% |
1 Dec | NOP | N/A | 27% | 27% | 44% | 17% |
1 Dec | Gallup | The Daily Telegraph | 28.6% | 32.1% | 37.1% | 5% |
26 Nov | Crosby by-election | |||||
16 Nov | NOP | N/A | 26.5% | 29% | 42% | 13% |
6 Nov | MORI | N/A | 29.2% | 38.2% | 30.6% | 7.6% |
27 Oct | Gallup | The Daily Telegraph | 27% | 31% | 40% | 9% |
26 Oct | NOP | N/A | 29.5% | 28% | 40% | 12% |
22 Oct | Croydon North West by-election | |||||
8 Oct | MORI | N/A | 32.1% | 40.4% | 24.7% | 8.3% |
28 Sep | MORI | N/A | 28% | 42% | 28% | 14% |
18 Sep | Gallup | The Daily Telegraph | 27% | 38% | 33% | 5% |
14 Sep | NOP | N/A | 32% | 36.5% | 29% | 7.5% |
11 Sep | Gallup | The Daily Telegraph | 33.5% | 37.4% | 27.7% | 3.9% |
20 Aug | Fermanagh & South Tyrone second by-election | |||||
17 Aug | NOP | N/A | 28% | 38.5% | 32.5% | 6% |
7 Aug | MORI | N/A | 31.6% | 42.1% | 24.3% | 10.5% |
31 Jul | Gallup | The Daily Telegraph | 30% | 39% | 29% | 9% |
16 Jul | Warrington by-election | |||||
13 Jul | NOP | N/A | 30% | 40.5% | 26.5% | 10.5% |
9 Jul | MORI | N/A | 31.5% | 41.2% | 24.2% | 9.7% |
30 Jun | MORI | N/A | 30% | 36% | 31% | 6% |
22 Jun | MORI | N/A | 31% | 39% | 28% | 8% |
16 Jun | Gallup | The Daily Telegraph | 37% | 39% | 22% | 2% |
15 Jun | NOP | N/A | 29.5% | 37.5% | 30.5% | 8% |
5 Jun | MORI | N/A | 37.7% | 39.3% | 20.8% | 1.6% |
30 May | Gallup | The Daily Telegraph | 35% | 39% | 24% | 4% |
11 May | MORI | N/A | 32% | 35.5% | 29% | 3.5% |
11 May | NOP | N/A | 38% | 41% | 19% | 3% |
7–20 May | 1981 United Kingdom local elections [8] | |||||
7 May | MORI | N/A | 30.9% | 39.3% | 26.6% | 8.4% |
27 Apr | Gallup | The Daily Telegraph | 30% | 38% | 29% | 8% |
13 Apr | NOP | N/A | 30% | 34.5% | 33% | 4.5% |
9 Apr | Fermanagh & South Tyrone by-election | |||||
3 Apr | MORI | N/A | 35.9% | 42.1% | 19.5% | 6.2% |
26 Mar | The Social Democratic Party is formed [9] | |||||
23 Mar | MORI | N/A | 33% | 41% | 25% | 8% |
23 Mar | Gallup | The Daily Telegraph | 28% | 38% | 32% | 10% |
16 Mar | NOP | N/A | 30% | 34% | 32% | 4% |
2 Mar | NOP | N/A | 37% | 41.1% | 16.5% | 4.1% |
13 Feb | Gallup | The Daily Telegraph | 34.5% | 50.9% | 12.2% | 16.4% |
11 Feb | MORI | N/A | 36% | 35.5% | 26.5% | 0.5% |
24 Jan | Gallup | The Daily Telegraph | 35% | 45% | 17% | 10% |
19 Jan | NOP | N/A | 33% | 46.5% | 18.5% | 13.5% |
9 Jan | MORI | N/A | 35.4% | 51.2% | 11.9% | 15.8% |
Survey end date | Pollster | Client | Con | Lab | Lib | Lead |
---|---|---|---|---|---|---|
19 Dec | Gallup | The Daily Telegraph | 32% | 56% | 11% | 24% |
15 Dec | NOP | N/A | 35% | 47.5% | 14.5% | 12.5% |
4 Dec | Gallup | The Daily Telegraph | 37.2% | 47.7% | 12.6% | 10.5% |
17 Nov | MORI | N/A | 36.5% | 47% | 15% | 10.5% |
11 Nov | NOP | N/A | 38% | 47% | 13% | 9% |
10 Nov | Michael Foot becomes leader of the Labour Party [10] | |||||
7 Nov | MORI | N/A | 39.4% | 46.5% | 12.4% | 7.1% |
31 Oct | Gallup | The Daily Telegraph | 36% | 50% | 13% | 14% |
20 Oct | Gallup | The Daily Telegraph | 40% | 43% | 13.5% | 3% |
6 Oct | NOP | N/A | 40% | 43% | 13.5% | 3% |
2 Oct | MORI | N/A | 39.8% | 47.6% | 11% | 7.8% |
30 Sep | MORI | N/A | 34% | 50% | 15% | 16% |
29 Sep | Gallup | The Daily Telegraph | 37% | 46% | 15% | 9% |
15 Sep | NOP | N/A | 35.5% | 45% | 16.5% | 9.5% |
5 Sep | Gallup | The Daily Telegraph | 40% | 46.3% | 11.3% | 6.3% |
18 Aug | NOP | N/A | 38.5% | 44% | 14.5% | 5.5% |
1 Aug | MORI | N/A | 38.1% | 47.3% | 11.7% | 9.2% |
31 Jul | MORI | N/A | 37% | 48% | 13% | 11% |
27 Jul | Gallup | The Daily Telegraph | 37% | 47% | 13% | 10% |
14 Jul | NOP | N/A | 40% | 43.5% | 14% | 3.5% |
3 Jul | MORI | N/A | 41% | 46.9% | 10.4% | 5.9% |
26 Jun | Glasgow Central by-election | |||||
23 Jun | Gallup | The Daily Telegraph | 41% | 43% | 13% | 2% |
16 Jun | NOP | N/A | 40.5% | 45% | 11.5% | 4.5% |
6 Jun | Gallup | The Daily Telegraph | 43% | 43.3% | 11.7% | 0.3% |
19 May | NOP | N/A | 39% | 43.5% | 15.5% | 4.5% |
1 May | MORI | N/A | 41.4% | 46.5% | 10.7% | 5.1% |
1 May | 1980 United Kingdom local elections [11] | |||||
28 Apr | Gallup | The Daily Telegraph | 39% | 44% | 14% | 5% |
14 Apr | NOP | N/A | 36.5% | 45% | 15% | 8.5% |
11 Apr | MORI | N/A | 35.5% | 49.6% | 10.9% | 14.1% |
28 Mar | Gallup | The Daily Telegraph | 42% | 46% | 9% | 4% |
17 Mar | NOP | N/A | 37% | 49.5% | 11.5% | 12.5% |
13 Mar | Southend East by-election | |||||
5 Mar | MORI | N/A | 35.7% | 51.9% | 11.2% | 16.2% |
29 Feb | MORI | N/A | 38% | 46% | 13% | 8% |
25 Feb | Gallup | The Daily Telegraph | 38% | 46% | 14% | 8% |
11 Feb | NOP | N/A | 37.5% | 42% | 18% | 4.5% |
8 Feb | MORI | N/A | 37.2% | 50.3% | 10.7% | 13.1% |
19 Jan | Gallup | The Daily Telegraph | 39% | 47% | 12% | 8% |
14 Jan | NOP | N/A | 36% | 45% | 16% | 9% |
4 Jan | MORI | N/A | 40.1% | 48.5% | 9.5% | 8.4% |
Survey end date | Pollster | Client | Con | Lab | Lib | Lead |
---|---|---|---|---|---|---|
31 Dec | Gallup | The Daily Telegraph | 40% | 43% | 14% | 3% |
13 Dec | South West Hertfordshire by-election | |||||
10 Dec | NOP | N/A | 38% | 42% | 18% | 4% |
6 Dec | MORI | N/A | 42.1% | 46.3% | 10.1% | 4.2% |
2 Dec | Gallup | The Daily Telegraph | 40% | 45% | 13% | 5% |
12 Nov | NOP | N/A | 39% | 43.5% | 15.5% | 4.5% |
9 Nov | Gallup | The Daily Telegraph | 40.9% | 47.2% | 10% | 6.3% |
15 Oct | NOP | N/A | 40.5% | 45% | 12.5% | 4.5% |
6 Oct | MORI | N/A | 44.9% | 46% | 7.4% | 1.1% |
30 Sep | Gallup | The Daily Telegraph | 41% | 46% | 11% | 5% |
27 Sep | Manchester Central by-election | |||||
17 Sep | NOP | N/A | 40.5% | 45% | 12% | 4.5% |
2 Sep | MORI | N/A | 42.8% | 47.3% | 8.6% | 4.5% |
31 Aug | Gallup | The Daily Telegraph | 42% | 43% | 12% | 1% |
13 Aug | NOP | N/A | 41.5% | 44% | 12.5% | 2.5% |
5 Aug | MORI | N/A | 43.1% | 45.4% | 9.5% | 2.3% |
31 Jul | Gallup | The Daily Telegraph | 44% | 45% | 9% | 1% |
16 Jul | NOP | N/A | 41% | 46% | 11.5% | 5% |
7 Jul | Gallup | The Daily Telegraph | 44.2% | 45.5% | 8.2% | 1.3% |
18 Jun | Gallup | The Daily Telegraph | 42% | 43.5% | 12% | 1.5% |
7 Jun | 1979 European Parliament election [12] | |||||
3 May | 1979 United Kingdom local elections [13] | |||||
3 May | 1979 general election | 43.9% | 36.9% | 13.8% | 7% |
The 1983 United Kingdom general election was held on Thursday 9 June 1983. It gave the Conservative Party under the leadership of Margaret Thatcher the most decisive election victory since that of the Labour Party in 1945, with a majority of 144 seats and the first of two consecutive landslide victories.
The 1992 United Kingdom general election was held on Thursday 9 April 1992, to elect 651 members to the House of Commons. The election resulted in the fourth consecutive victory for the Conservative Party since 1979, with a majority of 21 and would be the last time that the Conservatives would win an overall majority at a general election until 2015. It was also the last general election to be held on a day which did not coincide with any local elections until 2017. This election result took many by surprise, as opinion polling leading up to the election day had shown a narrow but consistent lead for the Labour Party under leader Neil Kinnock.
The SDP–Liberal Alliance was a centrist and social liberal political and electoral alliance in the United Kingdom.
The 2010 United Kingdom general election was held on Thursday 6 May 2010, to elect Members of Parliament to the House of Commons. The election took place in 650 constituencies across the United Kingdom under the first-past-the-post system.
"Shy Tory factor" is a name given by British opinion polling companies to a phenomenon first observed by psephologists in the early 1990s. They observed that the share of the electoral vote won by the Conservative Party was significantly higher than the equivalent share in opinion polls. The accepted explanation was that so-called "shy Tories" were voting Conservative after telling pollsters they would not. The general elections held in 1992 and 2015 are examples where it has allegedly affected the overall results, but has also been discussed in other elections where the Conservatives did unexpectedly well. It has also been applied to the success of the Republican Party in the United States or the continued electoral victories of the People's Action Party in Singapore.
The Mid Staffordshire constituency of the United Kingdom Parliament held a by-election on 22 March 1990. The result was the election of Labour candidate Sylvia Heal to succeed the previous Conservative Member of Parliament John Heddle, who had precipitated the by-election by committing suicide.
The 2009 European Parliament election was the United Kingdom's component of the 2009 European Parliament election, the voting for which was held on Thursday 4 June 2009. The election was held concurrently with the 2009 local elections in England. In total, 72 Members of the European Parliament were elected from the United Kingdom using proportional representation.
A Glasgow Hillhead by-election was held on 25 March 1982. The by-election was caused by the death of the Conservative Party Member of Parliament for Glasgow Hillhead Tam Galbraith on 2 January 1982.
In the run-up to the general election of 2010, several polling organisations carried out opinion polling in regards to voting intention in Great Britain. Results of such polls are displayed below.
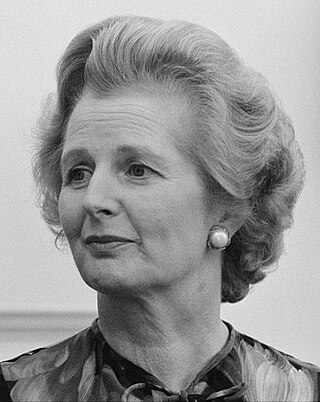
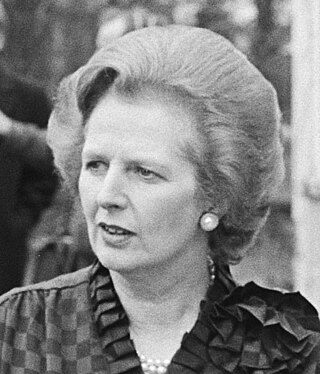
Margaret Thatcher was Prime Minister of the United Kingdom from 4 May 1979 to 28 November 1990, during which time she led a Conservative majority government. She was the first woman to hold that office. During her premiership, Thatcher moved to liberalise the British economy through deregulation, privatisation, and the promotion of entrepreneurialism.
In the run up to the general election of 2001, several polling organisations carried out opinion polling in regards to voting intention in Great Britain. Results of such polls are displayed below.
Prior to the 1997 general election, various organisations carried out opinion polling to gauge voting intentions. Results of such polls are displayed in this list.
The Social Democratic Party (SDP) was a centrist to centre-left political party in the United Kingdom. The party supported a mixed economy, electoral reform, European integration and a decentralised state while rejecting the possibility of trade unions being overly influential within the industrial sphere. The SDP officially advocated social democracy, but its actual propensity is evaluated as close to social liberalism.
The 2015 United Kingdom general election was held on Thursday 7 May 2015 to elect 650 Members of Parliament to the House of Commons. It was the only general election held under the rules of the Fixed-term Parliaments Act 2011 and was the last general election to be held before the United Kingdom would vote to end its membership of the European Union (EU). Local elections took place in most areas of England on the same day.
The 2017 United Kingdom general election was held on Thursday 8 June 2017, two years after the previous general election in 2015; it was the first since 1992 to be held on a day that did not coincide with any local elections. The governing Conservative Party remained the largest single party in the House of Commons but lost its small overall majority, resulting in the formation of a Conservative minority government with a confidence and supply agreement with the Democratic Unionist Party (DUP) of Northern Ireland.
In the run up to the 1992 general election, various organisations carried out opinion polling to gauge voting intention in the United Kingdom. Results of such polls are displayed in this article. The date range for these opinion polls are from the election to 8 April.
In the run-up to the 1987 general election, various organisations carried out opinion polling to gauge voting intention. Results of such polls are displayed in this article. The date range for these opinion polls are from the 1983 general election until 10 June 1987.
Opinion polling for the 2024 United Kingdom general election is being carried out continually by various organisations to gauge voting intention. Most of the polling companies listed are members of the British Polling Council (BPC) and abide by its disclosure rules. The dates for these opinion polls range from the 2019 general election on 12 December to the present day.
In the run-up to the 1979 general election, various organisations carried out opinion polling to gauge voting intention. Results of such polls are displayed in this article. The date range for these opinion polls are from the October general election until 3 May 1979.
The Gang of 25 or the Group of 25 was a cohort of British Conservative Party backbench members of Parliament (MPs) that threatened to vote against prime minister Margaret Thatcher's 1981 Autumn Statement. The statement contained monetarist measures to control inflation. Similar measures introduced since 1979 had reduced inflation but caused job losses in the manufacturing sector.