The Division of Mayo is an Australian electoral division located to the east and south of Adelaide, South Australia. Created in the state redistribution of 3 September 1984, the division is named after Helen Mayo, a social activist and the first woman elected to an Australian University Council. The 9,315 km² rural seat covers an area from the Barossa Valley in the north to Cape Jervis in the south. Taking in the Adelaide Hills, Fleurieu Peninsula and Kangaroo Island regions, its largest population centre is Mount Barker. Its other population centres are Aldgate, Bridgewater, Littlehampton, McLaren Vale, Nairne, Stirling, Strathalbyn and Victor Harbor, and its smaller localities include American River, Ashbourne, Balhannah, Brukunga, Carrickalinga, Charleston, Cherry Gardens, Clarendon, Crafers, Cudlee Creek, Currency Creek, Delamere, Echunga, Forreston, Goolwa, Gumeracha, Hahndorf, Houghton, Inglewood, Kersbrook, Kingscote, Langhorne Creek, Lobethal, Macclesfield, McLaren Flat, Meadows, Middleton, Milang, Mount Compass, Mount Pleasant, Mount Torrens, Mylor, Myponga, Normanville, Norton Summit, Oakbank, Penneshaw, Piccadilly, Port Elliot, Second Valley, Springton, Summertown, Uraidla, Willunga, Woodchester, Woodside, Yankalilla, and parts of Birdwood, Old Noarlunga and Upper Sturt.

Elections for the 54th Parliament of New South Wales were held on Saturday, 24 March 2007. The entire Legislative Assembly and half of the Legislative Council was up for election. The Labor Party led by Morris Iemma won a fourth four-year term against the Liberal-National coalition led by Peter Debnam.
The term swing refers to the extent of change in voter support, typically from one election or opinion poll to another, expressed as a positive or negative percentage point. For the Australian House of Representatives and the lower houses of the parliaments of all the states and territories except Tasmania and the ACT, Australia employs preferential voting in single-member constituencies. Under the full-preference instant-runoff voting system, in each seat the candidate with the lowest vote is eliminated and their preferences are distributed, which is repeated until only two candidates remain. While every seat has a two-candidate preferred (TCP) result, seats where the major parties have come first and second are commonly referred to as having a two-party-preferred (TPP) result. The concept of "swing" in Australian elections is not simply a function of the difference between the votes of the two leading candidates, as it is in Britain. To know the majority of any seat, and therefore the swing necessary for it to change hands, it is necessary to know the preferences of all the voters, regardless of their first preference votes. It is not uncommon in Australia for candidates who have comfortable leads on the first count to fail to win the seat, because "preference flows" go against them.
The Mackerras pendulum was devised by the Australian psephologist Malcolm Mackerras as a way of predicting the outcome of an election contested between two major parties in a Westminster style lower house legislature such as the Australian House of Representatives, which is composed of single-member electorates and which uses a preferential voting system such as a Condorcet method or IRV.

In Australian politics, the two-party-preferred vote is the result of an election or opinion poll after preferences have been distributed to the highest two candidates, who in some cases can be independents. For the purposes of TPP, the Liberal/National Coalition is usually considered a single party, with Labor being the other major party. Typically the TPP is expressed as the percentages of votes attracted by each of the two major parties, e.g. "Coalition 50%, Labor 50%", where the values include both primary votes and preferences. The TPP is an indicator of how much swing has been attained/is required to change the result, taking into consideration preferences, which may have a significant effect on the result.
The following pendulum is known as the Mackerras pendulum, invented by psephologist Malcolm Mackerras. Designed for the outcome of the 2007 federal election, the pendulum works by lining up all of the seats held in Parliament, 83 Labor, 55 Liberal, 10 National, and 2 independent, according to the percentage point margin on a two candidate preferred basis, as elected in 2007. The two candidate result is also known as the swing required for the seat to change hands. Given a uniform swing to the opposition or government parties in an election, the number of seats that change hands can be predicted. Swing is never uniform, but in practice variations of swing among the Australian states usually tend to cancel each other out. Seats are arranged in safeness categories according to the Australian Electoral Commission's classification of safeness. "Safe" seats require a swing of over 10 per cent to change, "fairly safe" seats require a swing of between 6 and 10 per cent, while "marginal" seats require a swing of less than 6 per cent.
The following pendulum is known as the Mackerras pendulum, invented by psephologist Malcolm Mackerras. Designed for the outcome of the 2010 federal election, the pendulum works by lining up all of the seats held in Parliament, 72 Labor, 72 Coalition, 1 Nationals WA, 1 Green and 4 independent, according to the percentage point margin on a two candidate preferred basis. The two party result is also known as the swing required for the seat to change hands. Given a uniform swing to the opposition or government parties in an election, the number of seats that change hands can be predicted. Swing is never uniform, but in practice variations of swing among the Australian states usually tend to cancel each other out. Seats are arranged in safeness categories according to the Australian Electoral Commission's classification of safeness. "Safe" seats require a swing of over 10 per cent to change, "fairly safe" seats require a swing of between 6 and 10 per cent, while "marginal" seats require a swing of less than 6 per cent.
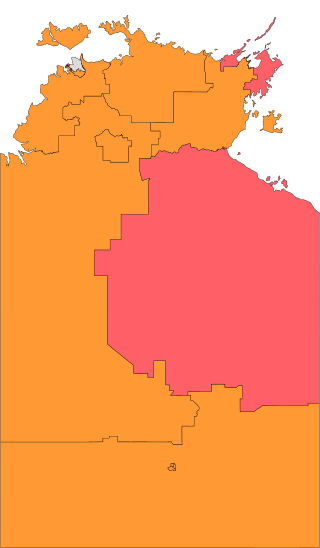
The Northern Territory general election was held on Saturday 25 August 2012, which elected all 25 members of the Legislative Assembly in the unicameral Northern Territory Parliament. The 11-year Labor Party government led by Chief Minister Paul Henderson was defeated in their attempt to win a fourth term against the opposition Country Liberal Party led by opposition leader Terry Mills with a swing of four seats, losing the normally safe Labor remote seats of Arafura, Arnhem, Daly and Stuart, whilst retaining their urban seats picked up at the 2001 election.

The 2014 South Australian state election elected members to the 53rd Parliament of South Australia on 15 March 2014, to fill all 47 seats in the House of Assembly and 11 of 22 seats in the Legislative Council. The 12-year-incumbent Australian Labor Party (SA) government, led by Premier Jay Weatherill, won its fourth consecutive four-year term in government, a record 16 years of Labor government, defeating the opposition Liberal Party of Australia (SA), led by Opposition Leader Steven Marshall.
The following is a pendulum based on the outcome of the 2010 federal election and changes since, including the redistributions of seats in South Australia and Victoria. It is a Mackerras pendulum, invented by psephologist Malcolm Mackerras, which works by lining up all of the seats held in Parliament according to the percentage point margin on a two-candidate-preferred basis. The two-party result is also known as the swing required for the seat to change hands. Given a uniform swing to the opposition or government parties in an election, the number of seats that change hands can be predicted. Swings are never uniform, but in practice variations of swing among the Australian states usually tend to cancel each other out. Seats are arranged in safeness categories according to the Australian Electoral Commission's (AEC) classification of safeness. "Safe" seats require a swing of over 10 per cent to change, "fairly safe" seats require a swing of between 6 and 10 per cent, while "marginal" seats require a swing of less than 6 per cent. The swings for South Australian and Victorian seats are notional, based on calculations by the AEC.
At the 2016 federal election of the 150 House of Representatives seats the Liberal/National Coalition won 76, a one-seat majority, Labor won 69 seats and crossbenchers won the remaining five. A redistribution in 2017/18 changed the representation entitlements. For the next election, the number of seats in the House will increase to 151, South Australia will lose a seat, Victoria and the Australian Capital Territory (ACT) will gain one seat each.
The following pendulum is known as the Mackerras pendulum, invented by psephologist Malcolm Mackerras. Based upon the outcome of the 2007 federal election and changes before the 2010 election, the pendulum works by lining up all of the seats held in Parliament, 83 Labor, 55 Liberal, 9 National, and 3 independent, according to the percentage point margin on a two party preferred basis.
The Coalition won the 2013 federal election with 90 of 150 lower house seats on a current 17-seat, 3.65-point two-party swing, defeating the 6-year Labor government. Labor holds 55 seats while crossbenchers hold the remaining five. The Division of Fairfax was the last seat to be declared.
This is a Mackerras pendulum for the 2016 Australian federal election.
The Coalition won the 2016 federal election with a one-seat majority 76 of 150 lower house seats. Labor holds 69 seats while crossbenchers hold the remaining five.
The Labor party won the 2018 state election by winning 55 of the 88 lower house seats. The coalition won 27 seats while the Greens and independents won 3 each.
The Coalition won the 2019 federal election with a three-seat majority of 77 of 151 lower house seats. Labor holds 68 seats, and crossbenchers hold the remaining six.
The Mackerras pendulum was devised by the Australian psephologist Malcolm Mackerras as a way of predicting the outcome of an election contested between two major parties in a Westminster style lower house legislature such as the Australian House of Representatives, which is composed of single-member electorates and which uses a preferential voting system such as a Condorcet method or IRV.
The Australian Labor Party won the 2022 federal election, winning 77 of 151 seats in the House of Representatives. The Coalition holds 58 seats, and crossbenchers hold the remaining 16.
The Mackerras pendulum was devised by the Australian psephologist Malcolm Mackerras as a way of predicting the outcome of an election contested between two major parties in a Westminster style lower house legislature such as the Australian House of Representatives, which is composed of single-member electorates and which uses a preferential voting system such as a Condorcet method or instant-runoff voting.