Climate of China

Last updated
Koppen climate types of Mainland China Koppen-Geiger Map CHN present.svg
Köppen climate types of Mainland China

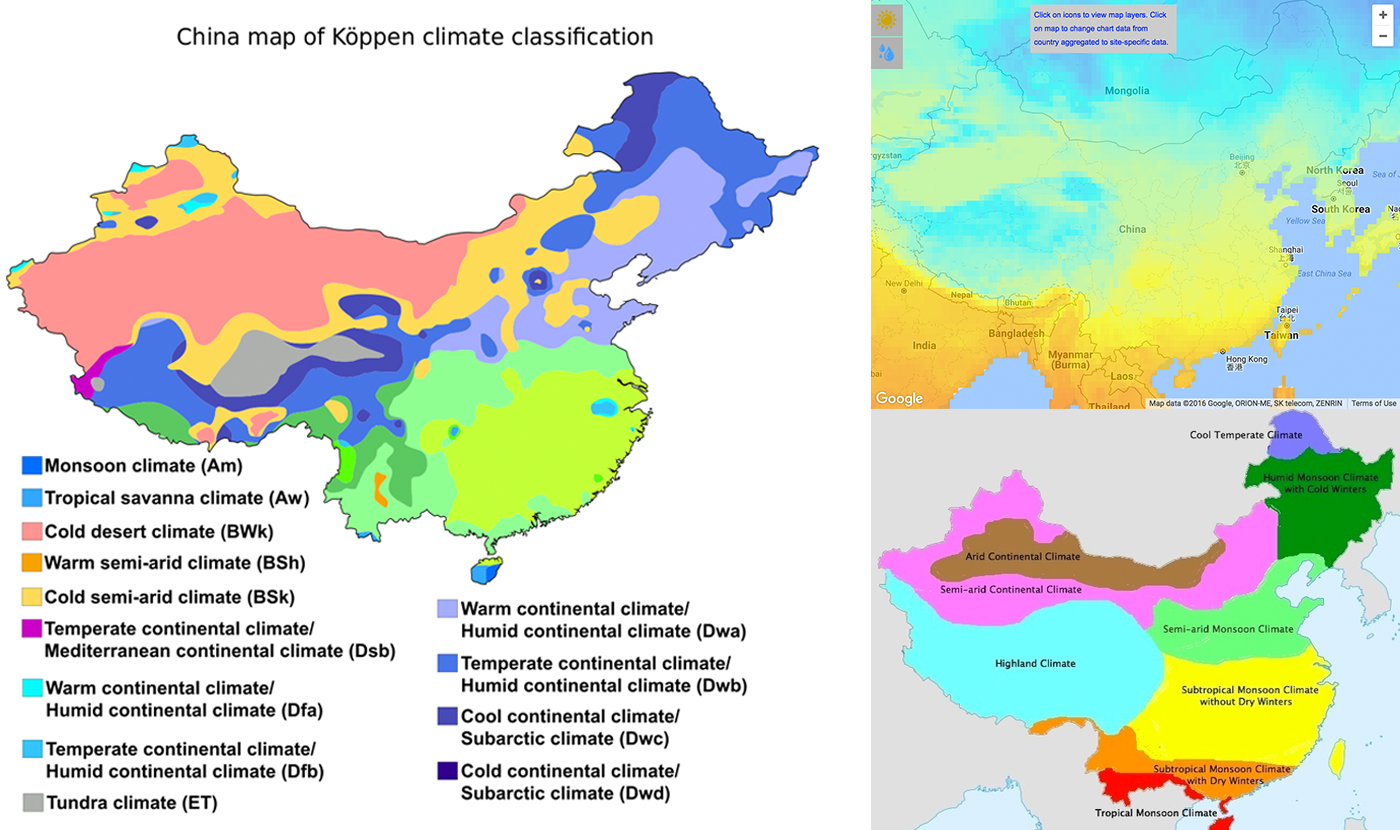
Owing to tremendous differences in latitude, longitude, and altitude, the climate of China is extremely diverse. It ranges from tropical in the far south to subarctic in the far north, and alpine in the higher elevations of the Tibetan Plateau. Monsoon winds, caused by differences in the heat-absorbing capacity of the continent and the ocean, dominate the climate. During the summer, the East Asian Monsoon carries warm and moist air from the south and delivers the vast majority of the annual precipitation in much of the country. Conversely, the Siberian anticyclone dominates during winter, bringing cold and comparatively dry conditions. The advance and retreat of the monsoons account, in large degree, for the timing of the rainy season throughout the country. Although most of the country lies in the temperate belt, its climatic patterns are complex.

Contents

Sanbao Township in Xinjiang currently holds the highest recorded temperature in China, at 52.2 °C (126.0 °F) on 16 July 2023. [1] [2] Mohe City, Heilongjiang, holds the record for the lowest temperature in China, at −53.0 °C (−63.4 °F) on 22 January 2023. [3] [4]

Overview

Temperature

Hardiness zones in China China Hardiness Map 1.jpg
Hardiness zones in China

The northern extremities of both Heilongjiang and Inner Mongolia have a subarctic climate [5] with long, severe winters, and short, warm summers. [6] In contrast, most of Hainan Island and parts of the extreme southern fringes of Yunnan have a tropical climate. [5] Temperature differences in winter are considerable, but in summer, the variance is considerably less. For example, Mohe County, Heilongjiang, has a 24-hour average temperature in January approaching −30 °C (−22 °F), while the corresponding figure in July exceeds 18 °C (64 °F). [7] By contrast, most of Hainan, including the city of Haikou, has a January mean over 18 °C (64 °F), while the July mean there is generally around 29 °C (84 °F). [8]

In summer, temperatures can be very hot and humid, and the cities of Chongqing, Wuhan, and Nanjing are sometimes referred to as the Three Furnaces (simplified Chinese : 火炉 ; traditional Chinese : 火爐 ; pinyin :sān dà huǒlú). [9] Other cities are also known by this name. [10] Even so, the hottest temperatures nationwide are recorded in the Turpan Depression, where the climate is much drier and temperatures often exceed 40 °C (104 °F). [11] [12]

Permafrost can be found at high elevations in the Tibetan Plateau and the Tian Shan mountains, [13] [14] as well as other mountainous areas in Northern China. [14]

Precipitation

The average annual precipitation in Mainland China China average annual precipitation (en).png
The average annual precipitation in Mainland China

In the winter, northern winds coming from high-latitude areas are cold and dry, while in summer, southern winds from coastal areas at lower latitudes are warm and moist. [15] Precipitation is almost always concentrated in the warmer months, though annual totals range from less than 20 millimetres (0.8 in) in northwestern Qinghai and the Turpan Depression of Xinjiang, to over 2,000 millimetres (79 in) in areas of southeast China, such as Hong Kong and Guangdong. Toksun County, located in the Turpan Depression, has an average rainfall of just 3.9 mm (0.15 in) annually, the lowest precipitation in any area in China. [16] High pressure cells create cold, dry conditions in the Gobi Desert in winter. [17] Only in some pockets of the Dzungaria region of Xinjiang is the conspicuous seasonal variation in precipitation that defines Chinese (and, to a large extent, East Asian) climate absent. The East Asian Monsoon, which controls the seasonal precipitation, varies from year to year. [18] It has historically been known as the plum rain. [19] [20] Scientists have used pollen and dust to track its movements. [21] [22]

Typhoons and flooding

Typhoons can affect China. In 1975, Typhoon Nina struck China, and may have killed up to 230,000 people as a result of the subsequent Banqiao Dam failure and famines. [23] [24] Other death estimates remain below 100,000. [25] In 2006, Typhoon Saomai became one of the strongest typhoons to hit China when it made landfall in Zhejiang. [26] [27] In 2013, Typhoon Haiyan caused extensive damage in China, [28] causing economic losses of ¥4.58 billion (US$752 million). [29] That same year, Typhoon Fitow became one of the costliest typhoons to strike China, [30] [31] with several places setting rainfall records. [32] [33] It was the costliest Chinese typhoon on record and caused several billion dollars in damage before it was beaten 10 years later by Typhoon Doksuri. [34] In 2018, Typhoon Mangkhut caused $1.99 billion in damage within China. [29] In 2021, Typhoon In-fa caused record-breaking rainfall in parts of China, [35] [36] and over 12,000 temporary shelters had to be set up in Zhejiang. [37] In 2022, Typhoon Muifa became the strongest typhoon to landfall in Shanghai. [38]

During the wet season, typhoons and heavy rainfall can cause rivers to flood. The 1931 China floods are considered to be the worst Chinese natural disaster of all time, with estimates of fatalities ranging widely but going up to as high as four million people. [39] [40] 15% of wheat and rice crops were destroyed in the Yangtze Valley, leading to famines. [41] Almost 800,000 in Wuhan were left homeless after a dike failure in July 1931. [42] :270 The city was flooded under water for nearly three months. [42] :269–270 The city of Nanjing was also severely affected, [43] and tens of thousands of people died in Gaoyou alone. [44] Other major floods include the 1954 Yangtze River Floods, which killed around 30,000 people, [45] the 1998 China floods, which caused significant damage and affected 180 million people, [45] [46] and the 2020 China floods, which caused US$32 billion in damage. [47] [48]

Tornadoes

Tornadoes occur frequently across China. Over 400 are recorded each year, with some reaching EF3 intensity. On June 23rd, 2016, a violent EF4 tornado ripped through the city of Yancheng in Jiangsu, killing 98 people and injuring 846, many of them critically. [49] [50] Tornadoes occur most frequently in the eastern regions of China, but activity is also prevalent in the southern and central regions. [51]

Sunshine

Annual sunshine duration ranges from less than 1,000 hours in parts of Sichuan and Chongqing [52] to over 3,000 hours in parts of Xinjiang and Qinghai, including Golmud. [53] Some areas of Tibet, including Lhasa, are also sunny. Seasonal patterns in sunshine vary considerably by region, but overall, the north and the Tibetan Plateau are sunnier than the south of the country. In some cities in southern China, such as Hong Kong, spring is the cloudiest season and autumn is the sunniest. [54]

Environmental issues

Air pollution caused by industrial plants (a factory at the Yangtze River) Factory in China.jpg
Air pollution caused by industrial plants (a factory at the Yangtze River)

In 2020, China ranked 120th out of 180 countries in the Environmental Performance Index. [55] The government has taken actions to mitigate environmental issues, but some media has criticized the actions as inadequate. [56]

A major environmental issue in China is the continued expansion of its deserts, particularly the Gobi Desert. [57] [58] Although barrier tree lines planted since the 1970s have reduced the frequency of sandstorms, prolonged drought and poor agricultural practices have resulted in dust storms plaguing northern China each spring, which then spread to other parts of East Asia, including Japan and Korea. China's environmental watchdog, SEPA, stated in 2007 that China is losing 4,000 km2 (1,500 sq mi) per year to desertification. [59] Water quality, erosion, and pollution control have become important issues in China's relations with other countries. Melting glaciers in the Himalayas could potentially lead to water shortages for hundreds of millions of people. [60] According to academics, in order to limit climate change in China to 1.5 °C (2.7 °F), electricity generation from coal in China without carbon capture must be phased out by 2045. [61] Official government statistics about Chinese agricultural productivity are considered unreliable, due to exaggeration of production at subsidiary government levels. [62] [63]

Much of China has a climate very suitable for agriculture and the country has been the world's largest producer of rice, wheat, tomatoes, eggplant, grapes, watermelon, spinach, and many other crops. [64]

Examples

Northeast China

Climate data for Beijing (1991–2020 normals, extremes 1951–present)
MonthJanFebMarAprMayJunJulAugSepOctNovDecYear
Record high °C (°F)14.3
(57.7)
25.6
(78.1)
29.5
(85.1)
33.5
(92.3)
41.1
(106.0)
41.1
(106.0)
41.9
(107.4)
39.3
(102.7)
35.2
(95.4)
31.0
(87.8)
23.3
(73.9)
19.5
(67.1)
41.9
(107.4)
Mean daily maximum °C (°F)2.3
(36.1)
6.1
(43.0)
13.2
(55.8)
21.0
(69.8)
27.2
(81.0)
30.8
(87.4)
31.8
(89.2)
30.7
(87.3)
26.5
(79.7)
19.3
(66.7)
10.3
(50.5)
3.7
(38.7)
18.6
(65.4)
Daily mean °C (°F)−2.7
(27.1)
0.6
(33.1)
7.5
(45.5)
15.1
(59.2)
21.3
(70.3)
25.3
(77.5)
27.2
(81.0)
26.1
(79.0)
21.2
(70.2)
13.8
(56.8)
5.2
(41.4)
−1.0
(30.2)
13.3
(55.9)
Mean daily minimum °C (°F)−6.9
(19.6)
−4.2
(24.4)
1.9
(35.4)
9.0
(48.2)
15.1
(59.2)
20.0
(68.0)
23.0
(73.4)
22.0
(71.6)
16.3
(61.3)
8.8
(47.8)
0.7
(33.3)
−5.0
(23.0)
8.4
(47.1)
Record low °C (°F)−22.8
(−9.0)
−27.4
(−17.3)
−15
(5)
−3.2
(26.2)
2.5
(36.5)
9.8
(49.6)
15.3
(59.5)
11.4
(52.5)
3.7
(38.7)
−3.5
(25.7)
−12.3
(9.9)
−18.3
(−0.9)
−27.4
(−17.3)
Average precipitation mm (inches)2.2
(0.09)
5.8
(0.23)
8.6
(0.34)
21.7
(0.85)
36.1
(1.42)
72.4
(2.85)
169.7
(6.68)
113.4
(4.46)
53.7
(2.11)
28.7
(1.13)
13.5
(0.53)
2.2
(0.09)
528
(20.78)
Average precipitation days (≥ 0.1 mm)1.62.33.04.76.010.011.910.57.15.22.91.666.8
Average snowy days2.82.51.30.10.00.00.00.00.00.01.72.811.2
Average relative humidity (%)43424043475869716458544653
Mean monthly sunshine hours 188.1189.1231.1243.2265.1221.6190.5205.3206.1199.9173.4177.12,490.5
Percent possible sunshine 62626261595042495659596157
Average ultraviolet index 2346899864215
Source 1: China Meteorological Administration [65] [66]
Source 2: Extremes [lower-alpha 1] and Weather Atlas [71]

Note

  1. All-time record high; [67] February record high; [68] May record high; [69] June record high [70]
Climate data for Tianjin (1981–2010 normals)
MonthJanFebMarAprMayJunJulAugSepOctNovDecYear
Record high °C (°F)14.3
(57.7)
20.8
(69.4)
30.5
(86.9)
33.1
(91.6)
40.5
(104.9)
40.1
(104.2)
40.5
(104.9)
37.4
(99.3)
34.9
(94.8)
30.8
(87.4)
23.1
(73.6)
14.4
(57.9)
40.5
(104.9)
Mean daily maximum °C (°F)2.0
(35.6)
5.7
(42.3)
12.2
(54.0)
20.9
(69.6)
26.5
(79.7)
30.3
(86.5)
31.3
(88.3)
30.5
(86.9)
26.6
(79.9)
19.9
(67.8)
10.6
(51.1)
3.8
(38.8)
18.4
(65.0)
Daily mean °C (°F)−3.4
(25.9)
−0.1
(31.8)
6.4
(43.5)
14.7
(58.5)
20.5
(68.9)
24.8
(76.6)
26.8
(80.2)
25.9
(78.6)
21.1
(70.0)
14.1
(57.4)
5.2
(41.4)
−1.2
(29.8)
12.9
(55.2)
Mean daily minimum °C (°F)−7.4
(18.7)
−4.4
(24.1)
1.7
(35.1)
9.3
(48.7)
15.1
(59.2)
20.0
(68.0)
22.9
(73.2)
22.2
(72.0)
16.7
(62.1)
9.4
(48.9)
1.1
(34.0)
−5.0
(23.0)
8.5
(47.3)
Record low °C (°F)−18.1
(−0.6)
−22.9
(−9.2)
−17.7
(0.1)
−2.8
(27.0)
4.5
(40.1)
10.1
(50.2)
16.2
(61.2)
13.7
(56.7)
6.2
(43.2)
−2.2
(28.0)
−11.4
(11.5)
−16.2
(2.8)
−22.9
(−9.2)
Average precipitation mm (inches)2.5
(0.10)
3.6
(0.14)
8.1
(0.32)
22.1
(0.87)
36.8
(1.45)
79.7
(3.14)
149.8
(5.90)
124.1
(4.89)
44.7
(1.76)
26.5
(1.04)
10.8
(0.43)
2.8
(0.11)
511.5
(20.15)
Average precipitation days (≥ 0.1 mm)1.62.03.14.55.97.811.19.46.04.72.92.061
Average relative humidity (%)57545150556475766964615961
Mean monthly sunshine hours 170.1170.2202.4223.8249.0226.9206.4204.4205.3196.1163.0157.62,375.2
Percent possible sunshine 59595658605748536061575757
Source: China Meteorological Administration [72] [73]
Climate data for Harbin (1981–2010 normals, extremes 1961–2000)
MonthJanFebMarAprMayJunJulAugSepOctNovDecYear
Record high °C (°F)4.2
(39.6)
9.9
(49.8)
20.7
(69.3)
29.4
(84.9)
34.6
(94.3)
36.7
(98.1)
39.2
(102.6)
35.6
(96.1)
31.0
(87.8)
26.5
(79.7)
17.2
(63.0)
8.5
(47.3)
39.2
(102.6)
Mean daily maximum °C (°F)−12.0
(10.4)
−6.3
(20.7)
2.8
(37.0)
14.0
(57.2)
21.5
(70.7)
26.5
(79.7)
27.8
(82.0)
26.5
(79.7)
21.2
(70.2)
12.3
(54.1)
−0.1
(31.8)
−9.2
(15.4)
10.4
(50.7)
Daily mean °C (°F)−17.6
(0.3)
−12.4
(9.7)
−2.8
(27.0)
7.8
(46.0)
15.3
(59.5)
21.0
(69.8)
23.1
(73.6)
21.6
(70.9)
15.1
(59.2)
6.4
(43.5)
−4.9
(23.2)
−14.3
(6.3)
4.9
(40.7)
Mean daily minimum °C (°F)−22.9
(−9.2)
−18.3
(−0.9)
−8.5
(16.7)
1.4
(34.5)
8.8
(47.8)
15.2
(59.4)
18.6
(65.5)
16.9
(62.4)
9.3
(48.7)
0.9
(33.6)
−9.5
(14.9)
−19.0
(−2.2)
−0.6
(30.9)
Record low °C (°F)−38.1
(−36.6)
−33.7
(−28.7)
−28.4
(−19.1)
−12.8
(9.0)
−3.8
(25.2)
4.6
(40.3)
9.5
(49.1)
6.6
(43.9)
−4.8
(23.4)
−16.2
(2.8)
−26.5
(−15.7)
−35.7
(−32.3)
−42.6
(−44.7)
Average precipitation mm (inches)4.2
(0.17)
4.9
(0.19)
11.9
(0.47)
20.1
(0.79)
39.3
(1.55)
88.2
(3.47)
147.8
(5.82)
122.6
(4.83)
56.3
(2.22)
23.0
(0.91)
12.7
(0.50)
6.9
(0.27)
537.9
(21.19)
Average precipitation days (≥ 0.1 mm)5.85.75.76.710.313.514.212.39.97.16.07.2104.4
Average relative humidity (%)71665548516276786961636964
Mean monthly sunshine hours 155.9179.9230.9231.4264.1260.2254.2247.2230.5206.8170.2139.92,571.2
Percent possible sunshine 56626357585654576161605258
Average ultraviolet index 1234678753114
Source 1: China Meteorological Administration (sunshine data 19712000), [73] [74] Weather China (precipitation days 19712000) [75]
Source 2: Weather Atlas [76]

Northwest China and Tibet

Climate data for Turpan (elevation 39 m (128 ft), 1991–2020 normals)
MonthJanFebMarAprMayJunJulAugSepOctNovDecYear
Record high °C (°F)8.5
(47.3)
19.5
(67.1)
31.7
(89.1)
40.5
(104.9)
43.6
(110.5)
47.6
(117.7)
49.1
(120.4)
47.8
(118.0)
43.4
(110.1)
34.3
(93.7)
23.0
(73.4)
9.6
(49.3)
49.1
(120.4)
Mean daily maximum °C (°F)−2.3
(27.9)
7.0
(44.6)
17.9
(64.2)
27.8
(82.0)
33.9
(93.0)
38.8
(101.8)
40.5
(104.9)
39.0
(102.2)
32.6
(90.7)
22.5
(72.5)
10.3
(50.5)
−0.4
(31.3)
22.3
(72.1)
Daily mean °C (°F)−6.7
(19.9)
1.3
(34.3)
11.6
(52.9)
20.7
(69.3)
26.6
(79.9)
31.6
(88.9)
33.1
(91.6)
31.2
(88.2)
24.6
(76.3)
14.5
(58.1)
4.4
(39.9)
−4.4
(24.1)
15.7
(60.3)
Mean daily minimum °C (°F)−10.3
(13.5)
−3.5
(25.7)
5.9
(42.6)
14.2
(57.6)
19.8
(67.6)
24.7
(76.5)
26.5
(79.7)
24.6
(76.3)
18.4
(65.1)
9.1
(48.4)
0.3
(32.5)
−7.6
(18.3)
10.2
(50.3)
Record low °C (°F)−28.9
(−20.0)
−24.5
(−12.1)
−10.4
(13.3)
−1.8
(28.8)
4.7
(40.5)
11.5
(52.7)
15.5
(59.9)
11.6
(52.9)
1.3
(34.3)
−5.7
(21.7)
−17.8
(0.0)
−26.1
(−15.0)
−28.9
(−20.0)
Average precipitation mm (inches)0.9
(0.04)
0.5
(0.02)
0.7
(0.03)
0.9
(0.04)
1.0
(0.04)
2.6
(0.10)
2.0
(0.08)
2.0
(0.08)
1.4
(0.06)
1.2
(0.05)
0.6
(0.02)
0.9
(0.04)
14.7
(0.6)
Average precipitation days (≥ 0.1 mm)1.00.30.30.71.12.02.31.90.90.80.51.112.9
Average snowy days2.50.9000000000.22.66.2
Average relative humidity (%)56402523252730313545505637
Mean monthly sunshine hours 121.8172.0234.2263.7308.4301.6303.3299.6273.5238.6163.7108.22,788.6
Percent possible sunshine 41576265676666717471573961
Source 1: China Meteorological Administration [77] [78] [79]
Source 2: [80]
Climate data for Lhasa (1986−2015 normals, extremes 1951−2022)
MonthJanFebMarAprMayJunJulAugSepOctNovDecYear
Record high °C (°F)20.5
(68.9)
21.3
(70.3)
25.1
(77.2)
25.9
(78.6)
29.4
(84.9)
30.8
(87.4)
30.4
(86.7)
27.2
(81.0)
26.5
(79.7)
24.8
(76.6)
22.8
(73.0)
20.1
(68.2)
30.8
(87.4)
Mean daily maximum °C (°F)8.4
(47.1)
10.1
(50.2)
13.3
(55.9)
16.3
(61.3)
20.5
(68.9)
24.0
(75.2)
23.3
(73.9)
22.0
(71.6)
20.7
(69.3)
17.5
(63.5)
12.9
(55.2)
9.3
(48.7)
16.5
(61.7)
Daily mean °C (°F)−0.3
(31.5)
2.3
(36.1)
5.9
(42.6)
9.0
(48.2)
13.1
(55.6)
16.7
(62.1)
16.5
(61.7)
15.4
(59.7)
13.8
(56.8)
9.4
(48.9)
3.8
(38.8)
−0.1
(31.8)
8.8
(47.8)
Mean daily minimum °C (°F)−7.4
(18.7)
−4.7
(23.5)
−0.8
(30.6)
2.7
(36.9)
6.8
(44.2)
10.9
(51.6)
11.4
(52.5)
10.7
(51.3)
8.9
(48.0)
3.1
(37.6)
−3
(27)
−6.8
(19.8)
2.7
(36.8)
Record low °C (°F)−16.5
(2.3)
−15.4
(4.3)
−13.6
(7.5)
−8.1
(17.4)
−2.7
(27.1)
2.0
(35.6)
4.5
(40.1)
3.3
(37.9)
0.3
(32.5)
−7.2
(19.0)
−11.2
(11.8)
−16.1
(3.0)
−16.5
(2.3)
Average precipitation mm (inches)0.9
(0.04)
1.8
(0.07)
2.9
(0.11)
8.6
(0.34)
28.4
(1.12)
75.9
(2.99)
129.6
(5.10)
133.5
(5.26)
66.7
(2.63)
8.8
(0.35)
0.9
(0.04)
0.3
(0.01)
458.3
(18.06)
Average precipitation days (≥ 0.1 mm)0.61.22.15.49.014.019.419.914.64.10.60.491.3
Average relative humidity (%)26252736414859635945342941
Mean monthly sunshine hours 250.9231.2253.2248.8280.4260.7227.0214.3232.7280.3267.1257.23,003.8
Percent possible sunshine 78726665666153546280848267
Source 1: China Meteorological Administration, [81] all-time extreme temperature [82] [83]
Source 2: China Meteorological Administration National Meteorological Information Center
Climate data for Ürümqi
MonthJanFebMarAprMayJunJulAugSepOctNovDecYear
Record high °C (°F)9.9
(49.8)
13.5
(56.3)
23.7
(74.7)
32.5
(90.5)
37.0
(98.6)
40.9
(105.6)
41.0
(105.8)
42.1
(107.8)
37.0
(98.6)
30.5
(86.9)
19.2
(66.6)
15.6
(60.1)
42.1
(107.8)
Mean daily maximum °C (°F)−7.4
(18.7)
−4.7
(23.5)
2.7
(36.9)
16.1
(61.0)
23.1
(73.6)
27.6
(81.7)
30.1
(86.2)
29.0
(84.2)
23.1
(73.6)
13.2
(55.8)
2.0
(35.6)
−4.4
(24.1)
12.5
(54.6)
Daily mean °C (°F)−12.6
(9.3)
−9.8
(14.4)
−1.7
(28.9)
10.0
(50.0)
16.7
(62.1)
21.5
(70.7)
23.7
(74.7)
22.4
(72.3)
16.7
(62.1)
7.7
(45.9)
−2.5
(27.5)
−9.3
(15.3)
6.9
(44.4)
Mean daily minimum °C (°F)−16.6
(2.1)
−13.7
(7.3)
−5.4
(22.3)
4.8
(40.6)
11.2
(52.2)
16.1
(61.0)
18.2
(64.8)
16.7
(62.1)
11.2
(52.2)
3.1
(37.6)
−5.9
(21.4)
−12.9
(8.8)
2.2
(36.0)
Record low °C (°F)−34.1
(−29.4)
−41.5
(−42.7)
−33.4
(−28.1)
−14.9
(5.2)
−2.4
(27.7)
4.6
(40.3)
8.8
(47.8)
5.0
(41.0)
−5.0
(23.0)
−12.4
(9.7)
−36.6
(−33.9)
−38.3
(−36.9)
−41.5
(−42.7)
Average precipitation mm (inches)10.4
(0.41)
10.0
(0.39)
18.5
(0.73)
32.3
(1.27)
38.9
(1.53)
36.2
(1.43)
30.4
(1.20)
23.3
(0.92)
26.2
(1.03)
26.3
(1.04)
19.1
(0.75)
14.6
(0.57)
286.2
(11.27)
Average precipitation days (≥ 0.1 mm)9.27.27.26.86.88.08.46.35.05.56.99.686.9
Average relative humidity (%)78777248434343414458747858
Mean monthly sunshine hours 101.6128.8180.5248.0283.3282.7298.7301.0262.6224.4127.484.32,523.3
Percent possible sunshine 35444962636164707066443057
Source: China Meteorological Administration

Central China

Climate data for Chongqing (Shapingba District, 1981–2010 normals)
MonthJanFebMarAprMayJunJulAugSepOctNovDecYear
Record high °C (°F)18.8
(65.8)
24.6
(76.3)
34.0
(93.2)
36.5
(97.7)
38.9
(102.0)
44.1
(111.4)
42.0
(107.6)
43.9
(111.0)
43.9
(111.0)
39.1
(102.4)
29.2
(84.6)
21.5
(70.7)
44.1
(111.4)
Mean daily maximum °C (°F)10.3
(50.5)
12.9
(55.2)
17.7
(63.9)
23.0
(73.4)
27.2
(81.0)
29.4
(84.9)
33.0
(91.4)
33.2
(91.8)
28.3
(82.9)
21.7
(71.1)
17.1
(62.8)
11.5
(52.7)
22.1
(71.8)
Daily mean °C (°F)7.9
(46.2)
10.0
(50.0)
13.8
(56.8)
18.6
(65.5)
22.6
(72.7)
25.1
(77.2)
28.3
(82.9)
28.3
(82.9)
24.1
(75.4)
18.6
(65.5)
14.2
(57.6)
9.2
(48.6)
18.4
(65.1)
Mean daily minimum °C (°F)6.2
(43.2)
8.0
(46.4)
11.2
(52.2)
15.4
(59.7)
19.3
(66.7)
22.1
(71.8)
24.8
(76.6)
24.7
(76.5)
21.2
(70.2)
16.5
(61.7)
12.3
(54.1)
7.7
(45.9)
15.8
(60.4)
Record low °C (°F)−1.8
(28.8)
−0.8
(30.6)
1.2
(34.2)
2.8
(37.0)
10.8
(51.4)
15.5
(59.9)
19.2
(66.6)
17.8
(64.0)
14.3
(57.7)
6.9
(44.4)
0.7
(33.3)
−27.7
(−17.9)
−27.7
(−17.9)
Average precipitation mm (inches)19.7
(0.78)
23.3
(0.92)
43.2
(1.70)
95.2
(3.75)
145.9
(5.74)
192.6
(7.58)
186.0
(7.32)
137.9
(5.43)
105.8
(4.17)
85.8
(3.38)
48.3
(1.90)
24.3
(0.96)
1,108
(43.63)
Average precipitation days (≥ 0.1 mm)10.09.811.914.315.515.712.511.312.716.111.59.8151.1
Average relative humidity (%)84807777778176747985848580
Mean monthly sunshine hours 20.629.764.993.6109.497.7158.6167.0106.650.435.920.4954.8
Percent possible sunshine 811182526264248281813824
Average ultraviolet index 4681011121211107548
Source 1: China Meteorological Administration [84] [52]
Source 2: Weather Atlas (UV Index) [85]
Climate data for Wuhan (1981–2010 normals, extremes 1951–present)
MonthJanFebMarAprMayJunJulAugSepOctNovDecYear
Record high °C (°F)25.4
(77.7)
29.1
(84.4)
32.4
(90.3)
35.1
(95.2)
36.1
(97.0)
37.8
(100.0)
41.1
(106.0)
39.6
(103.3)
38.1
(100.6)
34.4
(93.9)
30.4
(86.7)
23.3
(73.9)
41.1
(106.0)
Mean daily maximum °C (°F)8.1
(46.6)
10.7
(51.3)
15.2
(59.4)
22.1
(71.8)
27.1
(80.8)
30.2
(86.4)
32.9
(91.2)
32.5
(90.5)
28.5
(83.3)
23.0
(73.4)
16.8
(62.2)
10.8
(51.4)
21.5
(70.7)
Daily mean °C (°F)4.0
(39.2)
6.6
(43.9)
10.9
(51.6)
17.4
(63.3)
22.6
(72.7)
26.2
(79.2)
29.1
(84.4)
28.4
(83.1)
24.1
(75.4)
18.2
(64.8)
11.9
(53.4)
6.2
(43.2)
17.1
(62.9)
Mean daily minimum °C (°F)1.0
(33.8)
3.5
(38.3)
7.4
(45.3)
13.6
(56.5)
18.9
(66.0)
22.9
(73.2)
26.0
(78.8)
25.3
(77.5)
20.7
(69.3)
14.7
(58.5)
8.4
(47.1)
2.9
(37.2)
13.8
(56.8)
Record low °C (°F)−18.1
(−0.6)
−14.8
(5.4)
−5.0
(23.0)
−0.3
(31.5)
7.2
(45.0)
13.0
(55.4)
17.3
(63.1)
16.4
(61.5)
10.1
(50.2)
1.3
(34.3)
−7.1
(19.2)
−10.1
(13.8)
−18.1
(−0.6)
Average precipitation mm (inches)48.7
(1.92)
65.5
(2.58)
91.0
(3.58)
135.7
(5.34)
166.8
(6.57)
218.2
(8.59)
228.1
(8.98)
117.5
(4.63)
74.0
(2.91)
80.9
(3.19)
60.0
(2.36)
29.6
(1.17)
1,316
(51.82)
Average precipitation days (≥ 0.1 mm)9.59.813.112.512.211.811.69.67.59.08.06.9121.5
Average relative humidity (%)76757575747777777576757375
Mean monthly sunshine hours 101.997.0121.8152.8181.0170.9220.2226.4175.8151.9139.3126.51,865.5
Percent possible sunshine 33333139434354594846454343
Source: China Meteorological Administration (precipitation days and sunshine 1971–2000) [86] [87]
Climate data for Xi'an (normals 1981–2010, extremes 1951–2013)
MonthJanFebMarAprMayJunJulAugSepOctNovDecYear
Record high °C (°F)17.0
(62.6)
24.1
(75.4)
31.3
(88.3)
34.9
(94.8)
38.6
(101.5)
41.8
(107.2)
41.0
(105.8)
40.0
(104.0)
38.5
(101.3)
34.1
(93.4)
24.5
(76.1)
21.6
(70.9)
41.8
(107.2)
Mean daily maximum °C (°F)5.1
(41.2)
8.9
(48.0)
14.4
(57.9)
21.5
(70.7)
26.6
(79.9)
31.4
(88.5)
32.4
(90.3)
30.3
(86.5)
25.6
(78.1)
19.3
(66.7)
12.4
(54.3)
6.3
(43.3)
19.5
(67.1)
Daily mean °C (°F)0.3
(32.5)
3.6
(38.5)
8.7
(47.7)
15.4
(59.7)
20.5
(68.9)
25.3
(77.5)
27.0
(80.6)
25.1
(77.2)
20.3
(68.5)
14.1
(57.4)
7.2
(45.0)
1.5
(34.7)
14.1
(57.4)
Mean daily minimum °C (°F)−3.3
(26.1)
−0.4
(31.3)
4.1
(39.4)
10.3
(50.5)
15.1
(59.2)
19.9
(67.8)
22.3
(72.1)
21.0
(69.8)
16.5
(61.7)
10.2
(50.4)
3.2
(37.8)
−2.2
(28.0)
9.7
(49.5)
Record low °C (°F)−20.6
(−5.1)
−18.7
(−1.7)
−7.6
(18.3)
−4
(25)
3.5
(38.3)
9.2
(48.6)
15.1
(59.2)
12.1
(53.8)
4.8
(40.6)
−1.9
(28.6)
−16.8
(1.8)
−19.3
(−2.7)
−20.6
(−5.1)
Average precipitation mm (inches)6.7
(0.26)
9.8
(0.39)
27.1
(1.07)
37.5
(1.48)
54.9
(2.16)
64.5
(2.54)
97.5
(3.84)
78.6
(3.09)
94.1
(3.70)
61.7
(2.43)
21.5
(0.85)
7.3
(0.29)
561.2
(22.1)
Average precipitation days (≥ 0.1 mm)3.44.06.47.88.28.89.910.011.69.95.53.689.1
Average relative humidity (%)65626464656168757776736868
Mean monthly sunshine hours 88.496.1116.6142.8169.5179.7181.1168.1121.098.992.481.01,535.6
Percent possible sunshine 32343338404344473432323137
Source: China Meteorological Administration, [88] all-time extreme temperature [89]

East China

Climate data for Shanghai (Minhang District), 1991–2020 normals, extremes 1951–present
MonthJanFebMarAprMayJunJulAugSepOctNovDecYear
Record high °C (°F)22.1
(71.8)
27.0
(80.6)
29.6
(85.3)
34.3
(93.7)
36.4
(97.5)
37.5
(99.5)
40.9
(105.6)
39.9
(103.8)
38.2
(100.8)
36.0
(96.8)
28.7
(83.7)
24.0
(75.2)
40.9
(105.6)
Mean daily maximum °C (°F)8.7
(47.7)
10.7
(51.3)
14.8
(58.6)
20.6
(69.1)
25.5
(77.9)
28.3
(82.9)
32.8
(91.0)
32.3
(90.1)
28.5
(83.3)
23.6
(74.5)
17.9
(64.2)
11.5
(52.7)
21.3
(70.3)
Daily mean °C (°F)4.9
(40.8)
6.6
(43.9)
10.4
(50.7)
15.8
(60.4)
20.9
(69.6)
24.4
(75.9)
28.8
(83.8)
28.5
(83.3)
24.7
(76.5)
19.5
(67.1)
13.7
(56.7)
7.3
(45.1)
17.1
(62.8)
Mean daily minimum °C (°F)1.9
(35.4)
3.3
(37.9)
6.8
(44.2)
11.9
(53.4)
17.2
(63.0)
21.5
(70.7)
25.8
(78.4)
25.7
(78.3)
21.6
(70.9)
15.9
(60.6)
10.1
(50.2)
3.9
(39.0)
13.8
(56.8)
Record low °C (°F)−10.1
(13.8)
−7.9
(17.8)
−5.4
(22.3)
−0.5
(31.1)
6.9
(44.4)
12.3
(54.1)
16.3
(61.3)
18.8
(65.8)
10.8
(51.4)
1.7
(35.1)
−4.2
(24.4)
−8.5
(16.7)
−10.1
(13.8)
Average precipitation mm (inches)70.4
(2.77)
65.4
(2.57)
95.4
(3.76)
82.5
(3.25)
93.2
(3.67)
207.3
(8.16)
148.0
(5.83)
187.1
(7.37)
118.1
(4.65)
68.4
(2.69)
59.4
(2.34)
50.3
(1.98)
1,245.5
(49.04)
Average precipitation days (≥ 0.1 mm)10.910.212.911.311.214.511.712.49.87.49.18.3129.7
Average snowy days1.81.40.400000000.10.74.4
Average relative humidity (%)74737271738078787673747275
Mean monthly sunshine hours 114.8117.9143.8168.1176.8131.2209.4202.3163.7162.1131.1129.71,850.9
Percent possible sunshine 36373943413149504546424142
Source: China Meteorological Administration [90] [91]
Climate data for Nanjing (1981–2010 normals, extremes 1951–present)
MonthJanFebMarAprMayJunJulAugSepOctNovDecYear
Record high °C (°F)21.0
(69.8)
27.7
(81.9)
30.3
(86.5)
34.2
(93.6)
37.5
(99.5)
38.1
(100.6)
40.0
(104.0)
40.7
(105.3)
39.0
(102.2)
33.4
(92.1)
29.2
(84.6)
23.1
(73.6)
40.7
(105.3)
Mean daily maximum °C (°F)7.2
(45.0)
9.5
(49.1)
14.2
(57.6)
20.7
(69.3)
26.2
(79.2)
29.1
(84.4)
32.2
(90.0)
31.7
(89.1)
27.7
(81.9)
22.5
(72.5)
16.2
(61.2)
9.9
(49.8)
20.6
(69.1)
Daily mean °C (°F)2.7
(36.9)
5.0
(41.0)
9.3
(48.7)
15.6
(60.1)
21.1
(70.0)
24.8
(76.6)
28.1
(82.6)
27.6
(81.7)
23.3
(73.9)
17.6
(63.7)
10.9
(51.6)
4.9
(40.8)
15.9
(60.6)
Mean daily minimum °C (°F)−0.7
(30.7)
1.4
(34.5)
5.3
(41.5)
11.0
(51.8)
16.5
(61.7)
21.0
(69.8)
24.9
(76.8)
24.4
(75.9)
19.9
(67.8)
13.6
(56.5)
6.8
(44.2)
1.1
(34.0)
12.1
(53.8)
Record low °C (°F)−14.0
(6.8)
−13.0
(8.6)
−7.1
(19.2)
−0.2
(31.6)
5.0
(41.0)
11.8
(53.2)
16.8
(62.2)
16.9
(62.4)
7.7
(45.9)
0.2
(32.4)
−6.3
(20.7)
−13.1
(8.4)
−14.0
(6.8)
Average precipitation mm (inches)45.2
(1.78)
52.1
(2.05)
80.4
(3.17)
79.9
(3.15)
90.7
(3.57)
162.0
(6.38)
216.3
(8.52)
143.5
(5.65)
75.3
(2.96)
59.5
(2.34)
56.3
(2.22)
29.5
(1.16)
1,090.7
(42.95)
Average precipitation days (≥ 0.1 mm)8.79.111.810.09.710.612.311.88.17.87.46.2113.5
Average relative humidity (%)74737271717680807875767375
Mean monthly sunshine hours 124.7120.3144.7169.2194.2162.8196.7201.6164.0164.2147.4137.11,926.9
Source: China Meteorological Administration (precipitation days, sunshine data 1971–2000) [92] [93]
Climate data for Hangzhou (1981–2010 normals, extremes 1951–present)
MonthJanFebMarAprMayJunJulAugSepOctNovDecYear
Record high °C (°F)25.4
(77.7)
28.5
(83.3)
32.8
(91.0)
34.8
(94.6)
37.6
(99.7)
39.7
(103.5)
41.3
(106.3)
41.6
(106.9)
38.7
(101.7)
35.0
(95.0)
31.2
(88.2)
26.5
(79.7)
41.6
(106.9)
Mean maximum °C (°F)17.4
(63.3)
21.3
(70.3)
25.7
(78.3)
30.6
(87.1)
33.8
(92.8)
35.3
(95.5)
37.9
(100.2)
37.3
(99.1)
34.4
(93.9)
30.3
(86.5)
25.1
(77.2)
19.5
(67.1)
38.2
(100.8)
Mean daily maximum °C (°F)8.3
(46.9)
10.3
(50.5)
14.8
(58.6)
21.1
(70.0)
26.3
(79.3)
29.1
(84.4)
33.6
(92.5)
32.8
(91.0)
28.2
(82.8)
23.2
(73.8)
17.3
(63.1)
11.3
(52.3)
21.4
(70.4)
Daily mean °C (°F)4.6
(40.3)
6.4
(43.5)
10.3
(50.5)
16.2
(61.2)
21.4
(70.5)
24.7
(76.5)
28.9
(84.0)
28.2
(82.8)
24.0
(75.2)
18.8
(65.8)
12.9
(55.2)
7.0
(44.6)
17.0
(62.5)
Mean daily minimum °C (°F)1.8
(35.2)
3.5
(38.3)
7.0
(44.6)
12.4
(54.3)
17.5
(63.5)
21.4
(70.5)
25.2
(77.4)
24.9
(76.8)
20.9
(69.6)
15.4
(59.7)
9.3
(48.7)
3.7
(38.7)
13.6
(56.4)
Mean minimum °C (°F)−3.9
(25.0)
−2.3
(27.9)
0.8
(33.4)
5.8
(42.4)
12.1
(53.8)
16.9
(62.4)
21.5
(70.7)
21.4
(70.5)
16.0
(60.8)
9.0
(48.2)
2.5
(36.5)
−2.8
(27.0)
−4.6
(23.7)
Record low °C (°F)−8.6
(16.5)
−9.6
(14.7)
−3.5
(25.7)
0.2
(32.4)
7.3
(45.1)
12.8
(55.0)
17.3
(63.1)
18.2
(64.8)
12.0
(53.6)
1.0
(33.8)
−3.6
(25.5)
−8.4
(16.9)
−9.6
(14.7)
Average precipitation mm (inches)79.8
(3.14)
86.1
(3.39)
143.7
(5.66)
122.5
(4.82)
128.2
(5.05)
211.8
(8.34)
180.3
(7.10)
156.1
(6.15)
130.1
(5.12)
78.6
(3.09)
72.3
(2.85)
48.6
(1.91)
1,438.1
(56.62)
Average precipitation days (≥ 0.1 mm)12.412.115.314.513.814.612.413.811.79.09.38.5147.4
Average relative humidity (%)75757574748076787976747276
Mean monthly sunshine hours 102.097.2116.4140.6164.7136.6212.7193.0143.9144.6129.0128.71,709.4
Source: China Meteorological Administration (precipitation days and sunshine 1971–2000) [94] [95]

South China

Climate data for Hong Kong, normals 1991–2020, [lower-alpha 1] extremes 1884–1939 and 1947–present
MonthJanFebMarAprMayJunJulAugSepOctNovDecYear
Record high °C (°F)26.9
(80.4)
28.3
(82.9)
30.1
(86.2)
33.4
(92.1)
36.1
(97.0)
35.6
(96.1)
35.7
(96.3)
36.6
(97.9)
35.2
(95.4)
34.3
(93.7)
31.8
(89.2)
28.7
(83.7)
36.6
(97.9)
Mean maximum °C (°F)24.0
(75.2)
25.1
(77.2)
27.5
(81.5)
30.2
(86.4)
32.3
(90.1)
33.6
(92.5)
34.1
(93.4)
34.2
(93.6)
33.4
(92.1)
31.3
(88.3)
28.4
(83.1)
25.1
(77.2)
34.7
(94.5)
Mean daily maximum °C (°F)18.7
(65.7)
19.4
(66.9)
21.9
(71.4)
25.6
(78.1)
28.8
(83.8)
30.7
(87.3)
31.6
(88.9)
31.3
(88.3)
30.5
(86.9)
28.1
(82.6)
24.5
(76.1)
20.4
(68.7)
26.0
(78.8)
Daily mean °C (°F)16.5
(61.7)
17.1
(62.8)
19.5
(67.1)
23.0
(73.4)
26.3
(79.3)
28.3
(82.9)
28.9
(84.0)
28.7
(83.7)
27.9
(82.2)
25.7
(78.3)
22.2
(72.0)
18.2
(64.8)
23.5
(74.3)
Mean daily minimum °C (°F)14.6
(58.3)
15.3
(59.5)
17.6
(63.7)
21.1
(70.0)
24.5
(76.1)
26.5
(79.7)
26.9
(80.4)
26.7
(80.1)
26.1
(79.0)
23.9
(75.0)
20.3
(68.5)
16.2
(61.2)
21.6
(70.9)
Mean minimum °C (°F)9.1
(48.4)
10.2
(50.4)
12.2
(54.0)
16.3
(61.3)
20.7
(69.3)
23.6
(74.5)
24.2
(75.6)
24.3
(75.7)
23.5
(74.3)
20.1
(68.2)
15.3
(59.5)
10.1
(50.2)
7.8
(46.0)
Record low °C (°F)0.0
(32.0)
2.4
(36.3)
4.8
(40.6)
9.9
(49.8)
15.4
(59.7)
19.2
(66.6)
21.7
(71.1)
21.6
(70.9)
18.4
(65.1)
13.5
(56.3)
6.5
(43.7)
4.3
(39.7)
0.0
(32.0)
Average rainfall mm (inches)33.2
(1.31)
38.9
(1.53)
75.3
(2.96)
153.0
(6.02)
290.6
(11.44)
491.5
(19.35)
385.8
(15.19)
453.2
(17.84)
321.4
(12.65)
120.3
(4.74)
39.3
(1.55)
28.8
(1.13)
2,431.2
(95.72)
Average rainy days (≥ 0.1 mm)5.707.9710.5011.3715.3719.3318.4317.5014.907.835.705.30139.90
Average relative humidity (%)74798283838281817873727078
Mean monthly sunshine hours 145.8101.7100.0113.2138.8144.3197.3182.1174.4197.8172.3161.61,829.3
Percent possible sunshine 43322730343648464755524841
Source: Hong Kong Observatory [96] [97] [98]
Climate data for Guangzhou (normals 1971–2000, extremes 1961–2000)
MonthJanFebMarAprMayJunJulAugSepOctNovDecYear
Record high °C (°F)27.2
(81.0)
28.6
(83.5)
32.1
(89.8)
32.4
(90.3)
36.2
(97.2)
36.6
(97.9)
39.1
(102.4)
38.0
(100.4)
37.6
(99.7)
34.8
(94.6)
32.5
(90.5)
29.6
(85.3)
39.1
(102.4)
Mean daily maximum °C (°F)18.3
(64.9)
18.5
(65.3)
21.6
(70.9)
25.7
(78.3)
29.3
(84.7)
31.5
(88.7)
32.8
(91.0)
32.7
(90.9)
31.5
(88.7)
28.8
(83.8)
24.5
(76.1)
20.6
(69.1)
26.3
(79.4)
Daily mean °C (°F)13.9
(57.0)
15.2
(59.4)
18.1
(64.6)
22.4
(72.3)
25.8
(78.4)
27.8
(82.0)
28.9
(84.0)
28.8
(83.8)
27.5
(81.5)
24.7
(76.5)
20.1
(68.2)
15.5
(59.9)
22.4
(72.3)
Mean daily minimum °C (°F)10.3
(50.5)
11.7
(53.1)
15.2
(59.4)
19.5
(67.1)
22.7
(72.9)
24.8
(76.6)
25.5
(77.9)
25.4
(77.7)
24.0
(75.2)
20.8
(69.4)
15.9
(60.6)
11.5
(52.7)
18.9
(66.1)
Record low °C (°F)0.1
(32.2)
1.3
(34.3)
3.2
(37.8)
7.7
(45.9)
14.6
(58.3)
18.8
(65.8)
21.6
(70.9)
20.9
(69.6)
15.5
(59.9)
9.5
(49.1)
4.9
(40.8)
0.0
(32.0)
0.0
(32.0)
Average rainfall mm (inches)40.9
(1.61)
69.4
(2.73)
84.7
(3.33)
201.2
(7.92)
283.7
(11.17)
276.2
(10.87)
232.5
(9.15)
227.0
(8.94)
166.2
(6.54)
87.3
(3.44)
35.4
(1.39)
31.6
(1.24)
1,736.1
(68.33)
Average rainy days (≥ 0.1 mm)7.511.215.016.318.318.215.916.812.57.15.54.9149.2
Average relative humidity (%)72788284848482827872666678
Mean monthly sunshine hours 118.571.662.465.1104.0140.2202.0173.5170.2181.8172.7166.01,628
Percent possible sunshine 35221717263549434651525037
Source: China Meteorological Administration, [99] all-time extreme temperature [100]
Climate data for Haikou (1981–2010 normals, extremes 1951–2015)
MonthJanFebMarAprMayJunJulAugSepOctNovDecYear
Record high °C (°F)33.5
(92.3)
37.2
(99.0)
38.1
(100.6)
39.6
(103.3)
38.8
(101.8)
38.4
(101.1)
38.7
(101.7)
37.3
(99.1)
36.0
(96.8)
34.5
(94.1)
34.7
(94.5)
31.5
(88.7)
39.6
(103.3)
Mean daily maximum °C (°F)21.8
(71.2)
22.9
(73.2)
26.3
(79.3)
30.7
(87.3)
32.3
(90.1)
33.7
(92.7)
33.5
(92.3)
32.6
(90.7)
30.7
(87.3)
29.1
(84.4)
26.2
(79.2)
22.4
(72.3)
28.5
(83.3)
Daily mean °C (°F)18.4
(65.1)
19.4
(66.9)
22.2
(72.0)
26.0
(78.8)
27.9
(82.2)
29.0
(84.2)
29.1
(84.4)
28.6
(83.5)
27.4
(81.3)
26.0
(78.8)
23.3
(73.9)
19.8
(67.6)
24.8
(76.6)
Mean daily minimum °C (°F)16.1
(61.0)
17.2
(63.0)
19.6
(67.3)
23.2
(73.8)
25.1
(77.2)
25.9
(78.6)
26.0
(78.8)
25.9
(78.6)
25.0
(77.0)
23.7
(74.7)
21.0
(69.8)
17.8
(64.0)
22.2
(72.0)
Record low °C (°F)2.8
(37.0)
6.5
(43.7)
6.4
(43.5)
9.8
(49.6)
16.3
(61.3)
21.2
(70.2)
21.0
(69.8)
21.7
(71.1)
17.5
(63.5)
14.1
(57.4)
10.0
(50.0)
5.3
(41.5)
2.8
(37.0)
Average rainfall mm (inches)20.3
(0.80)
38.2
(1.50)
50.4
(1.98)
90.1
(3.55)
175.6
(6.91)
220.5
(8.68)
214.7
(8.45)
262.1
(10.32)
255.8
(10.07)
221.9
(8.74)
72.4
(2.85)
34.3
(1.35)
1,656.3
(65.2)
Average rainy days (≥ 0.1 mm)8.410.610.111.516.516.015.014.914.312.57.97.3145.0
Average relative humidity (%)85878582818180828379798082
Mean monthly sunshine hours 109.198.7137.3167.9218.1222.8251.3217.7193.8176.7144.8131.32,069.5
Percent possible sunshine 32313745545661555349433947
Source: China Meteorological Administration (precipitation days and sunshine 19712000), [8] [101] [102] all-time extreme temperature [103]

Climate change

Warming stripes of China between 1901 and 2019 Stripes ASIA-China- All of China -1901-2019-BK-withlabels.png
Warming stripes of China between 1901 and 2019

Climate change is having major effects on the Chinese economy, society and the environment. [104] [105] China is the largest emitter of carbon dioxide, through an energy infrastructure heavily focused on coal. Other industries, such as a burgeoning construction industry and industrial manufacturing, contribute heavily to carbon emissions. However, like other developing countries, on a per-capita basis, China's carbon emissions are considerably less than countries like the United States. [106] It has also been noted that higher-income countries have outsourced emissions-intensive industries to China. [107] [108] On the basis of cumulative CO2 emissions measured from 1751 through to 2017, China is responsible for 13% globally and about half of the United States' cumulative emissions. [109] [110] China is now the world's largest polluter and in 2023 recorded it's hottest year on record with an average temperature of 10.7 C. [111]

China is suffering from the negative effects of global warming in agriculture, forestry and water resources, and is expected to continue to see increased impacts. China's government is taking some measures to increase renewable energy, and other decarbonization efforts, vowing to hit peak emissions before 2030 and be carbon neutral by 2060 by adopting "more vigorous policies and measures." [112] The GHG emissions of China will probably peak in 2025, and by 2030 they will return to 2022 levels. However, such pathway still leads to 3 degree temperature rise. [113]

See also

Notes

  1. Mean monthly maxima and minima (i.e. the expected highest and lowest temperature readings at any point during the year or given month) calculated based on data in Hong Kong from 1991 to 2020.

Related Research Articles

<span class="mw-page-title-main">Dongfang, Hainan</span> County-level & Sub-prefectural city in Hainan, Peoples Republic of China

Dongfang is one of the seven county-level cities of Hainan province, China. Although called a "city", Dongfang refers to a large land area in Hainan - an area which was once a county. Within this area is the main city, Dongfang City. It is located on the western coast of Hainan Island facing Vietnam across the Gulf of Tonkin, and in 2004 had a population of 435,000.

<span class="mw-page-title-main">Huoshan County</span> County in Anhui, Peoples Republic of China

Huoshan is a county of western Anhui province, People's Republic of China, and is under the jurisdiction of Lu'an City. It has a population of 370,000 and an area of 2,042 square kilometres (788 sq mi). The government of Huoshan County is located in Hengshan Town.

<span class="mw-page-title-main">Jinghe County</span> County in Xinjiang, China

Jinghe County as the official romanized name, also transliterated from Uyghur as Jing County, is a county of the Xinjiang Uyghur Autonomous Region and is under the administration of the Börtala Mongol Autonomous Prefecture. It contains an area of 11,181 square kilometres (4,317 sq mi). According to the 2002 census, it has a population of 120,000.

<span class="mw-page-title-main">Zhangwu County</span> County in Liaoning, Peoples Republic of China

Zhangwu County is a county in the north of Liaoning province, China. It is under the administration of Fuxin City, the centre of which lies 82 kilometres (51 mi) to the southwest, with a population of 410,000 residing in an area of 3,635 km2 (1,403 sq mi). It is served by G25 Changchun–Shenzhen Expressway, G2511 Xinmin–Lubei Expressway, and China National Highways 101 and 304.

<span class="mw-page-title-main">Tongde County</span> County in Qinghai, China

Tongde County is a county of Qinghai province, China. It is under the administration of Hainan Tibetan Autonomous Prefecture.

<span class="mw-page-title-main">Darlag County</span> County in Qinghai, China

Darlag County is a county of southeastern Qinghai province, China, bordering Sichuan to the south and west. It is under the administration of Golog Tibetan Autonomous Prefecture. The county seat is in the Town of Gyümai.

<span class="mw-page-title-main">Madoi County</span> County in Qinghai, China

Madoi County is a county of Golog Tibetan Autonomous Prefecture, in southeast-central Qinghai province, bordering Sichuan to the south. Its area is about 25,000 km2 (9,700 sq mi), and with an average elevation of 4,300 m (14,000 ft) it is the highest Chinese county by average elevation. In Madoi County is the upper stream of the Yellow River which flows to Ngoring and Gyaring lake.

<span class="mw-page-title-main">Qumarlêb County</span> County in Qinghai, China

Qumarlêb County is a county in the northeast of the Yushu Tibetan Autonomous Prefecture, south-central Qinghai province, China.

<span class="mw-page-title-main">Dulan County</span> County in Qinghai, China

Dulan County is a county of east-central Qinghai province, China. It is under the administration of Haixi Mongol and Tibetan Autonomous Prefecture.

Huimin County is a county of northwestern Shandong province, People's Republic of China. It is under the administration of Binzhou City.

<span class="mw-page-title-main">Urad Middle Banner</span> Banner in Inner Mongolia, China

Urad Middle Banner is a banner of Inner Mongolia, China. It is located in the west of the region, and administratively is part of Bayan Nur City. It has a total area of 22,606 square kilometres (8,728 sq mi) and in 2020 had a population of 112,159.

Laoting County, often mispronounced as Leting County in accordance with the alternative frequently used Mandarin pronunciation, is a county in the northeast of Hebei province, People's Republic of China, facing the Bohai Sea to the east and south. It is under the administration of Tangshan City.

<span class="mw-page-title-main">Qian Gorlos Mongol Autonomous County</span> Autonomous county in Jilin, China

Qian Gorlos Mongolian Autonomous County, or simply Qian Gorlos County, commonly abbreviated as Qianguo County, is a county of northwestern Jilin province, China. It is under the administration of Songyuan City. Gorlos Mongols live here. Formerly known as Gorlos Front Banner (郭尔罗斯前旗).

<span class="mw-page-title-main">Yuanping</span> County-level city in Shanxi, Peoples Republic of China

Yuanping is a county-level city under the administration of the prefecture-level city of Xinzhou, in north-central Shanxi Province, China.

<span class="mw-page-title-main">Darhan Muminggan United Banner</span> Banner in Inner Mongolia, China

Darhan Muminggan United Banner is a banner of west-central Inner Mongolia, People's Republic of China. It is under the administration of Baotou City, 125 kilometres (78 mi) to the south-southwest.

<span class="mw-page-title-main">Linxi County, Inner Mongolia</span> County in Inner Mongolia, China

Linxi County is a county of eastern Inner Mongolia, China. It is under the administration of Chifeng City, 165 kilometres (103 mi) to the south-southeast.

<span class="mw-page-title-main">Jarud Banner</span> Banner in Inner Mongolia, China

Jarud Banner is a banner of eastern Inner Mongolia, China. It is under the administration of Tongliao City, 150 kilometres (93 mi), and the China National Highway 304 passes through the area.

Huade is a county of central Inner Mongolia, China, bordering Hebei province to the southeast, Xilin Gol League to the northeast, and Shangdu County to the west. It is under the administration of Ulaan Chab city.

<span class="mw-page-title-main">Arxan</span> County-level city in Inner Mongolia, China

Arxan is a county-level city in the Hinggan League of northeastern Inner Mongolia, China.

Abag Banner is a county of Inner Mongolia, China. It is under the administration of Xilingol League. Abag Mongols live here. The local dialect has variously been classified as Chakhar or Khalkha.

References

  1. "China logs 52.2 Celsius as extreme weather rewrites records". Reuters. 2023-07-17. Retrieved 2023-07-17.
  2. Salam, Erum; Abdul, Geneva; Jones, Sam; Ratcliffe, Rebecca; Wind, Emily (2023-07-17). "China confirms a record temperature of 52.5C [sic] over weekend". The Guardian. ISSN   0261-3077 . Retrieved 2023-07-17.
  3. "China just saw its coldest temperature on record: Minus-63 degrees". The Washington Post. 23 January 2022. Retrieved 25 January 2022.
  4. "China's northernmost city just saw its coldest day ever". CNN Travel. 24 January 2022. Retrieved 25 January 2023.
  5. 1 2 "The 6 climate zones of China". ClimateList. Retrieved 2018-12-19.
  6. Krishna, K. R. (2015-01-28). Agricultural Prairies: Natural Resources and Crop Productivity. CRC Press. ISBN   978-1-4822-5806-6.
  7. 中国气象数据网 - WeatherBk Data (in Chinese (China)). China Meteorological Administration . Retrieved 2020-04-15.
  8. 1 2 中国气象数据网 - WeatherBk Data (in Chinese (China)). China Meteorological Administration . Retrieved 2020-04-15.
  9. 为什么重庆、武汉、南京有"三大火炉"之称? (in Chinese). Guangzhou Popular Science News Net (广州科普资讯网). 2007-09-12. Archived from the original on 2014-11-12. Retrieved 2010-11-29.
  10. "存档副本". Archived from the original on 2013-10-02. Retrieved 2013-09-29.
  11. "吐鲁番城市介绍" 吐鲁番 – 气象数据 – 中国天气网. 中国天气. Archived from the original on 14 October 2013. Retrieved 30 June 2012.
  12. "If you can stand the heat, then the Turpan Basin is the place to be". Shanghai Daily. April 5, 2010. Archived from the original on April 7, 2010.
  13. Gorbunov, A.P. (1993), "Geocryology in Mt. Tianshan", PERMAFROST: Sixth International Conference. Proceedings. July 5–9, Beijing, China, vol. 2, South China University of Technology Press, pp. 1105–1107, ISBN   978-7-5623-0484-5
  14. 1 2 Bockheim, James G.; Munroe, Jeffrey S. (2014), "Organic carbon pools and genesis of alpine soils with permafrost: a review" (PDF), Arctic, Antarctic, and Alpine Research, 46 (4): 987–1006, doi: 10.1657/1938-4246-46.4.987 , S2CID   53400041, archived (PDF) from the original on 2016-09-23, retrieved 2016-04-25
  15. Regional Climate Studies of China. Springer. 2008. p. 1. Bibcode:2008rcsc.book.....F. ISBN   978-3-540-79242-0.
  16. Atlas of the People's Republic of China. Beijing: Foreign Languages Press. 1989. p.  . ISBN   0-8351-2319-7 via Internet Archive.
  17. Sternberg, Troy; Rueff, Henri; Middleton, Nick (2015-01-26). "Contraction of the Gobi Desert, 2000–2012". Remote Sensing. 7 (2): 1346–1358. Bibcode:2015RemS....7.1346S. doi: 10.3390/rs70201346 .
  18. An, Z (April 2000). "Asynchronous Holocene optimum of the East Asian monsoon". Quaternary Science Reviews. 19 (8): 743–762. Bibcode:2000QSRv...19..743A. doi:10.1016/S0277-3791(99)00031-1.
  19. Lu Dian's Piya (published in the Song dynasty). Cited in Sargent, Stuart Howard (2007). The Poetry of He Zhu (1052-1125): Genres, Contexts, and Creativity . Brill. p.  18. ISBN   978-90-04-15711-8.
  20. Owen, Stephen [translator & editor], Warner, Ding Xiang [editor], Kroll, Paul [editor] (2016). The Poetry of Du Fu Archived 2019-05-20 at the Wayback Machine Open Access logo PLoS transparent.svg , Volume 2. De Gruyter Mouton. Pages 298–299. ISBN   978-1-5015-0189-0
  21. Zhou, Weijian; Donahue, Douglas; Jull, A. J. T. (1997). "Radiocarbon AMS Dating of Pollen Concentrated from Eolian Sediments: Implications for Monsoon Climate Change Since the Late Quaternary". Radiocarbon. 39 (1): 19–26. doi: 10.1017/S0033822200040868 . ISSN   0033-8222.
  22. Weijian, Zhou; Donahue, Douglas J.; Porter, Stephen C.; Jull, Timothy A.; Xiaoqiang, Li; Stuiver, Minze; Zhisheng, An; Matsumoto, Eiji; Guangrong, Dong (1996). "Variability of Monsoon Climate in East Asia at the End of the Last Glaciation". Quaternary Research. 46 (3): 219–229. Bibcode:1996QuRes..46..219W. doi:10.1006/qres.1996.0062. ISSN   0033-5894. S2CID   129650707.
  23. "World Meteorological Organization's World Weather & Climate Extremes Archive".
  24. "The 16 deadliest storms of the last century". Business Insider India. September 13, 2017. Archived from the original on January 7, 2022. Retrieved February 23, 2022.
  25. Anderson-Berry, Linda J.; Weyman James C. (2008-02-26). "Fifth International Workshop on Tropycal Cyclones: Topic 5.1: Societal Impacts of Tropical Cyclones". World Meteorological Organization. National Oceanic and Atmospheric Administration. Archived from the original on 2012-11-14. Retrieved 2011-03-31.
  26. 1 2 Duan Yihong (2006). Typhoons Bilis and Saomai: why the impacts were so severe (Report). World Meteorological Organization. Archived from the original on July 14, 2014. Retrieved July 5, 2014.
  27. Typhoon Saomai: Impact and Historical Comparison (PDF) (Report). Guy Carpenter. November 2006. Archived from the original (PDF) on February 18, 2012. Retrieved July 5, 2014.
  28. "Typhoon Haiyan affects over 1,200 Hainan villages". Xinhua News Agency. November 12, 2013. Archived from the original on November 26, 2013. Retrieved November 12, 2013.
  29. 1 2 China Meteorological Administration (November 22, 2013). Member Report: China (PDF). ESCAP/WMO Typhoon Committee: 8th Integrated Workshop/2nd TRCG Forum. ESCAP/WMO Typhoon Committee. p. 16. Archived (PDF) from the original on December 3, 2013. Retrieved November 26, 2013.
  30. "Typhoon Fitow kills five in China". BBC.com. 2013-10-07. Retrieved 2014-03-07.
  31. "Typhoon-ravaged Chinese city recovers from flooding". ReliefWeb. Xinhua. 2013-10-18. Retrieved 2014-03-08.
  32. Zhang Hong (2013-10-10). "Fitow's remnants continue to batter Zhejiang province". South China Morning Post.  via Lexis Nexis (subscription required)
  33. "Typhoon Fitow-triggered downpours lash E. China". Xinhua. 2013-10-08. Archived from the original on October 12, 2013. Retrieved 2014-03-08.
  34. Member Report: China (PDF) (Report). 8th Integrated Workshop/2nd TRCG Forum. ESCAP/WMO Typhoon Committee. 2013. Retrieved 2014-03-06.
  35. "Typhoon In-Fa sweeps towards China after flooding chaos". BBC News. 2021-07-24. Archived from the original on July 25, 2021. Retrieved 2021-07-25.
  36. Meili, Cao (2021-07-26). 余姚暴雨累计雨量达951毫米 相当于余姚近三天下了约37个西湖的水量. Sina News (in Chinese). Archived from the original on 2021-07-27. Retrieved 2021-07-27.
  37. "China - Tropical Cylone IN-FA (GDACS, JTWC, CMA, Xinhua, media) (ECHO Daily Flash of 26 July 2021) - China". ReliefWeb. Archived from the original on July 26, 2021. Retrieved 2021-07-26.
  38. Henson, Bob; Masters, Jeff (14 September 2022). "Typhoon Muifa sweeps into Shanghai; Caribbean eyes new tropical depression". Yale Climate Connections. Retrieved 14 September 2022.
  39. "Dealing with the Deluge". PBS NOVA Online. 26 March 1996. Retrieved 12 February 2013.
  40. Glantz, Mickey. Glantz, Michael H (2003). Climate Affairs: A Primer. Island Press. ISBN   1-55963-919-9. p. 252.
  41. Kueh, Y.Y. (1995). Agricultural Instability in China, 1931–1990: Weather, Technology, and Institutions. Oxford University Press. ISBN   0-19-828777-1.
  42. 1 2 William Graves (1982). The Torrent of Life (Journey into China) (5th ed.). National Geographic Society. ISBN   978-0-87044-437-1.
  43. Pietz, David (2002). Engineering the State: The Huai River and Reconstruction in Nationalist China 1927–1937. Routledge. ISBN   0-415-93388-9. pp. xvii, 61–70.
  44. "被遗忘的1931年中国水灾" (in Chinese). Tsinghua University Institute of Qing History. Archived from the original on 3 April 2016. Retrieved 20 January 2019.
  45. 1 2 "Yangtze River floods". Encyclopedia Britannica. Archived from the original on January 21, 2018. Retrieved January 20, 2018.
  46. Spignesi, Stephen J. (2004). Catastrophe!: the 100 greatest disasters of all time. Citadel Press. ISBN   0-8065-2558-4. p 37.
  47. "Global Catastrophe Recap November 2020 Archived 2022-10-09 at Ghost Archive" (PDF). Aon. December 10, 2020. Retrieved December 19, 2020.
  48. "Flood destruction in China cost $32B, authorities say". UPI. Retrieved 2020-12-19.
  49. "China weather: Tornado and hail kill scores in Jiangsu". BBC. June 23, 2016. Retrieved June 23, 2016.
  50. "江苏盐城龙卷风冰雹已造成98人死800人伤" (in Chinese). Sina Corp. June 24, 2016. Retrieved June 24, 2016.
  51. Xue, Ming; Zhao, Kun; Wang, Mingjung; Li, Zhaohui & Zheng, Yongguang (November 2016). "Recent Significant Tornadoes in China" (PDF). Advances in Atmospheric Sciences. 33 (11): 1209–1217. Bibcode:2016AdAtS..33.1209X. doi: 10.1007/s00376-016-6005-2 . S2CID   125749025. Archived (PDF) from the original on March 16, 2017. Retrieved March 15, 2024.
  52. 1 2 中国地面国际交换站气候标准值数据集 (1971–2000年) (in Simplified Chinese). China Meteorological Administration. May 2011. Archived from the original on 21 September 2013. Retrieved 23 May 2011.
  53. 中国地面国际交换站气候标准值月值数据集(1971-2000年). China Meteorological Administration. Archived from the original on 2013-09-21. Retrieved 2010-05-25.
  54. "Climate of Hong Kong". Hong Kong Observatory. Archived from the original on 2 June 2017. Retrieved 5 September 2017.
  55. "Environmental Performance Index | Environmental Performance Index" . Retrieved 15 August 2022.
  56. China Weighs Environmental Costs; Beijing Tries to Emphasize Cleaner Industry Over Unbridled Growth After Signs Mount of Damage Done Archived 30 September 2019 at the Wayback Machine 23 July 2013
  57. Waghorn, Terry (7 March 2011). "Fighting Desertification". Forbes. Retrieved 21 January 2020.
  58. "Beijing hit by eighth sandstorm". BBC News. 17 April 2006. Retrieved 21 January 2020.
  59. Coonan, Clifford (9 November 2007). "The gathering sandstorm: Encroaching desert, missing water". The Independent. Archived from the original on 24 April 2008. Retrieved 23 July 2014.
  60. Reilly, Michael (24 November 2008). "Himalaya glaciers melting much faster". NBC News. Retrieved 21 September 2011.
  61. China's New Growth Pathway: From the 14th Five-Year Plan to Carbon Neutrality (PDF) (Report). Energy Foundation China. December 2020. p. 24. Archived from the original (PDF) on 16 April 2021. Retrieved 16 December 2020.
  62. Chow, Gregory (2006) Are Chinese Official Statistics Reliable? CESifo Economic Studies 52. 396–414. 10.1093/cesifo/ifl003
  63. Liu G, Wang X, Baiocchi G, Casazza M, Meng F, Cai Y, Hao Y, Wu F, Yang Z (October 2020). "On the accuracy of official Chinese crop production data: Evidence from biophysical indexes of net primary production". Proceedings of the National Academy of Sciences . 117 (41): 25434–25444. doi: 10.1073/pnas.1919850117 . PMC   7568317 . PMID   32978301.
  64. "Countries by commodity". FAOSTAT . Retrieved 16 January 2020.
  65. 1991-2020 normals "Climate averages from 1991 to 2020". China Meteorological Administration . Archived from the original on 2023-04-17.
  66. 1981-2010 extremes 中国气象数据网 – WeatherBk Data (in Simplified Chinese). China Meteorological Administration . Retrieved 14 April 2023.
  67. "Extreme Temperatures Around the World" . Retrieved 2013-02-21.
  68. 2021 February weather data "Global Surface Summary of the Day - GSOD". National Oceanic and Atmospheric Administration. Archived from the original on 2023-04-30. Retrieved 30 April 2023.
  69. Burt, Christopher C. "UPDATE June 1: Record May Heat Wave in Northeast China, Koreas". Wunderground. Retrieved 2014-06-01.
  70. Burt, Christopher C. ": Record June Heat Wave in Northeast China, Koreas". Wunderground. Retrieved 2023-06-23.
  71. "Beijing, China - Detailed climate information and monthly weather forecast". Weather Atlas. Yu Media Group. Retrieved 2019-07-09.
  72. 中国气象局 国家气象信息中心 (in Simplified Chinese). China Meteorological Administration. June 2011. Archived from the original on July 10, 2014. Retrieved November 20, 2010.
  73. 1 2 "Index" 中国气象数据网 – WeatherBk Data. China Meteorological Administration. Archived from the original on 5 September 2018. Retrieved 9 November 2018.
  74. 中国地面国际交换站气候标准值月值数据集(1971-2000年) (in Chinese (China)). China Meteorological Administration. Archived from the original on 2013-10-16. Retrieved 2009-03-17.
  75. 哈尔滨城市介绍以及气候背景分析. Weather China (in Chinese (China)). 中国气象局公共气象服务中心. Archived from the original on 30 June 2013. Retrieved 27 July 2013.
  76. "Harbin, China - Detailed climate information and monthly weather forecast". Weather Atlas. Yu Media Group. Archived from the original on 2019-07-09. Retrieved 2019-07-09.
  77. 中国气象数据网 – WeatherBk Data (in Simplified Chinese). China Meteorological Administration . Retrieved 10 October 2023.
  78. 中国气象数据网 (in Simplified Chinese). China Meteorological Administration . Retrieved 10 October 2023.
  79. 中国地面国际交换站气候标准值月值数据集(1971-2000年). China Meteorological Administration. Archived from the original on 2013-09-21. Retrieved 2010-05-25.
  80. "Extreme Temperatures Around the World" . Retrieved 2010-08-28.
  81. 中国地面国际交换站气候标准值月值数据集(1971-2000年) (in Chinese). China Meteorological Administration. Archived from the original on 2013-09-21. Retrieved 2010-05-04.
  82. "Extreme Temperatures Around the World" . Retrieved 2013-02-21.
  83. "55591: Lhasa (China)". ogimet.com. OGIMET. 28 March 2022. Retrieved 29 March 2022.
  84. "Index" 中国气象数据网 - WeatherBk Data. China Meteorological Administration. Archived from the original on 23 September 2017. Retrieved 9 November 2018.
  85. "Monthly weather forecast and climate - Chongqing, China". Weather Atlas. Retrieved 12 June 2020.
  86. 中国气象数据网 – WeatherBk Data (in Chinese (China)). China Meteorological Administration . Retrieved April 15, 2020.
  87. 中国地面国际交换站气候标准值月值数据集(1971–2000年). China Meteorological Administration. Archived from the original on September 21, 2013. Retrieved May 25, 2010.
  88. 中国气象局 国家气象信息中心 (in Simplified Chinese). China Meteorological Administration. June 2011. Archived from the original on 2009-07-16. Retrieved 2009-03-17.
  89. "Extreme Temperatures Around the World". Archived from the original on August 4, 2014. Retrieved February 21, 2013.
  90. 中国地面国际交换站气候标准值月值数据集 (in Chinese). China Meteorological Administration . Retrieved 2014-06-11.
  91. CMA台站气候标准值(1991-2020) (in Chinese). China Meteorological Administration . Retrieved 2023-04-11.
  92. 中国气象局 国家气象信息中心 (in Simplified Chinese). China Meteorological Administration. Archived from the original on 2013-03-18. Retrieved 2013-02-18.
  93. "Index" 中国气象数据网 – WeatherBk Data. China Meteorological Administration. Archived from the original on 2018-09-05. Retrieved 2018-11-09.
  94. 中国气象数据网 – WeatherBk Data (in Chinese (China)). China Meteorological Administration . Retrieved 2020-04-15.
  95. 中国地面国际交换站气候标准值月值数据集(1971-2000年). China Meteorological Administration. Archived from the original on 2013-09-21. Retrieved 2010-05-25.
  96. "Monthly Meteorological Normals for Hong Kong (1991-2020)". Hong Kong Observatory. Retrieved 7 February 2021.
  97. "Extreme Values and Dates of Occurrence of Extremes of Meteorological Elements between 1884-1939 and 1947-2020 for Hong Kong)". Hong Kong Observatory. Retrieved 7 February 2021.
  98. "Monthly Data for Single Element". Hong Kong Observatory. Retrieved 16 February 2022.
  99. 中国地面国际交换站气候标准值月值数据集(1971-2000年) (in Chinese). China Meteorological Administration. Archived from the original on 2013-09-21. Retrieved August 12, 2016.
  100. "Extreme Temperatures Around the World". Archived from the original on August 4, 2014. Retrieved 2010-12-01.
  101. "无标题文档". Archived from the original on 2014-07-10. Retrieved 2020-04-22.
  102. 中国地面国际交换站气候标准值月值数据集(1971-2000年). China Meteorological Administration. Archived from the original on 2013-09-21. Retrieved 2010-05-25.
  103. "Extreme Temperatures Around the World" . Retrieved 2013-02-21.
  104. World Bank. "China Country Climate and Development Report" (PDF).
  105. "China National communication 3: Part III Impacts of Climate Change and Adaptation". unfccc.int. Archived from the original on 14 November 2019. Retrieved 26 September 2019.
  106. "DataBank - CO2 emissions (metric tons per capita)". The World Bank. Archived from the original on 3 October 2020. Retrieved 10 August 2020.
  107. Malik, Arunima; Lan, Jun (2 April 2016). "The role of outsourcing in driving global carbon emissions". Economic Systems Research. 28 (2): 168–182. doi:10.1080/09535314.2016.1172475. ISSN   0953-5314. S2CID   156212231. Archived from the original on 24 July 2021. Retrieved 24 July 2021. high-income resource-poor nations such as the United Kingdom, Germany and France (...) outsource carbon-intensive production to China
  108. Plumer, Brad (4 September 2018). "You've Heard of Outsourced Jobs, but Outsourced Pollution? It's Real, and Tough to Tally Up". The New York Times. ISSN   0362-4331. Archived from the original on 25 July 2021. Retrieved 24 July 2021.
  109. "Who has contributed most to global CO2 emissions?". Our World in Data. Archived from the original on 25 October 2021. Retrieved 28 October 2021.
  110. "The hard truths of climate change — by the numbers". www.nature.com. Archived from the original on 26 August 2022. Retrieved 28 October 2021.
  111. Regan, Helen (2024-01-05). "2023 was China's hottest year on record, marked by multiple deadly extreme weather events". CNN. Retrieved 2024-01-07.
  112. "Climate change: China aims for 'carbon neutrality by 2060'". BBC News. 22 September 2020. Archived from the original on 26 January 2021. Retrieved 22 September 2020.
  113. Lui, Swithin (19 May 2022). "Guest post: Why China is set to significantly overachieve its 2030 climate goals". Carbon Brief. Archived from the original on 23 May 2022. Retrieved 24 May 2022.