| |||||||||||||||||||||||||||||||||||||||||||||||||||||||||||
20 seats (out of 60 seats) 31 seats seats needed for a majority | |||||||||||||||||||||||||||||||||||||||||||||||||||||||||||
---|---|---|---|---|---|---|---|---|---|---|---|---|---|---|---|---|---|---|---|---|---|---|---|---|---|---|---|---|---|---|---|---|---|---|---|---|---|---|---|---|---|---|---|---|---|---|---|---|---|---|---|---|---|---|---|---|---|---|---|
|
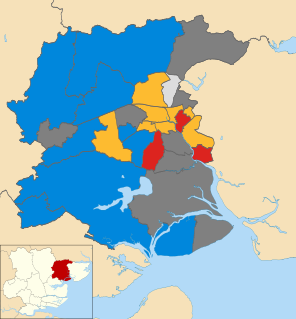
The 2006 Colchester Borough Council election took place on 4 May 2006 to elect members of Colchester Borough Council in Essex, England. One third of the council was up for election and the council stayed under no overall control. [1]
Borough status in the United Kingdom is granted by royal charter to local government districts in England, Wales and Northern Ireland. The status is purely honorary, and does not give any additional powers to the council or inhabitants of the district. In Scotland, similarly chartered communities were known as royal burghs, although the status is no longer granted.
Essex is a county in the south-east of England, north-east of London. One of the home counties, it borders Suffolk and Cambridgeshire to the north, Hertfordshire to the west, Kent across the estuary of the River Thames to the south, and London to the south-west. The county town is Chelmsford, the only city in the county. For government statistical purposes Essex is placed in the East of England region.
England is a country that is part of the United Kingdom. It shares land borders with Wales to the west and Scotland to the north-northwest. The Irish Sea lies west of England and the Celtic Sea lies to the southwest. England is separated from continental Europe by the North Sea to the east and the English Channel to the south. The country covers five-eighths of the island of Great Britain, which lies in the North Atlantic, and includes over 100 smaller islands, such as the Isles of Scilly and the Isle of Wight.
After the election, the composition of the council was
The Conservative Party, officially the Conservative and Unionist Party, is a centre-right political party in the United Kingdom. Presently led by Theresa May, it has been the governing party since 2010. It presently has 314 Members of Parliament in the House of Commons, 249 members of the House of Lords, and 18 members of the European Parliament. It also has 31 Members of the Scottish Parliament, 12 members of the Welsh Assembly, eight members of the London Assembly and 9,008 local councillors. One of the major parties of UK politics, it has formed the government on 45 occasions, more than any other party.
The Liberal Democrats are a liberal political party in the United Kingdom. They presently have 11 Members of Parliament in the House of Commons, 96 members of the House of Lords, and one member of the European Parliament. They also have five Members of the Scottish Parliament and a member each in the Welsh Assembly and London Assembly. The party reached the height of its influence in the early 2010s, forming a junior partner in a coalition government from 2010 to 2015. It is presently led by Vince Cable.
The Labour Party is a centre-left political party in the United Kingdom which has been described as an alliance of social democrats, democratic socialists and trade unionists. The party's platform emphasises greater state intervention, social justice and strengthening workers' rights.
Before the election the Conservatives had run the council since the 2004 election and had 28 of the 60 seats on the council. [3] The Liberal Democrats had 22 seats, Labour had 7 seats and there were 3 independents. [3]
20 seats were contested at the election, with the councillors who were defending seats including the Conservative leader of the council, John Jowers, the mayor Terry Sutton and the Liberal Democrat group leader, Colin Sykes. [3] However the Conservatives did not have a candidate in New Town ward due to an error on their candidate's nomination papers. [4] As well as the parties who were defending seats on the council, the Green Party contested every seat for the first time and particularly targeted Castle ward. [3] Independents who stood included Gerard Oxford in Highwoods ward, who was defending a seat he had won as a Liberal Democrat before leaving the party. [3]
A Councillor is a member of a local government council.
In England, the offices of mayor and lord mayor have long been ceremonial posts, with few or no duties attached to them. In recent years they have doubled as more influential political roles while retaining the ceremonial functions. A mayor's term of office denotes the municipal year. The most famous example is that of the Lord Mayor of the City of London.
The wards and electoral divisions in the United Kingdom are electoral districts at sub-national level represented by one or more councillors. The ward is the primary unit of English electoral geography for civil parishes and borough and district councils, electoral ward is the unit used by Welsh principal councils, while the electoral division is the unit used by English county councils and some unitary authorities. Each ward/division has an average electorate of about 5,500 people, but ward-population counts can vary substantially. As at the end of 2014 there were 9,456 electoral wards/divisions in the UK.
A major issue at the election was the relocation of the bus station to a temporary site, while a new bus station was being built at a new shopping centre. [3] Meanwhile, a Visual Arts Facility (VAF) was being built on the old bus station site. [3] 6 independents stood at the election as part of a Save Our Bus Station Campaign opposing the move, with the Labour party also opposing the building of the VAF on the old bus station site. [3] However the Conservatives said the temporary bus station site would be better than the old site. [3]
A bus station is a structure where city or intercity buses stop to pick up and drop off passengers. While the term bus depot also refers to a bus station, it can also refer to a bus garage. A bus station is larger than a bus stop, which is usually simply a place on the roadside, where buses can stop. It may be intended as a terminal station for a number of routes, or as a transfer station where the routes continue.
A shopping mall is a modern, chiefly North American, term for a form of shopping precinct or shopping center, in which one or more buildings form a complex of shops representing merchandisers with interconnecting walkways that enable customers to walk from unit to unit. A shopping arcade is a specific type of shopping precinct which is usually distinguished in English for mall shopping by the fact that connecting walkways are not owned by a single proprietor and are in open air. Shopping malls in 2017 accounted for 8% of retailing space in the United States.
Both the Liberal Democrats and Greens called for more recycling, while the Liberal Democrat and Labour parties called for action on street cleaning. [3] The Conservatives meanwhile defending their record in power, pointing to a number of new projects being started including a planned new community stadium. [3]
Recycling is the process of converting waste materials into new materials and objects. It is an alternative to "conventional" waste disposal that can save material and help lower greenhouse gas emissions. Recycling can prevent the waste of potentially useful materials and reduce the consumption of fresh raw materials, thereby reducing: energy usage, air pollution, and water pollution.
The Conservatives made a net gain of 2 seats to have half of the seats on the council with 30 councillors, just falling short of winning a majority. [5] Conservative gains included defeating the Liberal Democrat group leader Colin Sykes, with the Liberal Democrats falling to 21 seats. [5] Labour remained on 7 seats after holding the only seat they had been defending, but polled less than the Greens in a number of wards. [5] Overall turnout at the election was 36.4%. [6]
Party | Seats | Gains | Losses | Net gain/loss | Seats % | Votes % | Votes | +/− | |
---|---|---|---|---|---|---|---|---|---|
Conservative | 10 | 3 | 1 | +2 | 50.0 | 38.9 | 13,951 | -2.0% | |
Liberal Democrat | 8 | 1 | 2 | -1 | 40.0 | 33.8 | 12,119 | -0.4% | |
Labour | 1 | 0 | 0 | 0 | 5.0 | 13.3 | 4,754 | -4.9% | |
Independent | 1 | 0 | 1 | -1 | 5.0 | 5.5 | 1,986 | -1.2% | |
Green | 0 | 0 | 0 | 0 | 0 | 8.5 | 3,061 | +8.5% |
Party | Candidate | Votes | % | ± | |
---|---|---|---|---|---|
Liberal Democrat | Terence Sutton | 767 | 42.2 | -3.5 | |
Labour | John Cooke | 587 | 32.3 | +1.8 | |
Conservative | Pauline Hazell | 328 | 18.1 | -5.7 | |
Green | Charles Bather | 134 | 7.4 | +7.4 | |
Majority | 180 | 9.9 | -5.4 | ||
Turnout | 1,816 | 34.0 | +5.2 | ||
Liberal Democrat hold | Swing |
Party | Candidate | Votes | % | ± | |
---|---|---|---|---|---|
Conservative | Kevin Bentley | 1,224 | 66.6 | -5.2 | |
Liberal Democrat | Jonathan Longman | 325 | 17.7 | +3.6 | |
Labour | Abigail Tootal | 128 | 7.0 | -6.6 | |
Green | Samuel Elliott | 108 | 5.9 | +5.9 | |
Independent | Jeannine McAndrew | 53 | 2.9 | +2.9 | |
Majority | 899 | 48.9 | -8.8 | ||
Turnout | 1,838 | 42.1 | +11.1 | ||
Conservative hold | Swing |
Party | Candidate | Votes | % | ± | |
---|---|---|---|---|---|
Liberal Democrat | Christopher Hall | 1,122 | 48.7 | -9.2 | |
Green | Peter Lynn | 522 | 22.6 | +22.6 | |
Conservative | Benjamin Twitchen | 418 | 18.1 | -9.6 | |
Labour | Mark Warner | 187 | 8.1 | -6.4 | |
Independent | Stephen Miller | 57 | 2.5 | +2.5 | |
Majority | 600 | 26.0 | -4.2 | ||
Turnout | 2,306 | 41.5 | +6.1 | ||
Liberal Democrat hold | Swing |
Party | Candidate | Votes | % | ± | |
---|---|---|---|---|---|
Liberal Democrat | Nicholas Cope | 615 | 43.7 | -4.3 | |
Conservative | Andrew Bright | 468 | 33.3 | -9.3 | |
Green | Alexander Cave | 245 | 17.4 | +17.4 | |
Labour | David Hough | 79 | 5.6 | -3.4 | |
Majority | 147 | 10.4 | +10.0 | ||
Turnout | 1,407 | 48.3 | +4.9 | ||
Liberal Democrat hold | Swing |
Party | Candidate | Votes | % | ± | |
---|---|---|---|---|---|
Conservative | Christopher Arnold | 942 | 66.6 | -5.3 | |
Liberal Democrat | Barry Woodward | 176 | 12.4 | -2.1 | |
Labour | Christopher Aldous | 119 | 8.4 | -4.6 | |
Green | Clarice Mort | 114 | 8.1 | +8.1 | |
Independent | Jack Pooley | 63 | 4.5 | +4.5 | |
Majority | 766 | 54.2 | -3.2 | ||
Turnout | 1,414 | 36.7 | +9.1 | ||
Conservative hold | Swing |
Party | Candidate | Votes | % | ± | |
---|---|---|---|---|---|
Liberal Democrat | Patricia Blandon | 762 | 63.8 | +12.6 | |
Conservative | Anne Allan | 216 | 18.1 | -7.1 | |
Labour | Rossanna Trudgian | 139 | 11.6 | -12.1 | |
Green | Timothy Glover | 77 | 6.4 | +6.4 | |
Majority | 546 | 45.7 | +19.7 | ||
Turnout | 1,194 | 29.7 | +2.5 | ||
Liberal Democrat hold | Swing |
Party | Candidate | Votes | % | ± | |
---|---|---|---|---|---|
Independent | Gerard Oxford | 1,147 | 58.2 | +15.7 | |
Liberal Democrat | David Offen | 299 | 15.2 | -11.5 | |
Conservative | Susan Harper | 293 | 14.9 | -7.4 | |
Labour | Julia Thomas | 148 | 7.5 | -1.1 | |
Green | Keith Brooke | 84 | 4.3 | +4.3 | |
Majority | 848 | 43.0 | +27.2 | ||
Turnout | 1,971 | 32.6 | +2.3 | ||
Independent hold | Swing |
Party | Candidate | Votes | % | ± | |
---|---|---|---|---|---|
Conservative | Sonia Lewis | 1,282 | 65.8 | +3.5 | |
Liberal Democrat | Gwendoline Ilott | 385 | 19.8 | -9.9 | |
Green | Peter Appleton | 105 | 5.4 | +5.4 | |
Labour | Luke Dopson | 103 | 5.3 | -2.7 | |
Independent | Susan Francis | 73 | 3.7 | +3.7 | |
Majority | 897 | 46.0 | +13.4 | ||
Turnout | 1,948 | 47.1 | +2.4 | ||
Conservative hold | Swing |
Party | Candidate | Votes | % | ± | |
---|---|---|---|---|---|
Conservative | Nicholas Taylor | 939 | 46.2 | +0.1 | |
Liberal Democrat | Michael Turrell | 791 | 38.9 | -3.8 | |
Green | Mary Bryan | 130 | 6.4 | +6.4 | |
Labour | Janet Smith | 125 | 6.2 | -5.0 | |
Independent | Edmund Chinnery | 46 | 2.3 | +2.3 | |
Majority | 148 | 7.3 | +3.9 | ||
Turnout | 2,031 | 38.5 | +10.2 | ||
Conservative hold | Swing |
Party | Candidate | Votes | % | ± | |
---|---|---|---|---|---|
Liberal Democrat | Theresa Higgins | 1,029 | 65.4 | +10.1 | |
Green | Maria Iacovou | 339 | 21.5 | +21.5 | |
Labour | Scott Harris | 206 | 13.1 | -4.1 | |
Majority | 690 | 43.8 | +16.0 | ||
Turnout | 1,574 | 28.8 | +0.6 | ||
Liberal Democrat hold | Swing |
Party | Candidate | Votes | % | ± | |
---|---|---|---|---|---|
Conservative | Susan Lissimore | 1,368 | 53.6 | +4.6 | |
Liberal Democrat | Paul Sheppard | 885 | 34.7 | -8.5 | |
Labour | Michael Dale | 186 | 7.3 | -0.5 | |
Green | Beverley Maltby | 115 | 4.5 | +4.5 | |
Majority | 483 | 18.9 | +13.2 | ||
Turnout | 2,554 | 43.7 | -1.1 | ||
Conservative gain from Liberal Democrat | Swing | ||||
Party | Candidate | Votes | % | ± | |
---|---|---|---|---|---|
Conservative | Robert Davidson | 532 | 61.4 | -5.5 | |
Liberal Democrat | Carolyn Catney | 108 | 12.5 | -20.6 | |
Independent | Timothy Oxton | 100 | 11.5 | +11.5 | |
Green | Tobie Glenny | 67 | 7.7 | +7.7 | |
Labour | Barbara Nichols | 60 | 6.9 | +6.9 | |
Majority | 424 | 48.9 | +15.0 | ||
Turnout | 867 | 42.4 | -0.6 | ||
Conservative hold | Swing |
Party | Candidate | Votes | % | ± | |
---|---|---|---|---|---|
Labour | Julie Young | 922 | 53.4 | +0.6 | |
Liberal Democrat | Peter Simpson | 504 | 29.2 | +4.9 | |
Conservative | Alexander Wilson | 215 | 12.4 | -10.5 | |
Green | Sophie Lovejoy | 87 | 5.0 | +5.0 | |
Majority | 418 | 24.2 | -4.4 | ||
Turnout | 1,728 | 28.2 | +5.9 | ||
Labour hold | Swing |
Party | Candidate | Votes | % | ± | |
---|---|---|---|---|---|
Liberal Democrat | Michael Hogg | 1,071 | 51.8 | -2.9 | |
Labour | Kim Naish | 546 | 26.4 | +6.6 | |
Conservative | Shahid Husain | 284 | 13.7 | -11.8 | |
Green | Lucy Glover | 166 | 8.0 | +8.0 | |
Majority | 525 | 25.4 | -3.9 | ||
Turnout | 2,067 | 32.7 | +4.4 | ||
Liberal Democrat hold | Swing |
Party | Candidate | Votes | % | ± | |
---|---|---|---|---|---|
Liberal Democrat | Raymond Gamble | 1,105 | 61.8 | +6.4 | |
Conservative | Simon Lucas | 523 | 29.2 | -5.8 | |
Labour | Hugh Thomas | 82 | 4.6 | -4.9 | |
Green | Annick Collins-Leyssen | 79 | 4.4 | +4.4 | |
Majority | 582 | 32.5 | +12.1 | ||
Turnout | 1,789 | 43.4 | +3.2 | ||
Liberal Democrat hold | Swing |
Party | Candidate | Votes | % | ± | |
---|---|---|---|---|---|
Liberal Democrat | Linda Barton | 793 | 42.0 | +5.6 | |
Conservative | Winifred Foster | 637 | 33.7 | -4.7 | |
Labour | David Canning | 370 | 19.6 | -5.7 | |
Green | Walter Schwarz | 90 | 4.8 | +4.8 | |
Majority | 156 | 8.3 | |||
Turnout | 1,890 | 32.8 | -1.2 | ||
Liberal Democrat gain from Conservative | Swing | ||||
Party | Candidate | Votes | % | ± | |
---|---|---|---|---|---|
Conservative | Gaye Pyman | 1,000 | 44.0 | -3.7 | |
Liberal Democrat | Colin Sykes | 956 | 42.0 | +3.0 | |
Labour | John Spademan | 193 | 8.5 | -4.7 | |
Green | Pamela Nelson | 125 | 5.5 | +5.5 | |
Majority | 44 | 1.9 | -6.8 | ||
Turnout | 2,274 | 38.2 | +2.9 | ||
Conservative gain from Liberal Democrat | Swing | ||||
Party | Candidate | Votes | % | ± | |
---|---|---|---|---|---|
Conservative | John Elliott | 974 | 54.4 | +13.4 | |
Independent | Helen Bunney | 271 | 15.1 | -17.7 | |
Labour | Audrey Spencer | 261 | 14.6 | -11.6 | |
Liberal Democrat | John Stevens | 173 | 9.7 | +9.7 | |
Green | Katherine Bamforth | 110 | 6.1 | +6.1 | |
Majority | 703 | 39.3 | +31.1 | ||
Turnout | 1,789 | 30.4 | -7.5 | ||
Conservative gain from Independent | Swing | ||||
Party | Candidate | Votes | % | ± | |
---|---|---|---|---|---|
Conservative | Dennis Willetts | 919 | 63.6 | -2.8 | |
Liberal Democrat | John Stevens | 253 | 17.5 | -2.9 | |
Green | Roger Bamforth | 158 | 10.9 | +10.9 | |
Labour | Ian Yates | 114 | 7.9 | -4.9 | |
Majority | 666 | 46.1 | +0.1 | ||
Turnout | 1,444 | 38.2 | +7.9 | ||
Conservative hold | Swing |
Party | Candidate | Votes | % | ± | |
---|---|---|---|---|---|
Conservative | John Jowers | 1,389 | 70.5 | -0.5 | |
Green | Christopher Fox | 206 | 10.5 | +10.5 | |
Labour | James Spencer | 199 | 10.1 | -4.7 | |
Independent | John Coombes | 176 | 8.9 | +8.9 | |
Majority | 1,183 | 60.1 | +3.9 | ||
Turnout | 1,970 | 34.8 | -3.8 | ||
Conservative hold | Swing |
Colchester Politics: Colchester is a historic town located in Essex, England. It served as the first capital of Roman Britain and makes a claim to be the oldest town in Britain.
The 2007 St Helens Metropolitan Borough Council election took place on 3 May 2007 to elect members of St Helens Metropolitan Borough Council in Merseyside, England. One third of the council was up for election and the council stayed under no overall control.
The 2006 South Tyneside Metropolitan Borough Council election took place on 4 May 2006 to elect members of South Tyneside Metropolitan Borough Council in Tyne and Wear, England. One third of the council was up for election and the Labour party stayed in overall control of the council.
The 2006 Halton Borough Council election took place on 4 May 2006 to elect members of Halton Unitary Council in Cheshire, England. One third of the council was up for election and the Labour party stayed in overall control of the council.
The 2006 Rushmoor Council election took place on 4 May 2006 to elect members of Rushmoor Borough Council in Hampshire, England. One third of the council was up for election and the Conservative party stayed in overall control of the council.
The 2008 Sandwell Metropolitan Borough Council election took place on 1 May 2008 to elect members of Sandwell Metropolitan Borough Council in the West Midlands, England. One third of the council was up for election and the Labour party stayed in overall control of the council.
The 2006 Maidstone Borough Council election took place on 4 May 2006 to elect members of Maidstone Borough Council in Kent, England. One third of the council was up for election and the council stayed under no overall control.
The 2012 Colchester Borough Council election took place on 3 May 2012 to elect members of Colchester Borough Council in Essex, England. One third of the council was up for election and the council stayed under no overall control.
The 2002 Colchester Borough Council election took place on 2 May 2002 to elect members of Colchester Borough Council in Essex, England. This was the same day as the other 2002 local elections in the United Kingdom. Due to boundary changes, every seat was up for election and the council stayed under no overall control.
The 2003 Colchester Borough Council election took place on 1 May 2003 to elect members of Colchester Borough Council in Essex, England. This was the same day as the other 2003 United Kingdom local elections. One third of the seats were up for election and the council stayed under no overall control.
The 2004 Colchester Borough Council election took place on 10 June 2004 to elect members of Colchester Borough Council in Essex, England. This was the same day as the other 2004 United Kingdom local elections and as the 2004 European Parliament Elections. One third of the seats were up for election and the council stayed under no overall control.
The 2000 Colchester Borough Council election took place on 4 May 2000 to elect members of Colchester Borough Council in Essex, England. One third of the council was up for election and the council stayed under no overall control.
The 2007 Colchester Borough Council election took place on 3 May 2007 to elect members of Colchester Borough Council in Essex, England. One third of the council was up for election and the council stayed under no overall control.
The 2008 Colchester Borough Council election took place on 1 May 2008 to elect members of Colchester Borough Council in Essex, England. One third of the council was up for election and the Conservative party lost overall control of the council to no overall control.
The 2010 Colchester Borough Council election took place on 6 May 2010 to elect members of Colchester Borough Council in Essex, England. One third of the council was up for election and the council stayed under no overall control.
The 2011 Colchester Borough Council election took place on 5 May 2011 to elect members of Colchester Borough Council in Essex, England. One third of the council was up for election and the council stayed under no overall control.
The 2014 Colchester Borough Council election took place on 22 May 2014 to elect members of Colchester Borough Council in Essex, England. One third of the council was up for election and the council stayed under no overall control.
The 2012 St Helens Metropolitan Borough Council election took place on 3 May 2012 to elect members of St Helens Metropolitan Borough Council in Merseyside, England. One third of the council was up for election and the Labour party stayed in overall control of the council.
The 2015 Colchester Borough Council election took place on 7 May 2015 to elect one third of the members of Colchester Borough Council in England. This was the same day as other local elections and as the General Election. Colchester Borough Council is made up of 60 councillors: 20 councillors were up for election.
Elections to Colchester Borough Council took place on 5 May 2016. Colchester Borough Council normally elects one third of its councillors each year, however, due to boundary changes, the whole council is up for election.