Net electricity generation by energy source for 2023[1]
Natural gas (42.3%)
Nuclear (18.2%)
Coal (15.9%)
Wind (10.0%)
Hydro (5.60%)
Solar (5.60%)
Biomass (1.10%)
United States electricity production by type
The United States has the second largest electricity sector in the world, with 4,178 Terawatt-hours of generation in 2023.[2] In 2023 the industry earned $491b in revenue (1.8% of GDP) at an average price of $0.127/kWh.[3]
The U.S. electricity sector is regulated by different public institutions with some functional overlaps. The federal government sets general policies through the Department of Energy. Economic regulation of the distribution segment is a state responsibility, usually carried out through Public Utilities Commissions; the inter-state transmission segment is regulated by the federal government through the Federal Energy Regulatory Commission.
Electricity generation grew by about 5.5% between 2015 and 2024,[4] but with significant changes in composition over that time. In 2013 coal was 38.8% of generation, natural gas was 27.6%, nuclear was 19.4%, wind was 4.1%, hydro was 6.6%, and solar was 0.2%. Because of this shift, CO2 emissions have gone down by 30%.[5]
Current power plants map from the U.S. Energy Information Administration
In 2023, US generation scale installed electricity generation summer capacity[6] in the United States was 1161.43 gigawatts (GW), up 15.57 GW from 2021. The main energy sources for electricity generation include
Thermal/Fossil: 733.2 GW up 1.38 GW (+0.02%) from 2021
Wind: 141.4 GW up 8.65 GW ( +6.52%) from 2021
Nuclear: 94.66 GW down 0.89 GW (-0.93%) from 2021
Hydropower: 80.07 GW up 0.16 GW (0.2%) from 2021
Solar:143.8 GW up 11.43 GW (+18.41%) from 2021
Solar (small scale estimate):39.83 GW up 6.75 GW (+20.4%) from 2021
Actual USA utility scale electricity generation[7] in 2022 was 4230.723 terawatt-hours (TWh) and was up 134.883 TWh (3.29%) from 2021. The USA also imported 56.97 TWh and exported 15.758 TWh:[16] making a total of 4271.88 TWh for consumption, up 114.78 TWh (2.78%) from 2021.
Electricity generation was primarily from the following sources:
Thermal/Fossil: 2553.23 TWh, up 45.47 TWh (+1.8%) from 2021
Nuclear: 771.54 TWh, down 8.11 TWh ( -1.0%) from 2021
Wind:434.3 TWh, up 56.1 TWh ( +14.83%) from 2021
Hydropower: 254.70 TWh, up 2.6 TWh (+3.2%) from 2021
Solar: 143.8 TWh up 28.54 TWh (+24.76%) from 2021
Solar (small scale estimate): 61.28 TWh up 12.12 TWh (+24.6%) from 2021
The share of coal and nuclear in energy generation is much higher than their share in installed capacity, because coal and nuclear plants provide base load and thus are running longer hours than natural gas and petroleum plants which typically provide peak load, while wind turbines and solar plants produce electricity when they can and natural gas fills in as required to compensate.
State Contribution to US Net Electric Generation
State Net Generation by Fuel Source
States who IMPORT States who EXPORT
US electricity production by source
State Electric Energy Fuel Use%
10 yr chart of fuel mix for electric
Yearly electric energy generation by fuel source (TWh)[8][9][10]
Year
Fossil Fuel
Nuclear
Renewable
Misc
Total
Coal
Oil
Gas
sub total
Hydro
Geo thermal
Solar
Wind
Wood
Bio (other)
sub Total
2023*
675.12
16.23
1,817.84
2,509.19
774.87
245.00
16.37
165.53
421.14
31.62
15.59
895.25
22.87
4,202.18
Proportion 2023*
16.07%
0.39%
43.26%
59.71%
18.44%
5.83%
0.39%
3.94%
10.02%
0.75%
0.37%
21.30%
0.54%
100.0%
2022*
831.51
22.93
1,698.79
2,553.23
771.54
254.79
16.09
143.79
434.30
35.46
16.38
900.82
46.29
4,271.88
Proportion 2022*
19.46%
0.54%
39.77%
59.77%
18.06%
5.96%
0.38%
3.37%
10.17%
0.83%
0.38%
21.09%
1.08%
100.0%
2021*
898.0
19.17
1,590.56
2,507.76
779.65
251.59
15.98
115.26
378.2
36.46
17.79
815.27
46.34
4,149.01
2020
773.393
17.341
1,635.985
2,426.719
789.879
285.274
15.890
89.199
337.938
36.210
18.493
783.004
54.848
4,054.450
Proportion 2020
19.08%
0.43%
40.35%
59.85%
19.48%
7.04%
0.39%
2.20%
8.33%
0.89%
0.46%
19.56%
1.35%
100.0%
2019
964.957
18.341
1,598.405
2,581.703
809.409
287.874
15.473
71.937
295.882
38.543
18.964
728.673
47.114
4,166.900
2018
1,149.49
25.23
1,482.40
2,657.11
807.08
292.52
15.97
63.83
272.67
40.94
20.90
706.82
51.53
4,222.532
2017
1,205.84
21.39
1,308.89
2,536.12
804.95
300.33
15.93
53.29
254.30
41.15
21.61
686.61
62.90
4,090.58
2016
1,239.15
24.20
1,391.11
2,654.47
805.69
267.81
15.83
36.05
226.99
40.95
21.81
609.45
67.49
4,137.10
2015
1,352.40
28.25
1,346.60
2,727.25
797.18
249.08
15.92
24.89
190.72
41.93
21.70
544.24
75.61
4,144.27
Proportion 2015
32.63%
0.68%
32.49%
65.81%
19.24%
6.01%
0.38%
0.60%
4.6%
1.01%
0.52%
13.13%
1.82%
100.0%
2014
1,581.71
30.23
1,138.63
2,750.57
797.17
259.37
15.88
17.69
181.655
42.34
21.65
538.58
60.50
4,146.2
2013
1,581.12
27.16
1,137.69
2,745.97
789.02
268.57
15.78
9.04
167.84
40
20.83
522.07
55.64
4,112.7
2012
1,514.04
23.19
1,237.79
2,775.02
769.33
276.24
15.56
4.33
140.82
37.8
19.82
494.57
56.1
4,095
2011
1,733.4
30.2
1,025.3
2,788.9
790.2
319.4
15.3
1.82
120.2
37.4
19.2
513.32
46
4,138.4
2010
1,847.3
37.1
999.0
2,883.4
807.0
260.2
15.2
1.21
94.7
37.2
18.9
427.4
33.3
4,151.0
Proportion 2010
44.5%
0.9%
24.1%
69.5%
19.4%
6.3%
0.37%
0.029%
2.3%
0.9%
0.5%
10.3%
0.8%
100.0%
2009
1,755.9
38.9
931.6
2,726.5
798.9
273.4
15.0
0.89
73.9
36.1
18.4
417.7
41.4
3,984.4
2008
1,985.8
46.2
894.7
2,926.7
806.2
254.8
14.8
0.86
55.4
37.3
17.7
380.9
38.3
4,152.2
2007
2,016.5
65.7
910.0
2,992.2
806.4
247.5
14.6
0.61
34.5
39.0
16.5
352.7
36.6
4,188.0
2000
1,966
111
615
2,692
754
260
14
0.49
5.6
37.6
23
318.7
38.6
3,836
Proportion 2000
51.3%
2.9%
16.0%
70.2%
19.7%
7.2%
0.37%
0.013%
0.15%
1.0%
0.6%
9.3%
0.9%
100.0%
1999
1,881
118
571
2,570
728
319.5
14.8
0.50
4.5
37
22.6
392.8
55
3,723.8
Gas includes natural gas and other gases.
Solar includes photovoltaics and thermal, excludes small scale photovoltaics.
Misc includes misc generation, pumped storage, and net imports.
Bio Other includes waste, landfill gas, and other.
Hydro excludes pumped storage (not an energy source, used by all sources, other than hydro).
Total includes net imports.
2021 and 2022 data is from Electric Power Annual 2022
The following tables summarize the electrical energy generated by fuel source for the United States. Electric Power Annual[11] for 2022 data.
Electricity generation in the United States in 2022[12][13]
Fossil fuels—mainly coal and natural gas—remain the backbone of electricity generation in the U.S., accounting for 68% of installed generation capacity in 2010 and 63.1% in 2022. Coal production has fallen significantly since 2007 with most of the losses being replaced by natural gas, but also a growing fraction of non-hydroelectric renewables.
NATURAL GAS+ Generated Electronic Energy 2022–2021
COAL Generated Electric Energy Profile 2022–2021
PETROLEUM Generated Electric Energy Profile 2022–2021
10 yr Fossil Fuel Generated Electric Energy Profile 2022–2012
In 2007 the Department of Energy estimated the planned additional capacity for 2008–12 at 92GW, most of which to be fueled by natural gas (48GW) and coal (19GW).[14]
10 Yr Nuclear Generated Electric Energy Profile 2022-2012NUCLEAR Generated Electric Energy Profile 2022-2021
As of 2007 in the United States, there are 104 commercial nuclear reactors in the US, generating approximately 20% of the nation's total electric energy consumption. For many years, no new nuclear plants have been built in the US. However, since 2005 there has been a renewed interest in nuclear power in the US. This has been facilitated in part by the federal government with the Nuclear Power 2010 Program of 2002.[15] and the Energy Policy Act.[16][17] As of March 9, 2009, the U.S. Nuclear Regulatory Commission had received applications for permission to construct 26 new nuclear power reactors[18] However, as of 2013 most of the new applications had been abandoned due to the low cost of electricity generated with natural gas which had become available at cheap prices due to the boom in hydraulic fracturing; electricity produced using natural gas being 4 cents per kilowatt-hour versus 10 cents, or more, for nuclear.[19]
The following table summarizes the electrical energy generated by renewable fuel sources for the US. Data was obtained from Electric Power Annual 2022.[20]
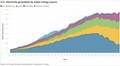
Growth in renewable-source electricity generation has been led by wind and solar while hydropower has remained flat
Note: Biomass includes wood and wood derived fuel, landfill gas, biogenic municipal solid waste and other waste biomass.
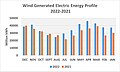
Wind Generated Electric Energy Profile 2022–2021
HYDRO Generated Electric Energy Profile 2022–2021
Solar (Utility) Generated Electric Energy Profile 2022–2021
Wood Generated Electric Energy Profile 2022–2021
Other Biomass Generated Electric Energy Profile 2022–2021
Geothermal Generated Electric Energy Profile 2022–2021
Renewables Electric Energy Generation Profile
Timeline of electricity from renewable sources in the United States
The development of renewable energy and energy efficiency marks "a new era of energy exploration" in the United States, according to President Barack Obama.[23] In a joint address to the Congress on February 24, 2009, President Obama called for doubling renewable energy within the next three years.[24] From the end of 2008 to the end of 2011 renewable energy increased by 35% and from the end of 2008 till the end of 2014, 41.4%. In reality it took twelve years instead of three to double as 2020 saw a 100% increase from 2008.
Renewable energy accounted for more than 22.4% percent of the domestically produced electric energy used in the United States in 2022, up from 12.2% in 2012. All renewables have increased by 1.92X in the last decade. Wind production in 2022 was 10.17% of all production and has grown 2.9X over the last decade. Over this same time period solar( including small scale) has increased by 13.1X and now provides 3.37% of US electric energy needs. Utility scale solar has grown 11.1X over the last decade and in the last eight years of estimating small scale solar it has grown by 5.4X.
According to a report by the Interior Department, U.S. wind power– including off-shore turbines– could more than meet U.S. electricity needs.[25] The Department of Energy has said wind power could generate 20% of US electricity by 2030.[26][27][28]
Several solar thermal power stations, including the new 64MW Nevada Solar One, have also been built. The largest of these solar thermal power stations is the SEGS group of plants in the Mojave Desert with a total generating capacity of 354 MW, making the system the largest solar plant of any kind in the world.[29]
Electricity consumption
Electricity consumption data in this section is based upon data mined from US DOE Energy Information Administration/Electric Power Annual 2022 files[30] In 2022 the total US consumption of electricity was 4,271.88 terawatt-hours (TWh). Consumption was up from 2021, by 122.87TWh or +2.96%. This is broken down as:
Residential customers (139.894 million) directly consumed 1,509.23TWh, or 35.23% of the total. This was up 38.74TWh (+2.6%) from 2021. An average residential customer used 899kWh/month and with the average US residential cost of $0.1504/kWh the average monthly electrical bill would be $135.27, up $14.25 (+11.77% from 2021.[30]
Commercial customers (19.258 million) directly consumed 1,390.87TWh or 32.56% of the total. This was more (62.43TWh) than in 2021 with over 155 thousand new customers. An average commercial customer used 6,019kWh/month and with the average US commercial electric cost of $0.1241/kWh the average monthly electrical bill would be $746.96 up $96.76 (+14.9%) from 2021 .[30] Demand from data centers (4% of total in 2022) and artificial intelligence trainers, new/expanded clean-tech factories, and crypto-mining became a significant component of overall demand in the 2020s. Affected states include Georgia, Texas, Virginia, Arizona, Oregon, Maryland, Kansas, Nebraska, Wisconsin, and South Carolina.[31] Some large consumers are building their own energy production facilities independent of the grid.
Industrial customers (1,049.983 thousand up 27.8 thousand from 2021) directly consumed 1020.486TWh or 23.89% of the total. This was a more (19.85TWh) than in 2021 (+2%).
Transportation customers (86) directly consumed 6.599TWh or 0.15% of the total. This was a little higher by 0.265 TWh(+4.1%) than in 2021TWh) .
System loss throughout the total electrical grid infrastructure by direct use of the suppliers (139.726TWh)[32] and for transmission and other system losses and for unaccounted for loads (204.989TWh) amounts to 344.719TWh or 8.07% of the total which is down by 0.2% from 2021. Thus, the US electric distribution system is 91.93% efficient and efficiency has improved slightly over the last year.[33]
In addition from consumption from the electrical grid, the US consumers consumed an estimated additional 61.282 (up 12.12 TWh from 2021)TWh from small scale solar systems.
US Electric Energy Consumption by User Community 2013–2022
US Electric Energy Profile 2022–2021
US Electric Customers 2012–2022
US Residential Customers 2022
kWh Electric Costs (Cents/kWh) by State
Average Residential Electric Energy Consumption by State 2022
State Average Residential Electricity Cost in 2022
10 Yr Average Residential kWh costs by Region
10 Yr Average Residential kWh costs for Several States
Consumption per person
US per Capita Consumption kWh/yr
Electricity consumption per person (per capita) is based upon data mined from US DOE Energy Information Administration/Electric Power Annual 2022 files[34] Population[35] data is from Demographics of the United States. Per capita consumption in 2022 is 12,809 kWh. This is up 351kWh from 2021 and down 1.8% from a decade ago and down 7.2% from its peak in 2007. The following table shows the yearly US per capita consumption by fuel source from 1999 to 2022.
The following table used the first column from the Demographics of the United States#Vital statistics table for population, and generation from Electric Power Annual. Technically this means that "consumption" includes transmission losses, etc., because the values in the table were all calculated from table ES1. Summary Statistics for the United States. Also since 2016 the small scale solar estimate is included in the solar contribution.
Yearly US Per Capita Consumption (kWh) by Fuel Source 1999–2022
Year
Population million
Fossil Fuel
Nuclear
Renewable
Misc
Total
Coal
Oil
Gas
Subtotal
Hydro
Geo
Solar
Wind
Wood
Other Bio
Subtotal
2022
338.290
2,458
68
5,022
7,547
2,281
753
48
606
1284
105
48
2,663
137
12,809
2021
336.998
2,665
57
4,720
7,442
2,314
747
47
488
1122
108
53
2,419
138
12,458
2020
331.449
2,333
52
4,936
7,322
2,383
861
48
352
1020
109
56
2,362
165
12,316
2019
328.240
2,943
57
4,861
7,861
2,466
834
49
327
914
121
57
2,302
143
12,772
2018
326.980
3,515
77
4,534
8,126
2,468
895
49
285
834
125
64
2,162
158
13,004
2017
325.719
3,702
66
4,018
7,786
2,471
922
49
237
781
126
66
2,108
193
12,632
2016
323.128
3,835
75
4,305
8,215
2,493
829
49
170
702
127
68
1,886
209
12,861
2015
320.897
4,215
88
4,196
8,499
2,484
776
50
78
594
131
68
1,696
236
12,915
2014
318.857
4,961
95
3,571
8,626
2,500
813
50
55
570
133
68
1,689
190
13,005
2013
316.129
5,001
86
3,599
8,686
2,496
850
50
29
531
127
66
1,651
176
13,010
2012
313.874
4,824
74
3,944
8,841
2,451
880
50
14
449
120
63
1,576
179
13,047
2011
313.85
5,523
96
3,267
8,886
2,518
1,018
49
6
383
119
61
1,636
147
13,187
2010
309.33
5,972
120
3,230
9,321
2,609
841
49
3.9
306
120
61
1,382
108
13,419
2009
307.01
5,719
127
3,034
8,881
2,602
891
49
2.9
241
117
60
1,361
135
12,978
2008
304.38
6,524
152
2,939
9,616
2,649
837
49
2.8
182
123
58
1,252
126
13,642
2007
301.58
6,686
218
3,018
9,922
2,674
821
49
2.0
114
129
55
1,170
121
13,887
2006
298.59
6,666
215
2,782
9,663
2,636
969
49
1.7
89
130
54
1,292
83
13,675
2005
295.75
6,806
413
2,618
9,838
2,644
914
50
1.9
60
131
52
1,209
105
13,796
2004
293.05
6,751
413
2,475
9,639
2,691
916
51
2.0
48
130
53
1,199
58
13,588
2003
290.33
6,798
411
2,292
9,502
2,631
950
50
1.8
39
129
54
1,224
41
13,397
2002
287.80
6,717
329
2,441
9,486
2,710
918
50
1.9
36
134
52
1,193
90
13,479
2001
285.08
6,679
438
2,274
9,390
2,697
761
48
1.9
24
123
51
1,009
88
13,185
2000
282.17
6,968
394
2,179
9,542
2,672
977
50
1.7
20
133
82
1,263
117
13,594
1999
279.04
6,741
423
2,045
9,209
2,610
1,145
53
1.8
16
133
81
1,430
96
13,345
Gas includes natural gas and other gases.
Solar includes photovoltaics and thermal and includes small scale solar.
Misc includes misc generation, pumped storage, and net imports.
Bio Other includes waste, landfill gas, and other.
Hydro excludes pumped storage (not an energy source, used by all sources, other than hydro).
Total includes net imports and calculated small scale solar (since 2016)
Grid storage
Solar farms and battery farms in the United States
USA has 21.9 GW of pumped-storage hydroelectricity[36] and 6.6 GW of grid batteries as of 2022.[37] They are around 80% efficient (20% loss), so they are net consumers of electricity. Pumped storage generated around 1 TWh/month in winter, and around 2.5 TWh/month in summer as of 2021.[36]
Responsibilities in the electricity sector
The fragility and reliability of the electrical grid is a major public policy concern. This 2019 assessment reiterates concerns "that a prolonged collapse of this nation's electrical grid—through starvation, disease, and societal collapse—could result in the death of up to 90% of the American population".
Policy for the electricity sector in the United States is set by the executive and legislative bodies of the federal government and state governments. Within the executive branch of the federal government the Department of Energy plays a key role. In addition, the Environmental Protection Agency is in charge of environmental regulation and the Federal Trade Commission is in charge of consumer protection and the prevention of anti-competitive practices.
Key federal legislation related to the electricity sector includes:
the Federal Power Act of 1935 that promoted hydropower and increased the role of the federal government in the sector,
the National Energy Act of 1978, including the Public Utility Regulatory Policies Act (PURPA), which required utilities to provide residential consumers with energy conservation audits and other services to encourage slower growth of electricity demand, and was intended to promote renewable energy with the result of promoting mainly co-generation;
the Energy Policy Act of 1992 which provided further incentives for energy efficiency and removed obstacles to wholesale competition; and
Many state governments have been active in promoting renewable energy. For example, in 2007 25 states and the District of Columbia had established renewable portfolio standards (RPS).[38] There is no federal policy on RPS.
The Federal Energy Regulatory Commission is in charge of regulating interstate electricity sales, wholesale electric rates, and licensing hydropower plants. Rates for electricity distribution are regulated by state-level Public Utilities Commissions or Public Services Commissions.
Deregulation and competition
Deregulation of the electricity sector consists in the introduction of competition and the unbundling of vertically integrated utilities in separate entities in charge of electricity generation, electricity transmission, electricity distribution and commercialization. The deregulation of the electricity sector in the U.S. began with the Energy Policy Act of 1992 which removed obstacles for wholesale competition. In practice, however, regulation has been unevenly introduced between states. It began in earnest only from 1996 onwards when the Federal Energy Regulatory Commission issued orders that required utilities to provide transmission services "on a reasonable and non-discriminatory basis". In some states, such as in California, private utilities were required to sell some of their power plants to prevent concentration of market power.[39]
As of April 2014, 16 U.S. states – Connecticut, Delaware, Illinois, Maine, Maryland, Massachusetts, Michigan, Montana, New Hampshire, New Jersey, New York, Ohio, Oregon, Pennsylvania, Rhode Island, and Texas – and the District of Columbia have deregulated their electricity markets in some capacity. Additionally, seven states – Arizona, Arkansas, California, Nevada, New Mexico, Virginia, and Wyoming – started electricity deregulation in some capacity but have since suspended deregulation.[40] The deregulation of the Texas electricity market in 2002 is one of the better-known examples. The result has been that the different states with in United States have a wide spectrum of different levels of deregulation. Some states only allow large commercial customers to choose a different supplier, some allow all consumers to choose. Contrary to the largely similar methods of deregulation for natural gas, different states have taken very different approaches to electricity deregulation.[41]
Service provision
Electric utilities in the U.S. can be both in charge of electricity generation and electricity distribution. The electricity transmission network is not owned by individual utilities, but by companies and organizations that are obliged to provide indiscriminate access to various suppliers to promote competition. In 1996, there were 3,195 electric utilities in the United States and 65 power marketers. Of these, 2,020 were publicly owned (including 10 Federal utilities), 932 were rural electric cooperatives, and 243 were investor-owned utilities. Fewer than 1,000 utilities are engaged in power generation.[42]
There are two major wide area synchronous grids in North America, the Eastern Interconnection and the Western Interconnection. Besides this there are two minor power grids in the U.S., the Alaska Interconnection and the Texas Interconnection. The Eastern, Western and Texas Interconnections are tied together at various points with DC interconnects allowing electrical power to be transmitted throughout the contiguous U.S., parts of Canada and parts of Mexico. The transmission grids are operated by transmission system operators (TSOs), not-for profit companies that are typically owned by the utilities in their respective service area, where they coordinate, control and monitor the operation of the electrical power system. TSOs are obliged to provide non-discriminatory transmission access to electricity generators and customers. TSOs can be of two types: Independent System Operators (ISOs) and Regional Transmission Organizations (RTOs). The former operates within a single state and the latter covers wider areas crossing state borders.[citation needed]
The three major and two minor NERC Interconnections, and the nine NERC Regional Reliability Councils.
RTOs are similar, but not identical to the nine Regional Reliability Councils associated in the North American Electric Reliability Corporation (NERC), a non-profit entity that is in charge of improving the reliability and security of the bulk power system in the U.S., Canada and the northern part of Baja California in Mexico. The members of the Regional Reliability Councils include private, public and cooperative utilities, power marketers and final customers. The Regional Reliability Councils are:
About 75% of electricity sales to final customers are undertaken by private utilities, with the remainder being sold by municipal utilities and cooperatives.
Sources of costs for US electric distribution systems
Tariffs and affordability
Average price of electricity in the United StatesElectricity prices by sector
In 2008 the average electricity tariff in the U.S. was 9.82¢/kWh, up from 6.9¢/kWh in 1995. Residential tariffs were somewhat higher at 11.36¢/kWh, while commercial tariffs stood at 10.28¢/kWh and industrial tariffs at 7.01¢/kWh.[44] The cost of supplying high-voltage power to high-volume industrial customers is lower than the cost of providing low-voltage (120V) power to residential and commercial customers.
In 2006–07 commercial electricity tariffs in the U.S. (9.28¢/kWh) were higher than in Australia (7.1¢/kWh), Canada (6.18¢/kWh) that relies mainly on hydropower or in France (8.54¢/kWh) that relies heavily on nuclear power, but lower than in Germany (13.16¢/kWh), Italy (15.74¢/kWh) or the UK (11.16¢/kWh) that all rely to a larger degree on fossil fuels, all compared at purchasing power parity.[45]
Residential tariffs vary significantly between states from 6.7¢/kWh in West Virginia to 24.1¢/kWh in Hawaii. An important factor that influences tariff levels is the mix of energy sources used in power generation. For example, access to cheap federal power from hydropower plants contributes to low electricity tariffs in some states.
Average residential electricity consumption in the U.S. was 936kWh/month per in 2007, and the average bill was US$100/month. Average residential consumption varies considerably between states from 530kWh/month in Maine to 1,344kWh/month in Tennessee. Factors that influence residential energy consumption are climate, tariffs and efforts to promote energy conservation.
Revenues
Total revenue from the sale of electricity in 2008 was US$344bn, including US$148bn from residential customers, US$129bn from commercial customers and US$66bn from industrial customers.[46] Many large industries self-generate electricity and their electricity consumption thus is not included in these figures.
Investment
This section is empty. You can help by adding to it. (January 2011)
Financing
Most investments in the U.S. electricity sector are financed by private companies through debt and equity. However, some investments are indirectly financed by taxpayers through various subsidies.
Subsidies and tax incentives
There is a large array of subsidies in the U.S. electricity sector ranging from various forms of tax incentives to subsidies for research and development, feed-in tariffs for renewable energy and support to low-income households to pay their electric bills. Some subsidies are available throughout the U.S., while others are only available in some states.
Tax incentives include federal and state tax deductions and tax breaks. Tax incentives can be directed at consumers, such as for the purchase of energy-efficient appliances or for solar energy systems, small wind systems, geothermal heat pumps, and residential fuel cell and microturbine systems.[47] Tax incentives can also be directed at electricity producers, in particular for renewable energy.
The Low Income Home Energy Assistance Program (LIHEAP) received federal funding of $5.1billion in Fiscal Year 2009.[48] It is funded mainly by the federal government through the U.S. Department of Health and Human Services, Administration for Children and Families, and is administered by states and territories. While some of its funding is for fuel for heating, some is also used to cover electricity bills for both heating and cooling.
In April 2009, 11 U.S. state legislatures were considering adopting feed-in tariffs as a complement to their renewable electricity mandates.[49]
↑Timothy J. Brennan, Karen L. Palmer, Salvador A. Martinez:Alternating Currents.Electricity Markets and Public Policy, Resources for the Future, Washington D.C., 2002, p. 26-32
This page is based on this Wikipedia article Text is available under the CC BY-SA 4.0 license; additional terms may apply. Images, videos and audio are available under their respective licenses.

 Natural gas (42.3%)
 Nuclear (18.2%)
 Coal (15.9%)