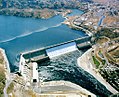
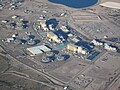
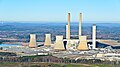
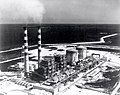
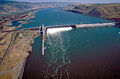
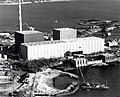
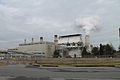
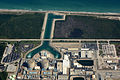
List of largest power stations in the United States

Last updated

Map of all utility-scale power plants Power plants map.png
Map of all utility-scale power plants

This article lists the largest electricity generating stations in the United States in terms of installed electrical capacity. Non-renewable power stations are those that run on coal, fuel oils, nuclear, natural gas, oil shale, and peat, while renewable power stations run on fuel sources such as biomass, geothermal heat, hydro, solar energy, solar heat, tides, waves, and the wind.

Contents

Two related terms are used to describe electricity production:

The power generating facility with the largest power capacity (potential power production) is the Grand Coulee Dam in Washington. [2] The facility generates power by utilizing 27 Francis turbines and 6 pump-generators, with a total installed capacity of 7,079 MW. However, Grand Coulee Dam does not have the largest annual net generation due to a relatively low capacity factor.

The power generating facility with the largest annual net generation (actual electricity put out to the power grid) is Palo Verde in Arizona with 31,629,862 MWh in 2021. [3] The second and third largest were Browns Ferry and Peach Bottom with 31,053,552 MWh and 22,268,244 MWh, respectively. All three of these are nuclear power plants, and eight of the top 10 power plants with the largest annual net generation in 2021 are nuclear power plants. [4]

The largest power generating facility under construction is the Chokecherry and Sierra Madre Wind Energy Project in Wyoming, which will generate 2,500-3,000 MW when completed in 2026. [5]

Largest power stations

List of the electrical generating facilities in the United States with an installed capacity of at least 1,500 MW.

RankNameImageState Location Capacity
(MW)
Annual Generation
(GWh)
Capacity
Factor
TypeOwnerRef
1 Grand Coulee Grand Coulee Dam.jpg Flag of Washington.svg  Washington 47°57′21″N118°58′54″W / 47.95583°N 118.98167°W / 47.95583; -118.98167 (Grand Coulee Dam) 6,80921,043 (2018)35.28% Hydro U.S. Bureau of Reclamation [6] [7]
2 Palo Verde PaloVerdeNuclearGeneratingStation.jpg Flag of Arizona.svg  Arizona 33°23′21″N112°51′54″W / 33.38917°N 112.86500°W / 33.38917; -112.86500 (Palo Verde) 3,94231,097 (2018)90.05% Nuclear (PWR) Arizona Public Service (29.1%)
Salt River Project (17.5%)
Others (53.4%)
[8]
3 Browns Ferry Browns ferry NPP.jpg Flag of Alabama.svg  Alabama 34°42′14″N87°7′7″W / 34.70389°N 87.11861°W / 34.70389; -87.11861 (Browns Ferry Nuclear) 3,77525,398 (2018)87.94% Nuclear (BWR) Tennessee Valley Authority [9]
4 West County Flag of Florida.svg  Florida 26°42′0″N80°22′30″W / 26.70000°N 80.37500°W / 26.70000; -80.37500 (West County Energy Center) 3,75019,841 (2018)60.40% Natural gas FPL [10] [11]
5 W. A. Parish WA Parish Generating Station.jpg Flag of Texas.svg  Texas 29°28′34″N95°38′0″W / 29.47611°N 95.63333°W / 29.47611; -95.63333 (W. A. Parish) 3,65315,851 (2018)49.53% Coal (73.8%)
Natural gas (26.2%)
NRG Energy [12]
6 Robert W. Scherer Schererplant.jpg Flag of Georgia (U.S. state).svg  Georgia 33°03′45″N83°48′14″W / 33.06259°N 83.80388°W / 33.06259; -83.80388 (Robert W. Scherer) 3,52015,420 (2018)50.01% Coal Oglethorpe Power (30%)
Georgia Power (22.95%)
Others (47.05%)
[13]
7 Bowen Plant Bowen.jpg Flag of Georgia (U.S. state).svg  Georgia 34°07′23″N84°55′13″W / 34.12306°N 84.92028°W / 34.12306; -84.92028 (Bowen) 3,49913,620 (2018)44.44% Coal Georgia Power [14]
8 Alvin W. Vogtle [note 1] Vogtle NPP.jpg Flag of Georgia (U.S. state).svg  Georgia 33°8′36″N81°45′38″W / 33.14333°N 81.76056°W / 33.14333; -81.76056 (Vogtle) 3,41919,959 (2018)98.98% Nuclear (PWR) Georgia Power (45%)
Oglethorpe Power (30%)
Others (25%)
[15]
9 Monroe Detroit Edison Monroe Power Plant.jpg Flag of Michigan.svg  Michigan 41°53′21″N83°20′44″W / 41.88917°N 83.34556°W / 41.88917; -83.34556 (Monroe) 3,40016,458 (2018)55.26% Coal DTE Electric [16]
10 Gibson Gibson Generating Station - 2016 1.jpg Flag of Indiana.svg  Indiana 38°22′19″N87°46′02″W / 38.37194°N 87.76722°W / 38.37194; -87.76722 (Gibson) 3,13217,632 (2018)60.17% Coal Duke Energy (90.3%)
IMPA (4.87%)
WVPA (4.87%)
[17]
11 Bath County Flag of Virginia.svg  Virginia 38°13′50″N79°49′10″W / 38.23056°N 79.81944°W / 38.23056; -79.81944 (Bath County Pumped Storage) 3,003-983 (2018)-3.74% Hydro (Pumped-storage) Dominion Energy (60%)
Bath County Energy (24%)
Allegheny Energy (16%)
[18] [19]
12 Turkey Point HD.6B.312 (11842466925).jpg Flag of Florida.svg  Florida 25°26′3″N80°19′50″W / 25.43417°N 80.33056°W / 25.43417; -80.33056 (Turkey Point) 2,97919,812 (2018)75.92% Nuclear (PWR)(59%)
Natural gas or Fuel oil (41%)
FPL [10] [20]
13 Manatee Flag of Florida.svg  Florida 27°36′19″N82°20′47″W / 27.60528°N 82.34639°W / 27.60528; -82.34639 (Manatee) 2,9518,383 (2016)32.43% Natural gas FPL [10] [21]
14 John E. Amos Coal Field And Conveyer Belt at John Amos .jpg Flag of West Virginia.svg  West Virginia 38°28′29″N81°49′16″W / 38.47472°N 81.82111°W / 38.47472; -81.82111 (John E. Amos) 2,93312,985 (2018)50.54% Coal American Electric Power [22]
15 South Texas Project South Texas Nuclear Generating Station.jpg Flag of Texas.svg  Texas 28°47′44″N96°2′56″W / 28.79556°N 96.04889°W / 28.79556; -96.04889 (South Texas Nuclear) 2,76020,688 (2018)85.57% Nuclear (PWR) NRG Energy (44%)
City of San Antonio (40%)
City of Austin (16%)
[23]
16 Fort Myers Flag of Florida.svg  Florida 26°41′48″N81°46′57″W / 26.6967°N 81.7825°W / 26.6967; -81.7825 (Fort Myers) 2,6819,287 (2018)39.54% Natural gas (98%)
Fuel oil (2%)
FPL [10] [24]
17 Robert Moses Niagara Robert moses niagara power plant 01.jpg Flag of New York.svg  New York 43°08′35″N79°02′23″W / 43.14306°N 79.03972°W / 43.14306; -79.03972 (Robert Moses Niagara) 2,67516,773 (2018)71.58% Hydro (Reservoir) New York Power Authority [25]
18 James H. Miller Jr. AERIAL OVERVIEW - Miller Electric Generating Plant, Warrior River, Birmingham, Jefferson County, AL HAER ALA,37-BIRM.V,10-1.tif Flag of Alabama.svg  Alabama 33°37′55″N87°03′38″W / 33.63194°N 87.06056°W / 33.63194; -87.06056 (James H. Miller Jr.) 2,64018,325 (2018)79.24% Coal Alabama Power [26]
19 Peach Bottom Peach Bottom Nuclear Generating Station 1974 cropped.jpg Flag of Pennsylvania.svg  Pennsylvania 39°45′30″N76°16′5″W / 39.75833°N 76.26806°W / 39.75833; -76.26806 (Peach Bottom Nuclear) 2,61721,680 (2018)94.57% Nuclear (BWR) Exelon (75%)
PSEG (25%)
[27]
20 General James M. Gavin Gavin Power Plant.jpg Flag of Ohio.svg  Ohio 38°56′09″N82°07′00″W / 38.93583°N 82.11667°W / 38.93583; -82.11667 (Gavin) 2,60016,006 (2018)70.28% Coal Lightstone Generation [28]
21 Rockport [note 2] Rockport Generating Station.jpg Flag of Indiana.svg  Indiana 37°55′32″N87°02′02″W / 37.92556°N 87.03389°W / 37.92556; -87.03389 (Rockport) 2,60011,894 (2018)52.22% Coal American Electric Power [29]
22 Oconee HD.6B.349 (11856013654).jpg Flag of South Carolina.svg  South Carolina 34°47′38″N82°53′53″W / 34.79389°N 82.89806°W / 34.79389; -82.89806 (Oconee Nuclear) 2,55421,294 (2018)95.18% Nuclear (PWR) Duke Energy [30]
23 Susquehanna Susquehanna Steam Electric Station from Council Cup 1.JPG Flag of Pennsylvania.svg  Pennsylvania 41°5′20″N76°8′56″W / 41.08889°N 76.14889°W / 41.08889; -76.14889 (Susquehanna Nuclear) 2,51420,469 (2018)92.95% Nuclear (BWR) Talen Energy (90%)
AEC (10%)
[31]
24 Braidwood Braidwood nuclear power station.png Flag of Illinois.svg  Illinois 41°14′37″N88°13′45″W / 41.24361°N 88.22917°W / 41.24361; -88.22917 (Braidwood Nuclear) 2,50019,343 (2018)88.32% Nuclear (PWR) Exelon [32]
25 Ravenswood Ravenswood Generating Station (41875).jpg Flag of New York.svg  New York 40°45′35″N73°56′45″W / 40.75972°N 73.94583°W / 40.75972; -73.94583 (Ravenswood) 2,4803,338 (2018)15.36% Fuel oil or Natural gas IHI Power Services [33]
26 Cumberland Cumberland Power Plant smokestacks.jpg Flag of Tennessee.svg  Tennessee 36°23′29″N87°39′17″W / 36.39139°N 87.65472°W / 36.39139; -87.65472 (Cumberland) 2,47010,441 (2018)48.25% Coal Tennessee Valley Authority [34]
27 Byron 2009-0913-ByronNuclear.jpg Flag of Illinois.svg  Illinois 42°4′27″N89°16′55″W / 42.07417°N 89.28194°W / 42.07417; -89.28194 (Byron Nuclear) 2,45220,118 (2019)93.35% Nuclear (PWR) Exelon [35]
28 Sequoyah Sequoyah Nuclear Generating Station.jpg Flag of Tennessee.svg  Tennessee 35°13′35″N85°5′30″W / 35.22639°N 85.09167°W / 35.22639; -85.09167 (Sequoyah) 2,44017,704 (2018)82.83% Nuclear (PWR) Tennessee Valley Authority [36]
29 Union Flag of Arkansas.svg  Arkansas 33°17′52″N92°35′18″W / 33.29778°N 92.58833°W / 33.29778; -92.58833 (Union) 2,42810,305 (2018)59.41% Natural gas Entergy [37] [38] [39]
30 Comanche Peak Comanche Peak Nuclear Power Plant August 2017 (cropped).jpg Flag of Texas.svg  Texas 32°17′54″N97°47′6″W / 32.29833°N 97.78500°W / 32.29833; -97.78500 (Comanche Peak) 2,42520,498 (2018)96.49% Nuclear (PWR) Luminant [40]
31 Roxboro Flag of North Carolina.svg  North Carolina 36°28′44″N79°04′15″W / 36.47883°N 79.07089°W / 36.47883; -79.07089 (Roxboro) 2,4225,928 (2018)27.94% Coal Duke Energy [41]
32 Chalk Point Chalk Point Generating Station.jpg Flag of Maryland.svg  Maryland 38°32′37″N76°41′19″W / 38.54361°N 76.68861°W / 38.54361; -76.68861 (Chalk Point) 2,413]] [note 3] 1,455 (2018)6.88% Fuel oil or Natural gas (69.8%)
Coal (30.2%)
NRG Energy [42] [43]
33 Cross Flag of South Carolina.svg  South Carolina 33°22′9″N80°6′51″W / 33.36917°N 80.11417°W / 33.36917; -80.11417 (Cross) 2,3909,545 (2018)45.59% Coal Santee Cooper [44]
34 Sanford Flag of Florida.svg  Florida 28°50′34″N81°19′34″W / 28.84278°N 81.32611°W / 28.84278; -81.32611 (Sanford) 2,3789,968 (2018)47.85% Natural gas FPL [10] [45]
35 Labadie Flag of Missouri.svg  Missouri 38°33′44″N90°50′16″W / 38.56222°N 90.83778°W / 38.56222; -90.83778 (Labadie) 2,37215,766 (2018)75.88% Coal Ameren [46] [47]
36 Catawba Catawba Nuclear Station-2.jpg Flag of South Carolina.svg  South Carolina 35°3′N81°4′W / 35.050°N 81.067°W / 35.050; -81.067 (Catawba) 2,37018,780 (2018)90.46% Nuclear (PWR) Duke Energy [48]
37 Watts Bar Watts Bar-6.jpg Flag of Tennessee.svg  Tennessee 35°36′10″N84°47′22″W / 35.60278°N 84.78944°W / 35.60278; -84.78944 (Watts Bar) 2,33218,473 (2018)90.43% Nuclear (PWR) Tennessee Valley Authority [49]
38 Salem Hope Creek-Salem Nuclear.jpg Flag of New Jersey.svg  New Jersey 39°27′46″N75°32′8″W / 39.46278°N 75.53556°W / 39.46278; -75.53556 (Salem) 2,32718,895 (2018)92.69% Nuclear (PWR) PSEG (57%)
Exelon (43%)
[50]
39 McGuire McGuire Nuclear Station from lake Norman.jpg Flag of North Carolina.svg  North Carolina 35°25′57″N80°56′54″W / 35.43250°N 80.94833°W / 35.43250; -80.94833 (McGuire Nuclear) 2,31619,862 (2018)97.90% Nuclear (PWR) Duke Energy [51]
40 LaSalle County LaSalle County Nuclear Generating Station, Near Ottawa, Illinois (7981646921).jpg Flag of Illinois.svg  Illinois 41°14′44″N88°40′9″W / 41.24556°N 88.66917°W / 41.24556; -88.66917 (LaSalle County) 2,27719,346 (2018)96.99% Nuclear (BWR) Exelon [52]
41 Limerick LimerickPowerPlant.JPG Flag of Pennsylvania.svg  Pennsylvania 40°13′36″N75°35′14″W / 40.22667°N 75.58722°W / 40.22667; -75.58722 (Limerick Nuclear) 2,26819,339 (2018)97.34% Nuclear (BWR) Constellation [53]
42 Diablo Canyon [note 4] Diablo Canyon Nuclear Power Plant.jpg Flag of California.svg  California 35°12′39″N120°51′22″W / 35.21083°N 120.85611°W / 35.21083; -120.85611 (Diablo Canyon Nuclear) 2,25618,214 (2018)92.16% Nuclear (PWR) Pacific Gas and Electric [54]
43 Martin Lake Martin Lake Power Plant Tatum Texas 2019.jpg Flag of Texas.svg  Texas 32°15′42″N94°33′53″W / 32.26167°N 94.56472°W / 32.26167; -94.56472 (Martin Lake) 2,25014,050 (2018)71.28% Coal Luminant [55]
44 Belews Creek Belews Creek Steam Station.jpg Flag of North Carolina.svg  North Carolina 36°16′53″N80°3′37″W / 36.28139°N 80.06028°W / 36.28139; -80.06028 (Belews Creek) 2,2408,021 (2018)40.88% Coal Duke Energy [56]
45 Sherburne County Sherburne County Generating Station (Sherco), Becker, Minnesota.jpg Flag of Minnesota.svg  Minnesota 45°22′43″N93°53′48″W / 45.3787°N 93.8966°W / 45.3787; -93.8966 (Sherburne County) 2,23812,478 (2018)63.65% Coal NSP [57]
46 Martin Flag of Florida.svg  Florida 27°03′11″N80°33′00″W / 27.053°N 80.550°W / 27.053; -80.550 (Martin) 2,22512,882 (2018)66.09% Natural gas (96.6%)
Solar (3.4%)
FPL [58] [59]
47 W. H. Sammis [note 5] W. H. Sammis Power Plant.jpg Flag of Ohio.svg  Ohio 40°31′48″N80°37′51″W / 40.53000°N 80.63083°W / 40.53000; -80.63083 (W. H. Sammis) 2,2204,767 (2018)24.51% Coal FirstEnergy [60]
48 Donald C. Cook Cook nuclear exterior.jpg Flag of Michigan.svg  Michigan 41°58′32″N86°33′55″W / 41.97556°N 86.56528°W / 41.97556; -86.56528 (Donald C. Cook) 2,21317,611 (2018)90.84% Nuclear (PWR) American Electric Power [61]
49 Gila River Gila River Power Station.jpg Flag of Arizona.svg  Arizona 32°58′36″N112°41′39″W / 32.97667°N 112.69417°W / 32.97667; -112.69417 (Gila River) 2,2006,192 (2018)32.13% Natural gas Salt River Project (75%)
Tucson Electric Power (25%)
[62] [63]
50 Ludington Ludington Hydro Plant (8741624752).jpg Flag of Michigan.svg  Michigan 43°53′37″N86°26′43″W / 43.89361°N 86.44528°W / 43.89361; -86.44528 (Ludington Pumped Storage) 2,172-698 (2018)-3.67% Hydro (Pumped-storage) Consumers Energy (51%)
DTE Electric (49%)
[64] [65]
51 Jeffrey Jeffrey Energy Center.jpg Flag of Kansas.svg  Kansas 39°17′10″N96°7′1″W / 39.28611°N 96.11694°W / 39.28611; -96.11694 (Jeffrey) 2,1609,499 (2018)50.20% Coal Evergy (50%)
Black Hills Corporation (50%)
[66]
52 John Day JhnDyDam1.jpg Flag of Oregon.svg  Oregon
Flag of Washington.svg  Washington
45°42′59″N120°41′40″W / 45.71639°N 120.69444°W / 45.71639; -120.69444 (John Day Dam) 2,1609,193 (2018)48.58% Hydro (Run-of-the-river) U.S. Army Corps of Engineers [67] [68]
53 Petersburg Flag of Indiana.svg  Indiana 38°31′39″N87°15′14″W / 38.52750°N 87.25389°W / 38.52750; -87.25389 (Petersburg) 2,1469,101 (2018)48.41% Coal AES Indiana [69]
54 Jim Bridger Flag of Wyoming.svg  Wyoming 41°44′15″N108°47′14″W / 41.73750°N 108.78722°W / 41.73750; -108.78722 (Jim Bridger) 2,11010,967 (2018)59.33% Coal MidAmerican Energy [70]
55 Millstone HD.6D.129 (10821944423).jpg Flag of Connecticut.svg  Connecticut 41°18′43″N72°10′7″W / 41.31194°N 72.16861°W / 41.31194; -72.16861 (Millstone) 2,09816,881 (2018)91.85% Nuclear (PWR) Dominion Energy [71]
56 Hoover Ansel Adams - National Archives 79-AAB-01.jpg Flag of Arizona.svg  Arizona
Flag of Nevada.svg  Nevada
36°0′56″N114°44′16″W / 36.01556°N 114.73778°W / 36.01556; -114.73778 (Hoover Dam) 2,0803,542 (2018)19.44% Hydro (Reservoir) U.S. Bureau of Reclamation [72] [73]
57 Chief Joseph Chief Joseph Dam.jpg Flag of Washington.svg  Washington 47°59′43″N119°38′00″W / 47.99528°N 119.63333°W / 47.99528; -119.63333 (Chief Joseph Dam) 2,07512,352 (2018)67.95% Hydro (Run-of-the-river) U.S. Army Corps of Engineers [74] [75]
58 Hines Energy Complex Flag of Florida.svg  Florida 27°47′22″N81°52′17″W / 27.78944°N 81.87139°W / 27.78944; -81.87139 (Hines) 2,06013,368 (2018)74.08% Natural gas Duke Energy [76] [77]
59 Mystic Mystic Station Power Plant.jpg Flag of Massachusetts.svg  Massachusetts 42°23′29″N71°04′01″W / 42.39139°N 71.06694°W / 42.39139; -71.06694 (Mystic) 2,0014,688 (2018)26.74% Natural gas (70.8-99.6%)
Fuel oil (0.4-29.2%)
Exelon [78] [79]
60 Marshall Marshall Steam Station.jpg Flag of North Carolina.svg  North Carolina 35°35′51″N80°57′53″W / 35.59750°N 80.96472°W / 35.59750; -80.96472 (Marshall) 1,9968,486 (2018)48.53% Coal Duke Energy [80]
61 R.M. Schahfer [note 6] Flag of Indiana.svg  Indiana 41°13′1″N87°1′16″W / 41.21694°N 87.02111°W / 41.21694; -87.02111 (Schahfer) 1,9436,772 (2018)39.79% Coal NiSource [82]
62 Ghent Flag of Kentucky.svg  Kentucky 38°45′15″N85°1′17″W / 38.75417°N 85.02139°W / 38.75417; -85.02139 (Ghent) 1,91911,265 (2018)67.01% Coal Kentucky Utilities [83] [84]
63 Nine Mile Point Nine Mile Point Nuclear Generating Station 001.jpg Flag of New York.svg  New York 43°31′15″N76°24′25″W / 43.52083°N 76.40694°W / 43.52083; -76.40694 (Nine Mile Point) 1,90715,383 (2018)92.08% Nuclear (BWR) Exelon (50%)
EDF (50%)
[85] [86]
64 Hal B. Wansley Flag of Georgia (U.S. state).svg  Georgia 33°24′22″N85°2′17″W / 33.40611°N 85.03806°W / 33.40611; -85.03806 (Hal B. Wansley) 1,9042,791 (2018)16.73% Coal Southern Power [87]
65 North Anna North Anna NPP retouched.jpg Flag of Virginia.svg  Virginia 38°3′38″N77°47′22″W / 38.06056°N 77.78944°W / 38.06056; -77.78944 (North Anna) 1,89216,035 (2018)96.75% Nuclear (PWR) Dominion Energy (88.4%)
ODEC (11.6%)
[88]
66 Sabine Flag of Texas.svg  Texas 30°01′24″N93°52′37″W / 30.02333°N 93.87694°W / 30.02333; -93.87694 (Sabine) 1,8904,192 (2018)25.32% Natural gas Entergy [89] [90]
67 St. Lucie St. Lucie Nuclear Power Plant photo D Ramey Logan.jpg Flag of Florida.svg  Florida 27°20′55″N80°14′47″W / 27.34861°N 80.24639°W / 27.34861; -80.24639 (St. Lucie) 1,88015,563 (2018)94.50% Nuclear (PWR) FPL [91] [92]
68 Conemaugh Conemaughgeneration.jpg Flag of Pennsylvania.svg  Pennsylvania 40°23′05″N79°03′49″W / 40.38472°N 79.06361°W / 40.38472; -79.06361 (Conemaugh) 1,87211,445 (2018)69.79% Coal PSEG [93]
69 Brunswick Brunswick NPP-2.jpg Flag of North Carolina.svg  North Carolina 33°57′30″N78°0′37″W / 33.95833°N 78.01028°W / 33.95833; -78.01028 (Brunswick) 1,85814,627 (2018)89.87% Nuclear (BWR) Duke Energy [94]
70 Limestone Flag of Texas.svg  Texas 31°25′24″N96°15′5″W / 31.42333°N 96.25139°W / 31.42333; -96.25139 (Limestone) 1,8509,548 (2018)58.92% Coal NRG Energy [95]
71 Arkansas Nuclear One RusselvillePowerplant.jpg Flag of Arkansas.svg  Arkansas 35°18′37″N93°13′53″W / 35.31028°N 93.23139°W / 35.31028; -93.23139 (Arkansas Nuclear One) 1,82912,721 (2018)79.40% Nuclear (PWR) Entergy [96]
72 Beaver Valley Beaver Valley Nuclear Power Plant.jpg Flag of Pennsylvania.svg  Pennsylvania 40°37′24″N80°25′50″W / 40.62333°N 80.43056°W / 40.62333; -80.43056 (Beaver Valley) 1,82614,653 (2018)91.61% Nuclear (PWR) FirstEnergy [97]
73 Forney Flag of Texas.svg  Texas 32°45′46″N96°29′00″W / 32.76278°N 96.48333°W / 32.76278; -96.48333 (Forney) 1,82410,422 (2018)65.23% Natural gas Luminant [98] [99] [100]
74 Big Bend [note 7] Big Bend Power Station.jpg Flag of Florida.svg  Florida 27°47′45″N82°24′13″W / 27.79583°N 82.40361°W / 27.79583; -82.40361 (Big Bend) 1,8214,788 (2018)30.02% Coal TECO Energy [101] [102]
75 Curtis H. Stanton Flag of Florida.svg  Florida 28°28′56″N81°09′59″W / 28.48222°N 81.16639°W / 28.48222; -81.16639 (Curtis H. Stanton) 1,8206,179 (2018)38.76% Natural gas (51.6%)
Coal (48.4%)
Orlando Utilities Commission [103] [104]
76 Quad Cities HD.6D.122 (10731053375).jpg Flag of Illinois.svg  Illinois 41°43′35″N90°18′36″W / 41.72639°N 90.31000°W / 41.72639; -90.31000 (Quad Cities) 1,81915,476 (2018)97.12% Nuclear (BWR) Exelon (75%)
MidAmerican Energy (25%)
[105]
77 The Dalles Epa-archives the dalles dam-cropped.jpg Flag of Oregon.svg  Oregon
Flag of Washington.svg  Washington
45°36′44″N121°08′04″W / 45.61222°N 121.13444°W / 45.61222; -121.13444 (The Dalles Dam) 1,8137,161 (2018)45.09% Hydro (Run-of-the-river) U.S. Army Corps of Engineers [106] [107]
78 Oswego Harbor Flag of New York.svg  New York 43°27′31″N76°31′55″W / 43.4586°N 76.5319°W / 43.4586; -76.5319 (Oswego Harbor) 1,80442(2018)0.27% Fuel oil or Natural gas NRG Energy [108] [109]
79 Cardinal Cardinal Station seen from Ohio Route 7.JPG Flag of Ohio.svg  Ohio 40°15′7″N80°38′51″W / 40.25194°N 80.64750°W / 40.25194; -80.64750 (Cardinal) 1,80010,038 (2018)63.66% Coal American Electric Power [110]
80 H. L. Culbreath Bayside Flag of Florida.svg  Florida 27°54′26″N82°25′23″W / 27.9072°N 82.4231°W / 27.9072; -82.4231 (H. L. Culbreath Bayside) 1,8006,654 (2018)42.20% Natural gas Tampa Electric Company [111] [112]
81 Intermountain [note 8] Intermountain Power Project UT 2009.jpg Flag of Utah.svg  Utah 39°30′27″N112°34′49″W / 39.50750°N 112.58028°W / 39.50750; -112.58028 (Intermountain) 1,8008,499 (2018)53.90% Coal Intermountain Power Agency [114] [115]
82 San Juan [note 9] P.N.M. San Juan Generating Station, May 2019.jpg Flag of New Mexico.svg  New Mexico 36°48′06″N108°26′19″W / 36.80167°N 108.43861°W / 36.80167; -108.43861 (San Juan) 1,7984,674 (2018)29.68% Coal PNM Resources [117] [118]
83 Dresden HD.6B.274 (11842857676).jpg Flag of Illinois.svg  Illinois 41°23′23″N88°16′5″W / 41.38972°N 88.26806°W / 41.38972; -88.26806 (Dresden) 1,79715,538 (2018)98.71% Nuclear (BWR) Exelon [119]
84 Oak Grove Flag of Texas.svg  Texas 31°10′53″N96°29′17″W / 31.18139°N 96.48806°W / 31.18139; -96.48806 (Oak Grove) 1,79612,216 (2018)77.65% Coal Luminant [120]
85 Alamitos AES Alamitos Generating Station 039.jpg Flag of California.svg  California 33°46′09″N118°06′07″W / 33.76917°N 118.10194°W / 33.76917; -118.10194 (Alamitos Energy Center) 1,760958(2018)6.21% Natural gas AES Corporation [121] [122] [123]
86 Fayette Fayette power project.jpg Flag of Texas.svg  Texas 29°55′00″N96°45′06″W / 29.91667°N 96.75167°W / 29.91667; -96.75167 (Fayette) 1,76010,360 (2018)67.20% Coal Austin Energy (50%)
LCRA (50%)
[124] [125]
87 Edwin I. Hatch E. I. Hatch Nuclear Power Plant.jpg Flag of Georgia (U.S. state).svg  Georgia 31°56′3″N82°20′38″W / 31.93417°N 82.34389°W / 31.93417; -82.34389 (Edwin I. Hatch) 1,75914,404 (2018)93.48% Nuclear (BWR) Georgia Power (50.1%)
Oglethorpe Power (30%)
Others (19.9%)
[126]
88 Joseph M. Farley HD.6D.139 (10821938374).jpg Flag of Alabama.svg  Alabama 31°13′23″N85°6′42″W / 31.22306°N 85.11167°W / 31.22306; -85.11167 (Joseph M. Farley) 1,75714,065 (2018)91.38% Nuclear (PWR) Alabama Power [127]
89 Calvert Cliffs Calvert Cliffs retouched.jpg Flag of Maryland.svg  Maryland 38°25′55″N76°26′32″W / 38.43194°N 76.44222°W / 38.43194; -76.44222 (Calvert Cliffs) 1,71814,988 (2018)99.59% Nuclear (PWR) Exelon [128]
90 Keystone Flag of Pennsylvania.svg  Pennsylvania 40°39′35″N79°20′28″W / 40.65972°N 79.34111°W / 40.65972; -79.34111 (Keystone) 1,71112,418 (2018)82.85% Coal PSEG (22.84%)
ArcLight (20.91%)
Others (56.25%)
[129]
91 Laramie River Laramie River Station.jpg Flag of Wyoming.svg  Wyoming 42°6′26″N104°53′14″W / 42.10722°N 104.88722°W / 42.10722; -104.88722 (Laramie River) 1,71010,690 (2018)71.36% Coal Basin Electric Power Cooperative [130]
92 Independence ChrisLitherlandNewark.jpg Flag of Arkansas.svg  Arkansas 35°40′38″N91°24′35″W / 35.67722°N 91.40972°W / 35.67722; -91.40972 (Independence) 1,6789,683 (2018)65.87% Coal Entergy [131]
93 Surry HD.6D.371 (10856487633).jpg Flag of Virginia.svg  Virginia 37°9′56″N76°41′52″W / 37.16556°N 76.69778°W / 37.16556; -76.69778 (Surry) 1,67613,219 (2018)90.04% Nuclear (PWR) Dominion Energy [132]
94 Midlothian Flag of Texas.svg  Texas 32°25′48″N97°03′18″W / 32.43000°N 97.05500°W / 32.43000; -97.05500 (Midlothian) 1,6505,539 (2018)38.32% Natural gas American National Power [133] [134]
95 Midland Flag of Michigan.svg  Michigan 43°35′10″N84°13′19″W / 43.58611°N 84.22194°W / 43.58611; -84.22194 (Midland) 1,6337,896 (2018)55.20% Natural gas MCV Limited Partnership [135] [136]
96 Raccoon Mountain Raccoon Mountain Pumped-Storage Plant.jpg Flag of Tennessee.svg  Tennessee 35°2′54″N85°23′48″W / 35.04833°N 85.39667°W / 35.04833; -85.39667 (Raccoon Mountain Pumped Storage) 1,616-620 (2018)-4.38% Hydro (Pumped-storage) Tennessee Valley Authority [137] [138]
97 Prairie State Flag of Illinois.svg  Illinois 38°16′40″N89°40′4″W / 38.27778°N 89.66778°W / 38.27778; -89.66778 (Prairie State) 1,60011,532 (2018)82.28% Coal Prairie State Energy Campus [139]
98 The Geysers Sonoma Plant at The Geysers 4778.png Flag of California.svg  California 38°47′26″N122°45′21″W / 38.79056°N 122.75583°W / 38.79056; -122.75583 (The Geysers) 1,5906,516 (2018)46.78% Geothermal (Dry steam) Calpine (86.5%)
NCPA (4.5%)
Others (9%)
[140] [141]
99 Brunner Island Flag of Pennsylvania.svg  Pennsylvania 40°05′44″N76°41′49″W / 40.09556°N 76.69694°W / 40.09556; -76.69694 (Brunner Island) 1,5671,853 (2018)13.50% Coal Talen Energy [142]
100 Springerville Flag of Arizona.svg  Arizona 34°19′4″N109°9′55″W / 34.31778°N 109.16528°W / 34.31778; -109.16528 (Springerville) 1,5609,962 (2018)72.90% Coal Salt River Project [143] [144]
101 Iatan Iatan-power.jpg Flag of Missouri.svg  Missouri 39°27′09″N94°58′35″W / 39.45250°N 94.97639°W / 39.45250; -94.97639 (Iatan) 1,5507,825 (2018)57.63% Coal Evergy [145] [146]
102 Alta Alta Wind Energy Center from Oak Creek Road.jpg Flag of California.svg  California 35°1′16″N118°19′14″W / 35.02111°N 118.32056°W / 35.02111; -118.32056 (Alta Wind Energy Center) 1,5483,366(2018)24.82% Wind SCE [147] [148] [149]
103 Four Corners FOUR CORNERS POWER PLANT - NARA - 544328.jpg Navajo flag.svg  Navajo Nation 36°41′17″N108°28′37″W / 36.68806°N 108.47694°W / 36.68806; -108.47694 (Four Corners) 1,5407,509 (2018)42.02% Coal Arizona Public Service (66%)
SCE (19.2%)
Others (14.8%)
[150] [151]
104 Powerton NRG Powerton Generating Station - Pekin IL (38701197564).jpg Flag of Illinois.svg  Illinois 40°32′28″N89°40′48″W / 40.541°N 89.680°W / 40.541; -89.680 (Powerton) 1,5364,515 (2018)33.56% Coal NRG Energy [152] [153]
105 Ormond Beach [note 10] Coal-fired Power Plant (3518071026).jpg Flag of California.svg  California 34°7′45″N119°10′8″W / 34.12917°N 119.16889°W / 34.12917; -119.16889 (Ormond Beach) 1,516186(2018)1.40% Natural gas GenOn [155] [156]
106 Montour Montour Power Plant 3.JPG Flag of Pennsylvania.svg  Pennsylvania 41°4′13″N76°39′52″W / 41.07028°N 76.66444°W / 41.07028; -76.66444 (Montour) 1,5042,620 (2018)19.89% Coal Talen Energy [157] [158]
107 Castaic Castaic Power Plant Front.jpg Flag of California.svg  California 34°35′14″N118°39′24″W / 34.58722°N 118.65667°W / 34.58722; -118.65667 (Castaic Pumped Storage) 1,500232(2018)1.77% Hydro (Pumped-storage) California DWR (50%)
LADWP (50%)
[159] [160]
108 Northport Northport Stacks.JPG Flag of New York.svg  New York 40°55′22″N73°20′34″W / 40.92278°N 73.34278°W / 40.92278; -73.34278 (Northport) 1,5002,684 (2018)20.43% Natural gas (75%)
Fuel oil (25%)
National Grid USA [161] [162]

Notes

  1. One additional reactor unit, Unit 4, is under construction. Upon completion of Unit 4 in 2024, Vogtle will become the second largest power station in the United States with an installed capacity of 4,536 MW.
  2. Both units will be decommissioned by December 2028
  3. Units 1-2 were decommissioned in 2021, lowering the station's installed capacity to 1,318 MW.
  4. To be decommissioned by 2025.
  5. Units 1-4 were decommissioned in 2020, lowering the station's installed capacity to 1,540 MW.
  6. To be decommissioned by 2023. [81]
  7. The coal-fired Unit 1 (445 MW) is being replaced with a combined-cycle natural gas unit (1,090 MW). Unit 2 (445 MW) will be decommissioned. Units 3 and 4 (445 and 486 MW, respectively) will remain unchanged and operational. Modernization will be completed by 2023. [101]
  8. To be converted to natural gas by 2025. [113]
  9. To be decommissioned by the end of 2021. [116]
  10. To be decommissioned by the end of 2021. [154]

Largest power stations under construction

List of the electrical generating facilities under construction in the United States with an expected installed capacity of at least 1,500 MW.

RankNameImageState Location Capacity
(MW)
TypeOwnerYearRef
1 Chokecherry and Sierra Madre Wyoming wind resource map 50m 800.jpg Flag of Wyoming.svg  Wyoming 41°42′N107°12′W / 41.7°N 107.2°W / 41.7; -107.2 (Chokecherry and Sierra Madre Wind Energy Project) 2,500 - 3,000 Wind Power Company of Wyoming 2026 [5] [163]
2 Vogtle Electric Generating Plant Construction at Vogtle Nuclear Plant.jpg Flag of Georgia (U.S. state).svg  Georgia 33°8′36″N81°45′38″W / 33.14333°N 81.76056°W / 33.14333; -81.76056 (Vogtle Electric Generating Plant) 2,234 Nuclear Georgia Power (45.7%)

(Operator)

OPC (30%)

MEAG (22.7%)

Dalton Utilities (1.6%)

May 2021 (Unit 3)

May 2022 (Unit 4)

[164] [165] [166] [167]
2 Westlands Flag of California.svg  California 36°10′N119°56′W / 36.167°N 119.933°W / 36.167; -119.933 (Westlands Solar Park) 2,000 Solar Westside Holdings
CIM Group
2025 [168] [169]
3 Guernsey Flag of Ohio.svg  Ohio 39°56′15″N81°32′06″W / 39.93750°N 81.53500°W / 39.93750; -81.53500 (Guernsey Power Station) 1,875 Natural gas Caithness Energy
Apex Power Group
2022 [170] [171]

Largest decommissioned power stations

List of former electrical generating facilities in the United States that had an installed capacity of at least 1,500 MW at the time of their decommissioning. Facilities that permanently shut down all of their electricity generating units within five years are included.

RankNameImageState Location Capacity
(MW)
TypeOwnerYearsRef
1 Bruce Mansfield Bruce Mansfield Power Plant.jpg Flag of Pennsylvania.svg  Pennsylvania 40°38′04″N80°25′01″W / 40.63444°N 80.41694°W / 40.63444; -80.41694 (Bruce Mansfield (Decommissioned)) 2,490 Coal FirstEnergy 1976-2019
(43 years)
2 J.M. Stuart JM Stuart Station.jpg Flag of Ohio.svg  Ohio 38°38′16″N83°41′35″W / 38.63778°N 83.69306°W / 38.63778; -83.69306 (J.M. Stuart (Decommissioned)) 2,318 Coal Dynegy (39%)
AES Corporation (35%)
American Electric Power (26%)
1970-2018
(48 years)
3 P.H. Robinson THE P.H. ROBINSON GENERATING PLANT, PART OF HOUSTON LIGHTING AND POWER - NARA - 543913.jpg Flag of Texas.svg  Texas 29°29′15″N94°58′46″W / 29.48750°N 94.97944°W / 29.48750; -94.97944 (P.H. Robinson (Decommissioned)) 2,316 Natural gas NRG Energy 1966-2009
(43 years)
[172]
4 San Onofre San Onofre Nuclear Generating Station, 2012.jpg Flag of California.svg  California 33°22′8″N117°33′18″W / 33.36889°N 117.55500°W / 33.36889; -117.55500 (San Onofre (Decommissioned)) 2,254 Nuclear (PWR) SCE (78.2%)
SDG&E (20%)
City of Riverside (1.8%)
1968-2013
(45 years)
5 Navajo Navajo Generating Station from the south.JPG Navajo flag.svg  Navajo Nation 36°54′12″N111°23′25″W / 36.90333°N 111.39028°W / 36.90333; -111.39028 (Navajo (Decommissioned)) 2,250 Coal U.S. Bureau of Reclamation (24.3%)
Salt River Project (21.7%)
Others (54%)
1974-2019
(45 years)
6 Zion Zion Nuclear Power Station Aerial Photo taken April 7 2018.jpg Flag of Illinois.svg  Illinois 42°26′46″N87°48′10″W / 42.44611°N 87.80278°W / 42.44611; -87.80278 (Zion (Decommissioned)) 2,080 Nuclear (PWR) Exelon 1973-1998
(25 years)
7 Monticello Flag of Texas.svg  Texas 33°5′28″N95°2′17″W / 33.09111°N 95.03806°W / 33.09111; -95.03806 (Monticello (Decommissioned)) 1,880 Coal Luminant 1974-2018
(44 years)
8 Mohave Mohave Generating Station 1.jpg Flag of Nevada.svg  Nevada 35°08′42″N114°35′19″W / 35.14500°N 114.58861°W / 35.14500; -114.58861 (Mohave (Decommissioned)) 1,636 Coal SCE (56%)
Salt River Project (20%)
Others (24%)
1971-2005
(34 years)
9 Harllee Branch Harllee Branch Chimney.JPG Flag of Georgia (U.S. state).svg  Georgia 33°11′38″N83°17′59″W / 33.19389°N 83.29972°W / 33.19389; -83.29972 (Harllee Branch (Decommissioned)) 1,539 Coal Georgia Power 1961-2015
(54 years)
10 Muskingum River Power Plant and 3 Silos on Farm - panoramio.jpg Flag of Ohio.svg  Ohio 39°35′18″N81°40′57″W / 39.58833°N 81.68250°W / 39.58833; -81.68250 (Muskingum River (Decommissioned)) 1,529 Coal American Electric Power 1953-2015
(62 years)
11 Johnsonville Johnsonville fossil plant.jpg Flag of Tennessee.svg  Tennessee 36°1′40″N87°59′12″W / 36.02778°N 87.98667°W / 36.02778; -87.98667 (Johnsonville (Decommissioned)) 1,500 Coal Tennessee Valley Authority 1951-2017
(66 years)

See also

Related Research Articles

<span class="mw-page-title-main">Virgil C. Summer Nuclear Generating Station</span> Nuclear power plant located near Jenkinsville, South Carolina

The Virgil C. Summer Nuclear Power Station occupies a site near Jenkinsville, South Carolina, in Fairfield County, South Carolina, approximately 20 miles (32 km) northwest of Columbia.

<span class="mw-page-title-main">Capacity factor</span> Electrical production measure

The net capacity factor is the unitless ratio of actual electrical energy output over a given period of time to the theoretical maximum electrical energy output over that period. The theoretical maximum energy output of a given installation is defined as that due to its continuous operation at full nameplate capacity over the relevant period. The capacity factor can be calculated for any electricity producing installation, such as a fuel consuming power plant or one using renewable energy, such as wind, the sun or hydro-electric installations. The average capacity factor can also be defined for any class of such installations, and can be used to compare different types of electricity production.

<span class="mw-page-title-main">Oak Creek Power Plant</span> Electrical power station in Oak Creek, Milwaukee County, Wisconsin

Oak Creek Power Plant, also known as South Oak Creek, is a base load, coal- and natural gas-fired, electrical power station located on Lake Michigan in Oak Creek, Wisconsin. Oak Creek Power Plant along with Elm Road Generation Station make up the entire Oak Creek Generating Site.

<span class="mw-page-title-main">Edgewater Generating Station</span> Coal power plant in Sheboygan, Wisconsin

Edgewater Generating Station is a 380 megawatt (MW) coal power plant located on the south side of Sheboygan, Wisconsin, on the shore of Lake Michigan, whose waters are used to provide cooling. It provides electricity for customers in the northeastern part of Alliant Energy's Wisconsin Power & Light service area and service to several local municipal utilities. In 2009, it was the seventh largest generating station in Wisconsin, with a net summer capacity of 767 MW.

References

  1. "Electricity generation, capacity, and sales in the United States - U.S. Energy Information Administration (EIA)". www.eia.gov. Retrieved 3 May 2023.
  2. "Electricity generation, capacity, and sales in the United States - top 10 - U.S. Energy Information Administration (EIA)". www.eia.gov. Retrieved 3 May 2023.
  3. "Electricity generation, capacity, and sales in the United States - top 10 - U.S. Energy Information Administration (EIA)". www.eia.gov. Retrieved 3 May 2023.
  4. "Electricity generation, capacity, and sales in the United States - top 10 - U.S. Energy Information Administration (EIA)". www.eia.gov. Retrieved 3 May 2023.
  5. 1 2 "Power Company of Wyoming: Chokecherry and Sierra Madre Wind Energy Project". www.powercompanyofwyoming.com. Retrieved 12 January 2020.
  6. "Grand Coulee Dam - Hydroelectric Project Information | Columbia Basin Research". www.cbr.washington.edu. Retrieved 30 January 2020.
  7. "Electricity Data Browser - Grand Coulee". www.eia.gov. Retrieved 1 February 2020.
  8. "Electricity Data Browser - Palo Verde". www.eia.gov. Retrieved 9 February 2020.
  9. "Electricity Data Browser - Browns Ferry". www.eia.gov. Retrieved 11 February 2020.
  10. 1 2 3 4 5 "Ten Year Power Plant Site Plan 2019 – 2028" (PDF). Florida Power & Light. April 2019. Retrieved 15 January 2020.
  11. "Electricity Data Browser - West County Energy Center". www.eia.gov. Retrieved 2 February 2020.
  12. "Electricity Data Browser - W A Parish". www.eia.gov. Retrieved 9 February 2020.
  13. "Electricity Data Browser - Scherer". www.eia.gov. Retrieved 9 February 2020.
  14. "Electricity Data Browser - Bowen". www.eia.gov. Retrieved 9 February 2020.
  15. "Electricity Data Browser - Vogtle". www.eia.gov. Retrieved 12 February 2020.
  16. "Electricity Data Browser - Monroe (MI)". www.eia.gov. Retrieved 9 February 2020.
  17. "Electricity Data Browser - Gibson". www.eia.gov. Retrieved 9 February 2020.
  18. "Bath County Pumped Storage Station | Dominion Energy". www.dominionenergy.com. Retrieved 30 January 2020.
  19. "Electricity Data Browser - Bath County". www.eia.gov. Retrieved 1 February 2020.
  20. "Electricity Data Browser - Turkey Point". www.eia.gov. Retrieved 12 February 2020.
  21. "Electricity Data Browser - Manatee". www.eia.gov. Retrieved 2 February 2020.
  22. "Electricity Data Browser - John E Amos". www.eia.gov. Retrieved 9 February 2020.
  23. "Electricity Data Browser - South Texas Project". www.eia.gov. Retrieved 11 February 2020.
  24. "Electricity Data Browser - Fort Myers". www.eia.gov. Retrieved 9 February 2020.
  25. "Electricity Data Browser - Robert Moses Niagara". www.eia.gov. Retrieved 1 February 2020.
  26. "Electricity Data Browser - James H Miller Jr". www.eia.gov. Retrieved 9 February 2020.
  27. "Electricity Data Browser - Peach Bottom". www.eia.gov. Retrieved 11 February 2020.
  28. "Electricity Data Browser - Gavin Power LLC". www.eia.gov. Retrieved 9 February 2020.
  29. "Electricity Data Browser - Rockport". www.eia.gov. Retrieved 9 February 2020.
  30. "Electricity Data Browser - Oconee". www.eia.gov. Retrieved 11 February 2020.
  31. "Electricity Data Browser - TalenEnergy Susquehanna". www.eia.gov. Retrieved 11 February 2020.
  32. "Electricity Data Browser - Braidwood Generating Station". www.eia.gov. Retrieved 12 February 2020.
  33. "Electricity Data Browser - Ravenswood". www.eia.gov. Retrieved 9 February 2020.
  34. "Electricity Data Browser - Cumberland (TN)". www.eia.gov. Retrieved 9 February 2020.
  35. "Electricity Data Browser - Byron Generating Station". www.eia.gov. Retrieved 12 February 2020.
  36. "Electricity Data Browser - Sequoyah". www.eia.gov. Retrieved 12 February 2020.
  37. "Union Power Project, El Dorado, AR". Power Technology | Energy News and Market Analysis. Retrieved 14 January 2020.
  38. "Entergy Corporation Subsidiaries Close Transaction to Buy Union Power Station". www.entergynewsroom.com. Retrieved 15 January 2020.
  39. "Electricity Data Browser - Union Power Station". www.eia.gov. Retrieved 9 February 2020.
  40. "Electricity Data Browser - Comanche Peak". www.eia.gov. Retrieved 12 February 2020.
  41. "Electricity Data Browser - Roxboro". www.eia.gov. Retrieved 9 February 2020.
  42. "Chalk Point Generating Plant" (PDF). 16 December 2009. Retrieved 13 January 2019.
  43. "Electricity Data Browser - Chalk Point LLC". www.eia.gov. Retrieved 9 February 2020.
  44. "Electricity Data Browser - Cross". www.eia.gov. Retrieved 9 February 2020.
  45. "Electricity Data Browser - Sanford". www.eia.gov. Retrieved 9 February 2020.
  46. "AMEREN MISSOURI FACTS" (PDF). Ameren. 2019. Retrieved 12 January 2020.
  47. "Electricity Data Browser - Labadie". www.eia.gov. Retrieved 9 February 2020.
  48. "Electricity Data Browser - Catawba". www.eia.gov. Retrieved 12 February 2020.
  49. "Electricity Data Browser - Watts Bar Nuclear Plant". www.eia.gov. Retrieved 12 February 2020.
  50. "Electricity Data Browser - PSEG Salem Generating Station". www.eia.gov. Retrieved 12 February 2020.
  51. "Electricity Data Browser - McGuire". www.eia.gov. Retrieved 12 February 2020.
  52. "Electricity Data Browser - LaSalle Generating Station". www.eia.gov. Retrieved 12 February 2020.
  53. "Electricity Data Browser - Limerick". www.eia.gov. Retrieved 12 February 2020.
  54. "Electricity Data Browser - Diablo Canyon". www.eia.gov. Retrieved 9 February 2020.
  55. "Electricity Data Browser - Martin Lake". www.eia.gov. Retrieved 9 February 2020.
  56. "Electricity Data Browser - Belews Creek". www.eia.gov. Retrieved 9 February 2020.
  57. "Electricity Data Browser - Sherburne County". www.eia.gov. Retrieved 9 February 2020.
  58. "Martin Power Plant | Florida Department of Environmental Protection". floridadep.gov. Retrieved 13 January 2020.
  59. "Electricity Data Browser - Martin". www.eia.gov. Retrieved 9 February 2020.
  60. "Electricity Data Browser - FirstEnergy W H Sammis". www.eia.gov. Retrieved 9 February 2020.
  61. "Electricity Data Browser - Donald C Cook". www.eia.gov. Retrieved 12 February 2020.
  62. "SRP: Gila River Station". www.srpnet.com. Retrieved 12 January 2020.
  63. "Electricity Data Browser - Number of plants for natural gas, Arizona, all sectors, Gila River". www.eia.gov. Retrieved 9 February 2020.
  64. Network, Michael McCluskey / Energy News (24 September 2018). "Michigan utilities upgrade pumped storage plant ahead of renewable push". Energy News Network. Retrieved 30 January 2020.
  65. "Electricity Data Browser - Ludington". www.eia.gov. Retrieved 1 February 2020.
  66. "Electricity Data Browser - Jeffrey Energy Center". www.eia.gov. Retrieved 9 February 2020.
  67. "John Day Dam - Hydroelectric Project Information | Columbia Basin Research". www.cbr.washington.edu. Retrieved 30 January 2020.
  68. "Electricity Data Browser - John Day". www.eia.gov. Retrieved 1 February 2020.
  69. "Electricity Data Browser - AES Petersburg". www.eia.gov. Retrieved 9 February 2020.
  70. "Electricity Data Browser - Jim Bridger". www.eia.gov. Retrieved 9 February 2020.
  71. "Electricity Data Browser - Millstone". www.eia.gov. Retrieved 12 February 2020.
  72. "Electricity Data Browser - Hoover (AZ)". www.eia.gov. Retrieved 1 February 2020.
  73. "Electricity Data Browser - Hoover (NV)". www.eia.gov. Retrieved 1 February 2020.
  74. "Chief Joseph Dam - Hydroelectric Project Information | Columbia Basin Research". www.cbr.washington.edu. Retrieved 30 January 2020.
  75. "Electricity Data Browser - Chief Joseph". www.eia.gov. Retrieved 1 February 2020.
  76. "Hines Energy Complex | Florida Department of Environmental Protection". floridadep.gov. Retrieved 14 January 2020.
  77. "Electricity Data Browser - Hines Energy Complex". www.eia.gov. Retrieved 9 February 2020.
  78. "Exelon". www.exeloncorp.com. Retrieved 13 January 2020.
  79. "Electricity Data Browser - Mystic Generating Station". www.eia.gov. Retrieved 9 February 2020.
  80. "Electricity Data Browser - Marshall (NC)". www.eia.gov. Retrieved 9 February 2020.
  81. Commons, Lotzman Katzman / Wikimedia (7 February 2019). "Indiana NAACP leaders say coal plant timeline is unacceptable for residents". Energy News Network. Retrieved 13 January 2020.
  82. "Electricity Data Browser - R M Schahfer". www.eia.gov. Retrieved 9 February 2020.
  83. "Ghent Generating Station". LG&E and KU. Retrieved 14 January 2020.
  84. "Electricity Data Browser - Ghent". www.eia.gov. Retrieved 9 February 2020.
  85. "Nine Mile Point". www.exeloncorp.com. Retrieved 13 January 2020.
  86. "Electricity Data Browser - Nine Mile Point Nuclear Station". www.eia.gov. Retrieved 12 February 2020.
  87. "Electricity Data Browser - Wansley". www.eia.gov. Retrieved 9 February 2020.
  88. "Electricity Data Browser - North Anna". www.eia.gov. Retrieved 12 February 2020.
  89. "st-other-usa-tx". archive.ph. 4 December 2012. Archived from the original on 4 December 2012. Retrieved 13 January 2020.
  90. "Electricity Data Browser - Sabine". www.eia.gov. Retrieved 9 February 2020.
  91. "St. Lucie Nuclear Power Plant | Florida Department of Environmental Protection". floridadep.gov. Retrieved 15 January 2020.
  92. "Electricity Data Browser - St Lucie". www.eia.gov. Retrieved 12 February 2020.
  93. "Electricity Data Browser - Conemaugh". www.eia.gov. Retrieved 9 February 2020.
  94. "Electricity Data Browser - Brunswick Nuclear". www.eia.gov. Retrieved 12 February 2020.
  95. "Electricity Data Browser - Limestone". www.eia.gov. Retrieved 9 February 2020.
  96. "Electricity Data Browser - Arkansas Nuclear One". www.eia.gov. Retrieved 12 February 2020.
  97. "Electricity Data Browser - Beaver Valley". www.eia.gov. Retrieved 12 February 2020.
  98. "Forney Energy Center" (PDF). NextEra Energy Resources. Retrieved 3 February 2020.
  99. Richards, Mathew. "Forney begins annexation process of Luminant power plant, formerly NextEra". inForney.com. Retrieved 4 February 2020.
  100. "Electricity Data Browser - Forney Energy Center". www.eia.gov. Retrieved 9 February 2020.
  101. 1 2 "Big Bend Modernisation Project, Hillsborough County, Florida, USA". Power Technology | Energy News and Market Analysis. Retrieved 24 January 2020.
  102. "Electricity Data Browser - Big Bend". www.eia.gov. Retrieved 9 February 2020.
  103. "Curtis H. Stanton Energy Center | Florida Department of Environmental Protection". floridadep.gov. Retrieved 14 January 2020.
  104. "Electricity Data Browser - Stanton Energy Center". www.eia.gov. Retrieved 9 February 2020.
  105. "Electricity Data Browser - Quad Cities Generating Station". www.eia.gov. Retrieved 12 February 2020.
  106. "The Dalles Dam - Hydroelectric Project Information | Columbia Basin Research". www.cbr.washington.edu. Retrieved 30 January 2020.
  107. "Electricity Data Browser - The Dalles". www.eia.gov. Retrieved 1 February 2020.
  108. "Oswego Harbor Oil Power Plant". www.industryabout.com. Retrieved 15 January 2020.
  109. "Electricity Data Browser - Oswego Harbor Power". www.eia.gov. Retrieved 9 February 2020.
  110. "Electricity Data Browser - Cardinal". www.eia.gov. Retrieved 9 February 2020.
  111. "Tampa Electric". Tampa Electric Website. Retrieved 14 January 2020.
  112. "Electricity Data Browser - H. L. Culbreath Bayside Power Station". www.eia.gov. Retrieved 9 February 2020.
  113. "L.A. City Council votes to move away from coal-fired energy". Los Angeles Times. 23 April 2013. Retrieved 14 January 2020.
  114. "Purpose & Mission – Intermountain Power Agency" . Retrieved 14 January 2020.
  115. "Electricity Data Browser - Intermountain Power Project". www.eia.gov. Retrieved 9 February 2020.
  116. "Reducing Coal". www.pnm.com. Retrieved 14 January 2020.
  117. "San Juan Generating Station Air Quality Control Systems". Babcock & Wilcox. Retrieved 13 January 2020.
  118. "Electricity Data Browser - San Juan". www.eia.gov. Retrieved 9 February 2020.
  119. "Electricity Data Browser - Dresden Generating Station". www.eia.gov. Retrieved 12 February 2020.
  120. "Electricity Data Browser - Oak Grove (TX)". www.eia.gov. Retrieved 9 February 2020.
  121. "AES Alamitos, LLC". rtk.rjifuture.org. Retrieved 16 February 2020.
  122. "Alamitos Energy Center, Licensing Case - Docket # 2013-AFC-01". ww2.energy.ca.gov. Retrieved 16 February 2020.
  123. "Electricity Data Browser - AES Alamitos LLC". www.eia.gov. Retrieved 2 February 2020.
  124. "Fayette Power Project" (PDF). LCRA. January 2019. Archived from the original (PDF) on 4 March 2019. Retrieved 13 January 2020.
  125. "Electricity Data Browser - Fayette Power Project". www.eia.gov. Retrieved 9 February 2020.
  126. "Electricity Data Browser - Edwin I Hatch". www.eia.gov. Retrieved 12 February 2020.
  127. "Electricity Data Browser - Joseph M. Farley". www.eia.gov. Retrieved 11 February 2020.
  128. "Electricity Data Browser - Calvert Cliffs Nuclear Power Plant". www.eia.gov. Retrieved 12 February 2020.
  129. "Electricity Data Browser - Keystone". www.eia.gov. Retrieved 9 February 2020.
  130. "Electricity Data Browser - Laramie River Station". www.eia.gov. Retrieved 3 March 2020.
  131. "Electricity Data Browser - Independence Steam Electric Station". www.eia.gov. Retrieved 9 February 2020.
  132. "Electricity Data Browser - Surrry". www.eia.gov. Retrieved 12 February 2020.
  133. "Midlothian Combined Cycle Gas Turbine Project, USA". Power Technology | Energy News and Market Analysis. Retrieved 13 January 2020.
  134. "Electricity Data Browser - Midlothian Energy Facility". www.eia.gov. Retrieved 9 February 2020.
  135. "Facts | Midland Cogeneration Venture". www.midcogen.com. Retrieved 13 January 2020.
  136. "Electricity Data Browser - Midland Cogeneration Venture". www.eia.gov. Retrieved 9 February 2020.
  137. "TVA - Raccoon Mountain". www.tva.gov. Retrieved 31 January 2020.
  138. "Electricity Data Browser - Raccoon Mountain". www.eia.gov. Retrieved 1 February 2020.
  139. "Electricity Data Browser - Prairie State Generating Station". www.eia.gov. Retrieved 9 February 2020.
  140. Brophy, P.; Lippmann, M.; Dobson, P.F.; Poux, B. (1 October 2010). "The Geysers Geothermal Field Update1990/2010". OSTI 1048267. doi:10.2172/1048267. OSTI   1048267.{{cite journal}}: Cite journal requires |journal= (help)
  141. "Electricity Data Browser - List of plants for geothermal, California, all sectors". www.eia.gov. Retrieved 2 February 2020.
  142. "Electricity Data Browser - Brunner Island". www.eia.gov. Retrieved 9 February 2020.
  143. "SRP: Springerville Generating Station". www.srpnet.com. Retrieved 13 January 2020.
  144. "Electricity Data Browser - Springerville". www.eia.gov. Retrieved 9 February 2020.
  145. Peltier, 08/01/2011 | Dr Robert; PE (1 August 2011). "Plant of the Year: KCP&L's Iatan 2 Earns POWER's Highest Honor". POWER Magazine. Retrieved 13 January 2020.{{cite web}}: CS1 maint: numeric names: authors list (link)
  146. "Electricity Data Browser - Iatan". www.eia.gov. Retrieved 9 February 2020.
  147. "Alta Wind Energy Center (AWEC), California". Power Technology | Energy News and Market Analysis. Retrieved 14 February 2020.
  148. "World's Largest Wind Project is Underway". Renewable Energy World. 29 July 2010. Retrieved 14 February 2020.
  149. "Electricity Data Browser - List of plants for wind, California, all sectors". www.eia.gov. Retrieved 20 February 2020.
  150. "SRP: Four Corners Power Plant". www.srpnet.com. Retrieved 13 January 2020.
  151. "Electricity Data Browser - Four Corners". www.eia.gov. Retrieved 9 February 2020.
  152. "Environmental Upgrades at Powerton Generating Station | McCarthy". www.mccarthy.com. Retrieved 13 January 2020.
  153. "Electricity Data Browser - Powerton". www.eia.gov. Retrieved 9 February 2020.
  154. Leung, Wendy. "Power plant at Ormond Beach could continue operating past 2020 end date". Ventura County Star. Retrieved 14 January 2020.
  155. "Ormond Beach Power Plant in Oxnard, CA". Virtual Globetrotting. 25 March 2006. Retrieved 14 January 2020.
  156. "Electricity Data Browser - Ormond Beach". www.eia.gov. Retrieved 2 February 2020.
  157. "Montour". Talen Energy. Retrieved 13 January 2020.
  158. "Electricity Data Browser - TalenEnergy Montour". www.eia.gov. Retrieved 9 February 2020.
  159. "Los Angeles Department of Water and Power Energy Storage Development Plan: Description of Existing and Eligible Energy Storage System" (PDF). LADWP. 2 September 2014. pp. 7–8. Retrieved 12 December 2019.
  160. "Electricity Data Browser - Castaic". www.eia.gov. Retrieved 1 February 2020.
  161. "Arquivo.pt". arquivo.pt (in Portuguese). Archived from the original on 18 July 2009. Retrieved 13 January 2020.
  162. "Electricity Data Browser - Northport". www.eia.gov. Retrieved 9 February 2020.
  163. Erickson, Camille. "Work on Wyoming's largest wind farm project continues even as schedule changes". Casper Star-Tribune Online. Retrieved 12 January 2020.
  164. "Vogtle Update October 2019" (PDF).
  165. "Construction Photos". Georgia Power. Retrieved 18 September 2020.
  166. "Final Module Placed for Vogtle Unit 3". Georgia Power. Retrieved 18 September 2020.
  167. "Vogtle 3 and 4". Georgia Power. Retrieved 18 September 2020.
  168. "Westlands Solar Park" . Retrieved 13 January 2020.
  169. Reporter, Seth Nidever Staff. "Official: Giant solar proposal poised for growth". Hanford Sentinel. Retrieved 13 January 2020.
  170. "Massive Natural Gas-Fired Power Plant Moving Forward in Ohio". www.naturalgasintel.com. 4 September 2019. Retrieved 13 January 2020.
  171. "Guernsey Power Station". guernseypowerstation.com. Retrieved 13 January 2020.
  172. "PH Robinson 1 Gas Power Plant (Shutdown)". www.industryabout.com. Retrieved 14 January 2020.