The Dakota Territory legislature created the county on January 4, 1873, with Grand Rapids as the county seat. However, the county organization was not completed at that time, nor was the county attached to another county for administrative and judicial purposes. It was named for Judson LaMoure,[4] a member of the territorial/state legislature from 1872 to 1918.[5]
The county organization was affected on October 27, 1881. Its boundaries were altered in February 1881 and in March 1883. It has retained its present boundary since that time.[6][7] The present county seat, LaMoure, was founded in 1882, and the county seat was transferred to that community soon after.
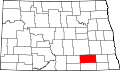
Outline map of LaMoure County, North Dakota, 1913
Geography
The James River flows southeasterly through the central portion of LaMoure County, and a tributary of the South Branch Maple River flows southerly from the center of the county. The county terrain consists of rolling hills, mostly devoted to agriculture.
[8] The terrain slopes to the south and east; its highest point is on its upper west boundary line at 2,047ft (624m) ASL.[9]
According to the United States Census Bureau, the county has a total area of 1,150.957 square miles (2,980.96km2), of which 1,146.005 square miles (2,968.14km2) is land and 4.952 square miles (12.83km2) (0.43%) is water.[10] It is the 29th largest county in North Dakota by total area.[11]
U.S. Decennial Census[13] 1790–1960[14] 1900–1990[15] 1990–2000[16] 2010–2020[2]
As of the fourth quarter of 2024, the median home value in LaMoure County was $125,027.[17]
As of the 2023 American Community Survey, there are 1,712 estimated households in LaMoure County with an average of 2.31 persons per household. The county has a median household income of $70,263. Approximately 9.4% of the county's population lives at or below the poverty line. LaMoure County has an estimated 63.6% employment rate, with 24.2% of the population holding a bachelor's degree or higher and 92.0% holding a high school diploma.[2]
The top five reported ancestries (people were allowed to report up to two ancestries, thus the figures will generally add to more than 100%) were English (95.6%), Spanish (1.0%), Indo-European (3.2%), Asian and Pacific Islander (0.1%), and Other (0.1%).
The median age in the county was 46.7 years.
LaMoure County, North Dakota – racial and ethnic composition Note: the US Census treats Hispanic/Latino as an ethnic category. This table excludes Latinos from the racial categories and assigns them to a separate category. Hispanics/Latinos may be of any race.
As of the 2024 estimate, there were 4,051 people and 1,712 households residing in the county. There were 2,056 housing units at an average density of 1.79 per square mile (0.7/km2). The racial makeup of the county was 97.3% White (94.7% NH White), 0.6% African American, 0.9% Native American, 0.1% Asian, 0.1% Pacific Islander, _% from some other races and 0.9% from two or more races. Hispanic or Latino people of any race were 2.7% of the population.[23]
2020 census
As of the 2020 census, the county had a population of 4,093, 1,720 households, and 1,105 families residing in the county.[24] Of the residents, 22.6% were under the age of 18 and 25.8% were 65 years of age or older; the median age was 47.4 years. For every 100 females there were 103.7 males, and for every 100 females age 18 and over there were 103.2 males.[25] The population density was 3.57 inhabitants per square mile (1.4/km2). There were 2,064 housing units at an average density of 1.80 per square mile (0.7/km2).[26] The racial makeup of the county was 95.8% White, 0.3% Black or African American, 0.6% American Indian and Alaska Native, 0.2% Asian, 0.8% from some other race, and 2.1% from two or more races. Hispanic or Latino residents of any race comprised 2.2% of the population.[24] There were 1,720 households in the county, of which 24.1% had children under the age of 18 living with them and 18.9% had a female householder with no spouse or partner present. About 31.4% of all households were made up of individuals and 16.9% had someone living alone who was 65 years of age or older.[25] There were 2,064 housing units, of which 16.7% were vacant. Among occupied housing units, 81.7% were owner-occupied and 18.3% were renter-occupied. The homeowner vacancy rate was 2.3% and the rental vacancy rate was 11.7%.[25]
2010 census
As of the 2010 census, there were 4,139 people, 1,825 households, and 1,182 families residing in the county. The population density was 3.61 inhabitants per square mile (1.4/km2). There were 2,238 housing units at an average density of 1.95 per square mile (0.8/km2). The racial makeup of the county was 98.50% White, 0.14% African American, 0.39% Native American, 0.14% Asian, 0.00% Pacific Islander, 0.22% from some other races and 0.60% from two or more races. Hispanic or Latino people of any race were 0.82% of the population.
There were 1,825 households, 22.8% had children under the age of 18 living with them, 56.9% were married couples living together, 4.6% had a female householder with no husband present, 35.2% were non-families, and 32.7% of all households were made up of individuals. The average household size was 2.23 and the average family size was 2.82. The median age was 49.2 years.
The median income for a household in the county was $46,098 and the median income for a family was $60,932. Males had a median income of $41,250 versus $25,172 for females. The per capita income for the county was $27,056. About 6.8% of families and 9.1% of the population were below the poverty line, including 6.8% of those under age 18 and 16.9% of those age 65 or over.
LaMoure County voters are traditionally Republican. In only one national election since 1936 has the county selected the Democratic Party candidate (as of 2024).
United States presidential election results for LaMoure County, North Dakota[27]
This page is based on this Wikipedia article Text is available under the CC BY-SA 4.0 license; additional terms may apply. Images, videos and audio are available under their respective licenses.