2001 Canadian Census

Last updated
2001 Canadian Census
  1996
2006  
Statistics Canada logo.svg
General information
CountryCanada
Date takenMay 15, 2001
Total population30,007,094
Percent changeIncrease2.svg 4%

The 2001 Canadian Census was a detailed enumeration of the Canadian population. Census day was May 15, 2001. On that day, Statistics Canada attempted to count every person in Canada. The total population count of Canada was 30,007,094. [1] This was a 4% increase over 1996 Census of 28,846,761. In contrast, the official Statistics Canada population estimate for 2001 was 31,021,300. This is considered a more accurate population number than the actual count. [2]

Contents

The following census was the 2006 Census.

Canada by the numbers

A summary of information about Canada.

Total Population30,007,094
Dwellings12,548,588
Men14,706,850
Women15,300,245
Median age37.6 years
Average earnings$31,757

Census summary

Canada has experienced one of the smallest census-to-census growth rates in its population. From 1996 to 2001, the nation's population increased only 4.0%. The Census counted 30,007,094 people on May 15, 2001, compared with 28,846,761 on May 14, 1996.

Only three provinces and one territory had growth rates above the national average. Alberta's population soared 10.3%, Ontario gained 6.1% and British Columbia, 4.9%. Nunavut's population rose 8.1%. The population of Newfoundland and Labrador declined for the second consecutive census period.

Urbanization continued. In 2001, 79.4% of Canadians lived in an urban centre of 10,000 people or more, compared with 78.5% in 1996. Outside the urban centres, the population of rural and small-town areas declined 0.4%.

In 2001, just over 64% of the nation's population, or about 19,297,000 people, lived in the 27 census metropolitan areas (CMAs), up slightly from 63% in 1996. Seven of these 27 CMAs saw their populations grow at a rate of at least double the national average. The strongest rise, by far, occurred in Calgary.

From 1996 to 2001, the nation's population concentrated further in four broad urban regions: the extended Golden Horseshoe in southern Ontario; Montreal and environs; British Columbia's Lower Mainland and southern Vancouver Island; and the Calgary-Edmonton corridor. In 2001, 51% of Canada's population lived in these regions, compared with 49% in 1996.

Population by province/territory

RankProvince or territoryPopulation as of
2001 Census
Population as of
1996 Census
ChangePercent
change
1Flag of Ontario.svg  Ontario 11,410,04610,753,573656,473 Increase2.svg6.1% Increase2.svg
2Flag of Quebec.svg  Quebec 7,237,4797,138,79598,684 Increase2.svg1.4% Increase2.svg
3Flag of British Columbia.svg  British Columbia 3,907,7383,724,500183,238 Increase2.svg4.9% Increase2.svg
4Flag of Alberta.svg  Alberta 2,974,8072,696,826277,981 Increase2.svg10.3% Increase2.svg
5Flag of Manitoba.svg  Manitoba 1,119,5831,113,8985,685 Increase2.svg0.5% Increase2.svg
6Flag of Saskatchewan.svg  Saskatchewan 978,933976,6152,318 Increase2.svg0.2% Increase2.svg
7Flag of Nova Scotia.svg  Nova Scotia 908,007909,282-1,275 Decrease2.svg-0.1% Decrease2.svg
8Flag of New Brunswick.svg  New Brunswick 729,498738,133-8,635 Decrease2.svg-1.2% Decrease2.svg
9Flag of Newfoundland and Labrador.svg  Newfoundland and Labrador 512,930551,790-38,860 Decrease2.svg-7.0% Decrease2.svg
10Flag of Prince Edward Island.svg  Prince Edward Island 135,294134,557737 Increase2.svg0.5% Increase2.svg
11Flag of the Northwest Territories.svg  Northwest Territories 37,36064,402-27,042 Decrease2.svg-42.0% Decrease2.svg
12Flag of Yukon.svg  Yukon 28,67430,766-2,092 Decrease2.svg-6.8% Decrease2.svg
13Flag of Nunavut.svg  Nunavut 26,745
Flag of Canada (Pantone).svg  Canada 30,007,09428,833,1371,173,957 Increase2.svg4.1% Increase2.svg

Demographics

Mother tongue

Population by mother tongue of Canada's official languages:

Mother tonguePopulation
English 17,572,170
French 6,741,955
Bilingual 122,660
Other5,202,240

Aboriginal peoples

Population of Aboriginal peoples in Canada:

Aboriginal Population976,305
North American Indian 608,850
Métis 292,305
Inuit 45,070

Ethnic origin

Population by ethnic origin. Only those origins with more than 250,000 respondents are included here. This is based entirely on self reporting.

Ethnic originsTotal responsesSingle responsesMultiple responses 2
Total population29,639,03518,307,54011,331,490
Canadian 11,682,6806,748,1354,934,550
English 5,978,8751,479,5204,499,355
French 4,668,4101,060,7553,607,655
Scottish 4,157,210607,2353,549,975
Irish 3,822,660496,8653,325,800
German 2,742,765705,5952,037,170
Italian 1,270,370726,275544,090
Chinese 1,094,700936,210158,490
Ukrainian 1,071,060326,200744,860
North American Indian 1,000,890455,805545,085
Dutch (Netherlands)923,310316,220607,090
Polish 817,085260,415556,670
African 731,044UnknownUnknown
East Indian 713,330581,665131,665
Norwegian 363,76047,230316,530
Portuguese 357,690252,835104,855
Welsh 350,36528,445321,925
Jewish 348,605186,475162,130
Russian 337,96070,890267,070
Filipino 327,545266,14061,410
Métis 307,84572,210235,635
Swedish 282,76030,440252,320
Hungarian (Magyar)267,25591,795175,460
American (USA)250,01025,200224,805

Religion

Population by religion. Only those religions with more than 250,000 respondents are included here. The census question was partly aided—that is, the questionnaire form gave examples of some of the denominations but not others. The actual question asked is noted below.

ReligionTotal responses% of Population
Roman Catholic 12,793,12543.2
No religion4,796,32516.2
United Church 2,839,1259.6
Anglican 2,035,5006.9
Christian n.i.e. [3] 780,4502.6
Baptist 729,4702.5
Lutheran 606,5902.0
Muslim 579,6402.0
Protestant n.i.e. [3] 549,2051.9
Presbyterian 409,8301.4
Pentecostal 369,4751.2
Jewish 329,9951.1
Buddhist 300,3451.0
Hindu 297,2001.0
Sikh 278,4100.9
Jediism 21,0000.1

The actual question asked: "What is this person's religion? Indicate a specific denomination or religion even if this person is not currently a practising member of that group.

For example, Roman Catholic, Ukrainian Catholic, United Church, Anglican, Lutheran, Baptist, Coptic Orthodox, Greek Orthodox, Jewish, Islam, Buddhist, Hindu, Sikh, etc."

Visible minorities

Visible minorityTotal responses% of Population
Chinese 1,029,3953.47
South Asian 917,0703.09
Black 662,2152.23
Filipino 308,5751.04
Others1,066,5903.60
Not a visible
minority
25,655,18586.56

Age

Population by age:

AgePopulation
0–4 years1,696,285
5–14 years4,029,255
15–19 years2,053,325
20–24 years1,955,810
25–44 years9,096,560
45–54 years4,419,290
55–64 years2,868,015
65–74 years2,142,835
75–84 years1,329,810
85 years and over415,910

Methodology

Every person was legally required to return the census questionnaire that required answering basic demographic information. In addition randomly selected people were legally required to complete a much more detailed questionnaire.

On May 15, 2001, Statistics Canada had thousands of canvassers who went around to try to ensure that the entire population was counted. For the first time, this included canvassers who went to homeless shelters to ensure that the homeless were included in the census.

In addition to a small number of individuals who refused to participate, some first nation communities refused to participate en masse and therefore some of the statistics are inaccurate. This is noted as footnotes in many of the affected results.

Effects of Census

The census numbers are the basis of the federal governments transfer payments to the provinces and therefore when a province loses population, its transfer payments are decreased.

In addition, the census numbers are one of the elements that Elections Canada uses to create the boundaries of federal ridings.

See also

Related Research Articles

Demographics of Canada overview about the demographics of Canada

Statistics Canada conducts a country-wide census that collects demographic data every five years on the first and sixth year of each decade. The 2016 Canadian Census enumerated a total population of 35,151,728, an increase of around 5.0 percent over the 2011 figure. Between 2011 and May 2016, Canada's population grew by 1.7 million people, with immigrants accounting for two-thirds of the increase. Between 1990 and 2008, the population increased by 5.6 million, equivalent to 20.4 percent overall growth. The main drivers of population growth are immigration and, to a lesser extent, natural growth.

Demographics of Quebec

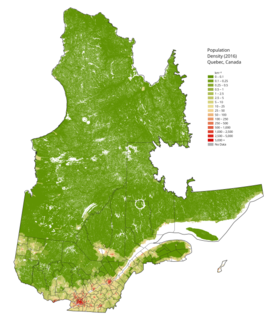
The demographics of Quebec constitutes a complex and sensitive issue, especially as it relates to the National question. Quebec is the only province in Canada to feature a francophone (French-speaking) majority, and where anglophones (English-speakers) constitute an officially recognized minority group. According to the 2011 census, French is spoken by more than 85.5% of the population while this number rises to 88% for children under 15 years old. According to the 2011 census, 95% of Quebec is francophone, with less than 5% of the population not able to speak French.

Population of Canada

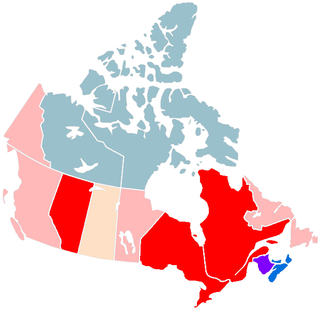
Canada ranks 38th by population, comprising about 0.5% of the world's total, with over 37 million Canadians as of 2019. Being, however, the fourth-largest country by land area, the vast majority of the country is sparsely inhabited, with most of its population south of the 55th parallel north and more than half of Canadians live in just two provinces: Ontario and Quebec. Though Canada's population density is low, many regions in the south such as the Quebec City–Windsor Corridor, have population densities higher than several European countries. Canada's largest population centres are Toronto, Montreal, Vancouver, Calgary, Edmonton and Ottawa with those six being the only ones with more than one million people. The large size of Canada's north which is not arable, and thus cannot support large human populations, significantly lowers the country's carrying capacity. Therefore, the population density of the habitable land in Canada can be modest to high depending on the region.

Given here are the ethnic origins of Canadian residents as recorded by them on their 2016 census form. The relevant census question asked for "the ethnic or cultural origins" of the respondent's ancestors and not the respondents themselves.

Calgary Metropolitan Region Metropolitan area in Alberta, Canada

The Calgary Metropolitan Region (CMR), also commonly referred to as the Calgary Region, is a conglomeration of municipalities centred on Calgary, the largest city in Alberta.

2006 Canadian Census detailed enumeration of the Canadian population; census day was May 16, 2006

The 2006 Canadian Census was a detailed enumeration of the Canadian population. Census day was May 16, 2006. The following census was the 2011 Census. Canada's total population enumerated by the 2006 census was 31,612,897. This count was lower than the official July 1, 2006 population estimate of 32,623,490 people.

South African National Census of 2001

The National Census of 2001 was the 2nd comprehensive national census of the Republic of South Africa, or Post-Apartheid South Africa. It undertook to enumerate every person present in South Africa on the census night between 9–10 October 2001 at a cost of R987,000,000.

The demographics of Metro Vancouver indicate a multicultural and multiracial region. Metro Vancouver is a metropolitan area, with its major urban centre being Vancouver, British Columbia, Canada. The Vancouver census metropolitan area, as defined by Statistics Canada, encompasses roughly the same territory as the Metro Vancouver Regional District, a regional district in British Columbia. The regional district includes 23 local authorities. Figures provided here are for the Vancouver census metropolitan area and not for the City of Vancouver.

Statistics Canada conducts a national census of population and census of agriculture every five years.

Demographics of Ontario

Ontario, one of the 13 provinces and territories of Canada, is located in east-central Canada. It is Canada's most populous province by a large margin, accounting for nearly 40 per cent of all Canadians, and is the second-largest province in total area. Ontario is fourth-largest in total area when the territories of the Northwest Territories and Nunavut are included. It is home to the nation's capital city, Ottawa, and the nation's most populous city, Toronto.

Demographics of Alberta

Alberta has experienced a relatively high rate of growth in recent years, due in large part to its economy. Between 2003 and 2004, the province saw high birthrates, relatively high immigration, and a high rate of interprovincial migration when compared to other provinces. Approximately 81% of the population live in urban areas and only about 19% live in rural areas. The Calgary–Edmonton Corridor is the most urbanized area in Alberta and is one of Canada's four most urban regions. Many of Alberta's cities and towns have also experienced high rates of growth in recent history. From a population of 73,022 in 1901, Alberta has grown to 3,645,257 in 2011 and in the process has gone from less than 1.5% of Canada's population to 10.9%. As of July 1, 2018, Alberta's population represented 11.6% of Canada's total population of 37,058,856 making it the fourth most populated province in Canada. According to the 2018 third quarter report, Alberta's population increased by 23,096 to 4,330,206, the largest increase since the 2014 economic downturn.

Demographics of Saskatchewan

Saskatchewan is the middle province of Canada's three Prairie Provinces. It has an area of 651,900 km² (251,700 mi²) and a population of 1,117,503 (Saskatchewanians) as of January 2014. Most of its population lives in the southern half of the province. The most populous city is Saskatoon with a population of 260,600 (2011) in the Census Metropolitan Area (CMA), followed by the province's capital, Regina with a population of 210,556 (2011) in the CMA. The province's population makeup is also notable for German being the largest European ethnic group and also for the largest proportion of people of indigenous descent of any of the provinces.

Demographics of Manitoba

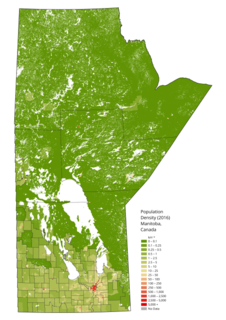
Manitoba is one of Canada's 10 provinces. It is the easternmost of the three Prairie provinces.

The 1996 Canadian Census was a detailed enumeration of the Canadian population. Census day was May 14, 1996. On that day, Statistics Canada attempted to count every person in Canada. The total population count of Canada was 28,846,761. This was a 5.7% increase over the 1991 Census of 27,296,859.

According to the 2011 census, the City of Edmonton had a population of 812,201 residents, compared to 3,645,257 for all of Alberta, Canada. The total population of the Edmonton census metropolitan area (CMA) was 1,159,869, making it the sixth-largest CMA in Canada, while Statistics Canada estimated the CMA's 2011 population to be 1,196,342. In 2014, a municipal census indicated the city had a population of 877,926.

2011 United Kingdom census 2011 census of the population of the United Kingdom

A census of the population of the United Kingdom is taken every ten years. The 2011 census was held in all countries of the UK on 27 March 2011. It was the first UK census which could be completed online via the Internet. The Office for National Statistics (ONS) is responsible for the census in England and Wales, the General Register Office for Scotland (GROS) is responsible for the census in Scotland, and the Northern Ireland Statistics and Research Agency (NISRA) is responsible for the census in Northern Ireland.

South African National Census of 2011 Comprehensive census performed by Statistics South Africa, the latest in a series

The South African National Census of 2011 is the 3rd comprehensive census performed by Statistics South Africa.

The demographics of Winnipeg reveal the city to be a typically Canadian one: multicultural and multilingual. Winnipeg is also prominent in the size and ratio of its First Nations population, which plays an important part in the city's makeup. About 11% of Winnipeggers are of First Nations descent, which vastly exceeds the national average of 4.3%.

The census in Malaysia, or officially, the Population and Housing Census, is a descriptive count of everyone who is in Malaysia on the Census Day, and of their dwellings. The decennial Malaysian census has been conducted six times, As of 2010. It has been conducted every 10 years, beginning in 1960.

References

  1. "2001 Census facts: did you know..." (PDF). Statistics Canada. 2006. Archived from the original (pdf) on 2011-07-06. Retrieved 2010-06-24.
  2. "Population estimates". Statistics Canada. 2006. Retrieved 2010-06-24.
  3. 1 2 not included elsewhere