Demographics of Maldives

Last updated

Demographics of Maldives
Maldives single age population pyramid 2020.png
Population pyramid of the Maldives in 2020
Population515,122 (2022) [1]
Growth rate-0.14% (2022)
Birth rate15.54 births/1,000 population (2022)
Death rate4.15 deaths/1,000 population (2022)
Life expectancy76.94 years
  male74.57 years
  female79.42 years
Fertility rate1.71 children born/woman (2022 est.)
Infant mortality rate25.7 deaths/1,000 live births
Net migration rate-12.78 migrant(s)/1,000 population (2022 est.)
Age structure
0–14 years19.72%
15–64 years76.94%
65 and over3.34%
Nationality
NationalityMaldivian

This is a demography of the population of Maldives, including population density, ethnicity, education level, health of the populace, economic status, religious affiliations and other aspects of the population.

Contents

Demographics of the Maldives, from 2000 to 2012 Population estimates of Maldives.png
Demographics of the Maldives, from 2000 to 2012
Population by locality (2012) Largest cities or towns of Maldives (2012).png
Population by locality (2012)

Vital statistics

UN estimates

Period [2] Live births per yearDeaths per yearNatural change per yearCBR1CDR1NC1TFR1IMR1
1950-19553 0002 0001 00043.227.715.56.03233.4
1955-19604 0002 0002 00053.028.224.86.81221.6
1960-19655 0003 0003 00055.027.227.97.12205.5
1965-19706 0003 0003 00052.223.428.87.22175.5
1970-19756 0002 0004 00047.419.328.17.17146.5
1975-19806 0002 0004 00044.115.728.36.86121.5
1980-19858 0002 0006 00047.812.735.17.2697.2
1985-19909 0002 0007 00045.410.534.86.8177.1
1990-19958 0002 0006 00035.68.027.65.2562.5
1995-20007 0001 0005 00025.15.519.63.5241.7
2000-20056 0001 0004 00019.74.115.62.4926.5
2005-20105 0001 0004 00017.23.713.51.909.8
1CBR = crude birth rate (per 1000); CDR = crude death rate (per 1000); NC = natural change (per 1000); TFR = total fertility rate (number of children per woman); IMR = infant mortality rate per 1000 births

Registered births and deaths

[3] Average estimated populationLive birthsDeathsNatural changeCrude birth rate (per 1000)Crude death rate (per 1000)Natural change (per 1000)TFR
1980157,0006,8221,7875,03543.611.432.1
1981162,0007,0101,9635,04743.312.131.2
1982168,0007,4022,1295,27344.112.731.4
1983174,0007,2361,7485,48841.610.131.6
1984180,0008,2551,6406,61545.89.136.7
1985187,0008,9681,6077,36148.08.639.4
1986193,0008,6151,5117,10444.67.836.8
1987200,0008,3641,5256,83941.87.634.2
1988207,0008,2971,5266,77140.27.432.8
1989213,0008,7261,4767,25041.06.934.0
1990219,0008,6391,3557,28439.46.233.2
1991226,0008,3901,3667,02437.26.131.1
1992232,0008,1391,3306,80935.15.729.4
1993238,0007,7801,3196,46132.75.627.2
1994243,0007,3821,2406,14230.35.125.2
1995249,0006,8491,1515,69827.54.622.9
1996254,0006,7721,2135,55926.74.821.9
1997259,0006,1841,1755,00923.94.519.3
1998264,0005,6871,1214,56621.64.217.3
1999269,0005,2251,0374,18819.53.915.6
2000273,0005,3991,0324,36719.83.816.0
2001278,0004,8971,0813,81617.63.913.7
2002282,0005,0031,1133,89017.73.913.8
2003287,0005,1571,0304,12718.03.614.4
2004291,0005,2201,0154,20517.93.514.5
2005295,0005,5431,0274,51618.83.515.3
2006300,0005,8291,0834,74619.53.615.9
2007305,0006,5691,1185,45121.63.718.0
2008310,0006,9461,0615,88522.63.419.1
2009315,0007,4231,1636,26023.63.719.92.400
2010320,0007,1151,1056,01022.33.518.82.263
2011325,0007,1801,1376,04322.13.518.62.239
2012331,0007,4311,1356,29622.53.419.02.259
2013336,0007,1531,1206,03321.33.318.02.133
2014437,5357,2451,1436,10216.62.614.02.007
2015454,4346,8961,1305,76615.22.512.71.907
2016472,4266,7561,2265,53014.32.611.71.805
2017491,5896,7231,2415,48213.72.511.21.718
2018512,0386,5861,3005,28612.92.510.41.651
2019533,9416,1531,1325,02111.52.19.41.557
2020557,4266,2931,2755,01811.32.39.01.572
2021568,3625,9141,5524,36210.42.77.7

Structure of the population

Population by Sex and Age Group (Census 21.III.2006) (Total population is taken as de facto and de jure together.): [4]
Age GroupMaleFemaleTotal%
Total151 459147 509298 968100
0-413 36212 80926 1718.75
5-915 35214 51529 8679.99
10-1419 11117 88836 99912.38
15-1920 15519 74939 90413.35
20-2416 93317 87634 80911.64
25-2911 91512 66624 5818.22
30-3410 02210 61320 6356.90
35-398 7809 39418 1746.08
40-447 8288 04315 8715.31
45-496 8726 69713 5694.54
50-544 1473 7897 9362.65
55-593 0462 8135 8591.96
60-642 8522 7145 5661.86
65-693 0142 6645 6781.90
70-742 3331 8534 1861.40
75-791 4449332 3770.80
80-846174471 0640.36
85-892411553960.13
90-9489701590.05
95+5232840.03
unknown3 2941 7895 0831.70
Age groupMaleFemaleTotalPercent
0-1447 82545 21293 03731.12
15-6492 55094 354186 90462.52
65+7 7906 15413 9444.66
Population Estimates by Sex and Age Group (01.VII.2013) :
Age GroupMaleFemaleTotal%
Total169 800166 424336 224100
0-416 71416 42933 1439.86
5-913 82613 31827 1448.07
10-1414 49813 67128 1698.38
15-1918 15316 79534 94810.39
20-2420 74319 64040 38312.01
25-2919 09119 40138 49211.45
30-3414 05414 82828 8828.59
35-3910 76111 26322 0246.55
40-449 4099 93519 3445.75
45-498 2708 58716 8575.01
50-547 4217 34014 7614.39
55-595 1054 7999 9042.95
60-643 1182 8846 0021.79
65-692 5422 4955 0371.50
70-742 4302 3384 7681.42
75-791 9711 6483 6191.08
80+1 6931 0542 7470.82
Age groupMaleFemaleTotalPercent
0-1445 03843 41888 45626.31
15-64116 126115 471231 59768.88
65+8 6367 53516 1714.81
Population Estimates by Sex and Age Group (01.VII.2020) (Based on the results of the 2014 Population Census. Data refer to resident population which includes resident Maldivians and resident foreigners.): [5]
Age GroupMaleFemaleTotal%
Total356 149201 277557 426100
0–420 61218 79839 4117.07
5–919 34517 24236 5876.56
10–1417 44616 49533 9416.09
15–1917 35413 03230 3865.45
20–2448 24216 76365 00511.66
25–2965 93521 38787 32215.67
30–3451 58322 36673 94913.27
35–3936 84419 01655 85910.02
40–4424 83813 36538 2036.85
45–4917 12410 95028 0745.04
50–5411 9399 18721 1263.79
55–598 7547 75416 5082.96
60–646 4506 00812 4582.23
65-693 3512 9586 3091.13
70-742 2322 2004 4320.80
75-791 8321 8483 6800.66
80+2 2691 9084 1770.75
Age groupMaleFemaleTotalPercent
0–1457 40352 535109 93819.72
15–64289 062139 828428 89076.94
65+9 6848 91418 5983.34

Fertility Rate (The Demographic Health Survey)

Fertility Rate (TFR) (Wanted Fertility Rate) and CBR (Crude Birth Rate): [6]

YearCBR (Total)TFR (Total)CBR (Urban)TFR (Urban)CBR (Rural)TFR (Rural)
200924.72.5 (2.2)22.92.1 (1.9)25.52.8 (2.4)
2016-1722.02.1 (1.9)19.91.8 (1.5)23.02.5 (2.2)

Geographical differences

The total fertility rate differs greatly from as low as 2.05 children per woman in Malé to a maximum of 3.88 children in Faafu.

Code NameOfficial NamePopulation
(2014 census) [7]
Reg. Population
(31 December 2018) [8]
TFR (2014 census) [9]
Malé Malé City 133,41264,7422.05
Haa Alif Thiladhunmathi Uthuruburi13,00422,7612.91
Haa Dhaalu Thiladhunmathi Dhekunuburi18,57027,2592.91
Shaviyani Miladhunmadulu Uthuruburi12,12718,2742.66
Noonu Miladhunmadulu Dhekunuburi10,55616,7892.83
Raa Maalhosmadulu Uthuruburi14,93423,7212.93
Baa Maalhosmadulu Dhekunuburi8,91914,6242.45
Lhaviyani Faadhippolhu7,99613,2382.59
Kaafu Malé Atholhu12,23212,0362.70
Alif Alif Ari Atholhu Uthuruburi5,9157,6142.94
Alif Dhaal Ari Atholhu Dhekunuburi8,18311,4393.30
Vaavu Felidhu Atholhu1,6222,5992.34
Meemu Mulak Atholhu4,7117,4152.75
Faafu Nilandhe Atholhu Uthuruburi4,1406,2643.88
Dhaalu Nilandhe Atholhu Dhekunuburi5,3297,9322.62
Thaa Kolhumadulu8,92316,1612.97
Laamu Haddhunmathi11,84116,9772.67
Gaafu Alif Huvadhu Atholhu Uthuruburi8,47714,0572.80
Gaafu Dhaalu Huvadhu Atholhu Dhekunuburi11,65321,0963.13
Gnaviyani Fuvahmulah City 8,09513,0372.76
Addu City Addu City 19,82733,8762.49
MaldivesRepublic of Maldives344,023374,7752.46

Life expectancy at birth

Life expectancy at birth in the Maldives Life expectancy by WBG -Maldives -diff.png
Life expectancy at birth in the Maldives
PeriodLife expectancy in

Years

PeriodLife expectancy in

Years

1950–195534.51985–199059.3
1955–196036.11990–199563.5
1960–196539.01995–200067.6
1965–197042.42000–200572.2
1970–197546.22005–201075.6
1975–198050.72010–201576.3
1980–198555.5

Source: UN World Population Prospects [10]

Ethnic groups

The largest ethnic group is Dhivehin, native to the historic region of the Maldive Islands comprising today's Republic of Maldives and the island of Minicoy in Union territory of Lakshadweep, India. They share the same culture and speak the Dhivehi language. They are principally an Indo-Aryan people, closely related to the Sinhalese and having traces of Middle Eastern, South Asian, Austronesian and African genes in the population.

In the past there was also a small Tamil population known as the Giraavaru people. This group have now been almost completely absorbed into the larger Maldivian society but were once native to the island of Giraavaru (Kaafu Atoll). This island was evacuated in 1968 due to heavy erosion of the island.

Filipinos in the Maldives numbering 3,000 in 2018.

Languages

Dhivehi, an Indo-Aryan language closely related to the Sinhala language of Sri Lanka, and written in a specialized Arabic script (Thaana), is the official language and is spoken by virtually the whole population. English is also spoken as a second language by many.

Religion

Sunni Islam is the state religion. Historically, the Maldives were converted to Islam from Buddhism in the 12th century. Under the 2008 constitution Islam is the official religion of the entire population, as adherence to it is required for citizenship.

CIA World Factbook demographic statistics

The following demographic statistics are from the CIA World Factbook, unless otherwise indicated.

Population

301,475 (July 2000 est.) - 369,031 (July 2007 est.) [11]

Age structure

Sex ratio

Nationality

Literacy

Education

The average Maldivian citizen has 4.7 years of education [12]

Related Research Articles

<span class="mw-page-title-main">Demographics of Burundi</span>

Demographic features of the population of Burundi include population density, ethnicity, education level, health of the populace, economic status, religious affiliations and other aspects.

<span class="mw-page-title-main">Demographics of Cambodia</span> Population analysis

Demographic features of the population of Cambodia include population density, ethnicity, education level, health of the populace, economic status, religious affiliations and other aspects of the population.

<span class="mw-page-title-main">Demographics of Cameroon</span>

The demographic profile of Cameroon is complex for a country of its population. Cameroon comprises an estimated 250 distinct ethnic groups, which may be formed into five large regional-cultural divisions:

<span class="mw-page-title-main">Demographics of Cape Verde</span>

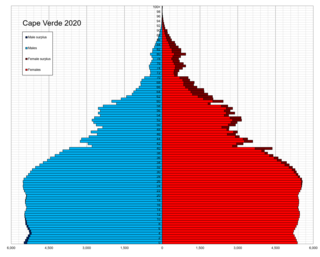
Demographic features of the population of Cape Verde include population density, ethnicity, education level, health of the populace, economic status, religious affiliations and other aspects of the population.

<span class="mw-page-title-main">Demographics of Ivory Coast</span>

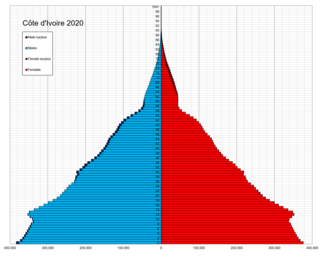
Demographic features of the population of Ivory Coast include population density, ethnicity, education level, health of the populace, economic status, religious affiliations and other aspects of the population.

<span class="mw-page-title-main">Demographics of Eritrea</span>

Sources disagree as to the current population of Eritrea, with some proposing numbers as low as 3.6 million and others as high as 6.7 million. Eritrea has never conducted an official government census.

<span class="mw-page-title-main">Demographics of India</span>

India is the most populous country in the world with one-sixth of the world's population. According to UN estimates, India overtook China in having the largest population in the world with a population of 1,425,775,850 at the end of April 2023.

<span class="mw-page-title-main">Demographics of Indonesia</span>

The population of Indonesia was 270.20 million according to the 2020 national census, an increase from 237.64 million in 2010. Indonesia is the fourth most populous country in the world. Approximately 55% of Indonesia's population resides on Java, which is the most populous island in the world.

<span class="mw-page-title-main">Demographics of Jamaica</span>

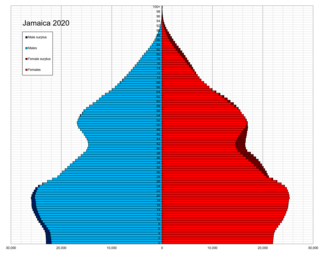
Jamaica is an island country in the Caribbean. The country had a population of 2,825,352 in 2023, the fourth largest in the region.

<span class="mw-page-title-main">Demographics of Laos</span>

Laos is a country in Southeast Asia. The country's population was estimated at about 7.43 million in 2021, dispersed unevenly across the country. Most people live in valleys of the Mekong River and its tributaries. Vientiane Prefecture, which includes Vientiane, the capital and largest city of the country, had 820,924 residents as of the 2015 census. The country's population density is 26.7/km2.

<span class="mw-page-title-main">Demographics of Lesotho</span>

Demographic features of the population of Lesotho include population density, ethnicity, education level, health of the populace, economic status, religious affiliations and other aspects.

<span class="mw-page-title-main">Demographics of Namibia</span>

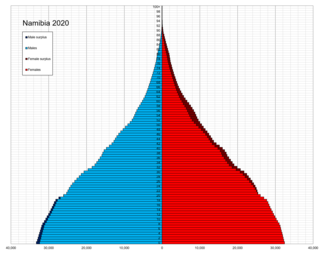
This is a demography of the population of Namibia including population density, ethnicity, education level, health of the populace, economic status, religious affiliations and other aspects of the population.

<span class="mw-page-title-main">Demographics of Nepal</span>

The current population of Nepal is 29,164,578 as per the 2021 census. The population growth rate is 0.92% per year.

<span class="mw-page-title-main">Demographics of Samoa</span> Demographics of country

Demographic features of the population of Samoa include population density, ethnicity, education level, health of the populace, economic status, religious affiliations and other aspects of the population.

<span class="mw-page-title-main">Demographics of Sri Lanka</span>

This is a demography of the population of Sri Lanka including population density, ethnicity, education level, health of the populace, economic status, religious affiliations and other aspects of the population.

<span class="mw-page-title-main">Demographics of Tanzania</span>

Demographic features of the population of Tanzania include population density, ethnicity, education level, health of the populace, economic status, religious affiliations, and other aspects of the population.

<span class="mw-page-title-main">Demographics of Venezuela</span>

Venezuela is a country in South America. The Venezuelan people comprise a combination of heritages, primarily Native American and European. The historically present Native American, Spanish colonists, and African slaves have all contributed to varying degrees. Later, waves of European groups migrated to Venezuela in the 20th century, influencing many aspects of Venezuelan life, including its culture, language, food, and music though small in number.

<span class="mw-page-title-main">Demographics of Uganda</span> Aspect of human geography in Uganda

Demographic features of the population of Uganda include population density, ethnicity, education level, health of the populace, economic status, religious affiliations and others.

<span class="mw-page-title-main">Demographics of the Gambia</span> Demographics of the West African country

The demographic characteristics of the population of The Gambia are known through national censuses, conducted in ten-year intervals and analyzed by The Gambian Bureau of Statistics (GBOS) since 1963. The latest census was conducted in 2013. The population of The Gambia at the 2013 census was 1.8 million. The population density is 176.1 per square kilometer, and the overall life expectancy in The Gambia is 64.1 years. Since the first census of 1963, the population of The Gambia has increased every ten years by an average of 43.2 percent. Since 1950s, the birth rate has constantly exceeded the death rate; the natural growth rate is positive. The Gambia is in the second stage of demographic transition. In terms of age structure, The Gambia is dominated by 15- to 24-year-old segment (57.6%). The median age of the population is 19.9 years, and the gender ratio of the total population is 0.98 males per female.

<span class="mw-page-title-main">Demographics of Brunei</span>

The demographic features of Brunei include population density, ethnicity, education level, health of the populace, economic status, religious affiliations and other aspects of the population. Like neighbouring countries, Brunei is a Malay-majority country. Many cultural and linguistic differences make Brunei Malays distinct from the larger Malay populations in nearby Malaysia and Indonesia, even though they are ethnically related and share the Muslim religion.

References

  1. "Maldives Population census (2022) - Maldives Bureau of Statistics".
  2. World Population Prospects: The 2010 Revision Archived 6 May 2011 at the Wayback Machine
  3. "Department of National Planning, Republic of Maldives - Offline". planning.gov.mv. Archived from the original on 2 October 2017. Retrieved 26 April 2018.
  4. "United Nations Statistics Division - Demographic and Social Statistics". Archived from the original on 27 December 2016. Retrieved 20 December 2016.
  5. "UNSD — Demographic and Social Statistics".
  6. "The DHS Program - Quality information to plan, monitor and improve population, health, and nutrition programs". dhsprogram.com. Archived from the original on 7 May 2015. Retrieved 26 April 2018.
  7. "Total Maldivian Population by Islands, Census 2014 and Registered Population 2018" (PDF).
  8. "Total Maldivian Population by Islands, Census 2014 and Registered Population 2018" (PDF).
  9. Maldives Population Projections 2014-2054
  10. "World Population Prospects – Population Division – United Nations" . Retrieved 15 July 2017.
  11. "The World Factbook". Cia.gov. Retrieved 10 July 2013.
  12. Neil Merret (30 November 2010). "Average Maldivian citizen has 4.7 years of education, finds UN Human Development Report". Minivan News. Retrieved 7 January 2011.

Further reading