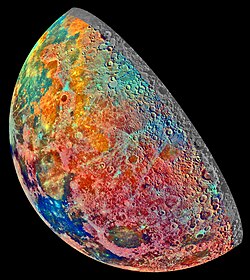
A mosaic constructed from a series of 53 images taken through three spectral filters by Galileo's imaging system as it flew over the northern regions of the Moon in December 1992.A false-color image from the Meteor M2-2 satellite's imager MSU-MR. The image was received by an amateur radio station and is derived from the HRPT data.
False colors and pseudo colors respectively refers to a group of colorrendering methods used to display images in colors which were recorded in the visible or non-visible parts of the electromagnetic spectrum. A false-color image is an image that depicts an object in colors that differ from those a photograph (a true-color image) would show. In this image, colors have been assigned to three different wavelengths that human eyes cannot normally see.
In addition, variants of false colors such as pseudocolors, density slicing, and choropleths are used for information visualization of either data gathered by a single grayscale channel or data not depicting parts of the electromagnetic spectrum (e.g. elevation in relief maps or tissue types in magnetic resonance imaging).
Types of color renderings
True color
The concept behind true color can help in understanding false color. An image is called a true-color image when it offers a natural color rendition, or when it comes close to it. This means that the colors of an object in an image appear to a human observer the same way as if this same observer were to directly view the object: A green tree appears green in the image, a red apple red, a blue sky blue, and so on.[1]
This true-color image shows the area in actual colors, e.g., the vegetation appears in green. It covers the full visible spectrum using the red, green and blue / green spectral bands of the satellite mapped to the RGB color space of the image.
The same area as a false-color image using the near infrared, red and green spectral bands mapped to RGB – this image shows vegetation in a red tone, as vegetation reflects most light in the near infrared.
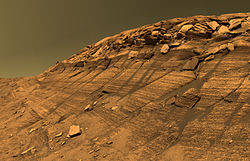
Burns Cliff inside of Endurance crater on Mars. The color is approximate true color because, instead of the red spectral band, infrared was used. The result is a metameric failure in the color of the sky, which is slightly green in the image – had a human observer been present, then that person would have perceived the actual sky color to have a bit more orange in it. The Opportunity rover which captured this image does have a red filter, but it is often not used, due to the higher scientific value of images captured using the infrared band and the constraints of data transmission.
Absolute true-color rendering is impossible.[3] There are three major sources of color error (metameric failure):
The result of a metameric failure would be for example an image of a green tree which shows a different shade of green than the tree itself, a different shade of red for a red apple, a different shade of blue for the blue sky, and so on. Color management (e.g. with ICC profiles) can be used to mitigate this problem within the physical constraints.
Approximate true-color images gathered by spacecraft are an example where images have a certain amount of metameric failure, as the spectral bands of a spacecraft's camera are chosen to gather information on the physical properties of the object under investigation, and are not chosen to capture true-color images.[3]
This approximate true-color panorama shows the impact crater Endurance on Mars. It was taken by the panoramic camera on the Opportunity rover and is a composite of a total of 258 images taken in the 480, 530 and 750 nanometer spectral bands (blue / green, green and near infrared).
False color
A traditional false-color satellite image of Las Vegas. Grass-covered land (e.g. a golf course) appears in red.
In contrast to a true-color image, a false-color image sacrifices natural color rendition in order to ease the detection of features that are not readily discernible otherwise – for example the use of near infrared for the detection of vegetation in satellite images.[1] While a false-color image can be created using solely the visual spectrum (e.g. to accentuate color differences), typically some or all data used is from electromagnetic radiation (EM) outside the visual spectrum (e.g. infrared, ultraviolet or X-ray). The choice of spectral bands is governed by the physical properties of the object under investigation.
As the human eye uses three spectral bands (see trichromacy for details), three spectral bands are commonly combined into a false-color image. At least two spectral bands are needed for a false-color encoding,[4] and it is possible to combine more bands into the three visual RGB bands – with the eye's ability to discern three channels being the limiting factor.[5] In contrast, a "color" image made from one spectral band, or an image made from data consisting of non-EM data (e.g. elevation, temperature, tissue type) is a pseudocolor image (see below).
For true color, the RGB channels (red "R", green "G" and blue "B") from the camera are mapped to the corresponding RGB channels of the image, yielding a "RGB→RGB" mapping. For false color this relationship is changed. The simplest false-color encoding is to take an RGB image in the visible spectrum, but map it differently, e.g. "GBR→RGB". For traditional false-color satellite images of Earth a "NRG→RGB" mapping is used, with "N" being the near-infrared spectral band (and the blue spectral band being unused) – this yields the typical "vegetation in red" false-color images.[1][6]
These three false-color images demonstrate the application of remote sensing in precision agriculture: The left image shows vegetation density and the middle image presence of water (greens / blue for wet soil and red for dry soil). The right image shows where crops are under stress, as is particularly the case in fields 120 and 119 (indicated by red and yellow pixels). These fields were due to be irrigated the following day.
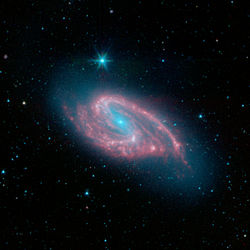
This false-color composite image of the spiral galaxy Messier 66 is combining four infrared spectral bands from 3.6 to 8.0 micrometers. The contribution from starlight (measured at 3.6 micrometers) has been subtracted from the 5.8 and 8 micrometer band to enhance the visibility of the polycyclic aromatic hydrocarbon emissions.
This iconic picture of the Eagle Nebula is false-color, as can be inferred from the pink stars. Three pictures were taken by the Hubble Space Telescope, the first picking up light in the frequency of sulfur ions (arbitrarily assigned to the color red), the second hydrogen (green), and the third oxygen ions (blue). The actual color of the nebula is unknown, but if viewed at a distance making the 1-light-year-long "pillars" similarly visible, it would probably appear as a nearly uniform brownish grey to human eyes.
False color has a range of scientific applications. Spacecraft often employ false-color methods to help understand the composition of structures in the universe such as nebula and galaxies.[7] The frequency of light emitted by different ions in space are assigned contrasting colors, allowing the chemical composition of complex structures to be better separated and visualised. The image of the Eagle Nebula above is a typical example of this; the Hydrogen and Oxygen ions have been assigned green and blue respectively. The large amounts of green and blue in the image show that there is a large amount of Hydrogen and Oxygen in the nebula.
On 26 October 2004, the NASA/ESA Cassini-Huygens spacecraft captured a false-color image of Titan, Saturn's largest moon.[8] The image was captured in Ultraviolet and Infrared wavelengths, both invisible to the human eye.[9] In order to provide a visual representation, false color techniques were used. The infrared data was mapped to red and green colors, and ultraviolet mapped to blue.[10]
Pseudocolor
A pseudocolor image (sometimes styled pseudo-color or pseudo color) is derived from a grayscale image by mapping each intensity value to a color according to a table or function.[11] Pseudo color is typically used when a single channel of data is available (e.g. temperature, elevation, soil composition, tissue type, and so on), in contrast to false color which is commonly used to display three channels of data.[4]
Pseudocoloring can make some details more visible, as the perceived difference in color space is bigger than between successive gray levels alone. On the other hand, the color mapping function should be chosen to make sure the lightness of the color is still monotonic, or the uneven change would make it hard to interpret levels, for both normal and colorblind viewers. One offender is the commonly used "rainbow" palette, with a back-and-forth change in lightness. (See also Choropleth map §Color progression.)[12]
A typical example for the use of pseudo color is thermography (thermal imaging), where infrared cameras feature only one spectral band and show their grayscale images in pseudo color.
Examples of encoding temperature with pseudo color:
Thermogram of a passive house in the foreground and a traditional building in the background. There is a color to temperature key on the right.
Thermal image of a steam locomotive using pseudocolor encoding – yellow/white indicates hot and red/violet indicates cool.
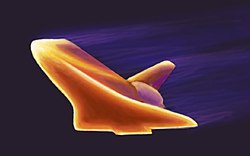
This pseudocolor image shows the results of a computer simulation of temperatures during Space Shuttle reentry. Areas reaching 3,000 °F (1,650 °C) can be seen in yellow.
Another familiar example of pseudo color is the encoding of elevation using hypsometric tints in physical relief maps, where negative values (below sea level) are usually represented by shades of blue, and positive values by greens and browns.
Examples of encoding elevation with pseudo color:
An elevation map of the Pacific Ocean, showing ocean floor in shades of blue and land in greens and browns.
This color-coded elevation relief map indicates the result of floods on Mars. There is a color to elevation key on the bottom.
The Moon with hypsometric tints of red for the highest points and purple for the lowest.
Depending on the table or function used and the choice of data sources, pseudocoloring may increase the information contents of the original image, for example adding geographic information, combining information obtained from infrared or ultra-violet light, or other sources like MRI scans.[13]
Examples of overlaying additional information with pseudo color:
This image shows compositional variations of the Moon overlaid as pseudo color.
A grayscale MRI of a knee – different gray levels indicate different tissue types, requiring a trained eye.
A pseudocolor MRI of a knee created using three different grayscale scans – tissue types are easier to discern through pseudo color.
A further application of pseudocoloring is to store the results of image elaboration; that is, changing the colors in order to ease understanding an image.[14]
Density slicing
An image of Tasmania and surrounding waters using density slicing to show phytoplankton concentration. The ocean color as captured by the satellite image is mapped to seven colors: Yellow, orange and red indicate more phytoplankton, while light green, dark green, light blue and dark blue indicate less phytoplankton; land and clouds are depicted in different colors.
Density slicing, a variation of pseudo color, divides an image into a few colored bands and is (among others) used in the analysis of remote sensing images.[15] For density slicing the range of grayscale levels is divided into intervals, with each interval assigned to one of a few discrete colors – this is in contrast to pseudo color, which uses a continuous color scale.[16] For example, in a grayscale thermal image the temperature values in the image can be split into bands of 2°C, and each band represented by one color – as a result the temperature of one spot in the thermograph can be easier acquired by the user, because the discernible differences between the discrete colors are greater than those of images with continuous grayscale or continuous pseudo color.
A choropleth is an image or map in which areas are colored or patterned proportionally to the category or value of one or more variables being represented. The variables are mapped to a few colors; each area contributes one data point and receives one color from these selected colors. Basically, it is density slicing applied to a pseudocolor overlay. A choropleth map of a geographic area is thus an extreme form of false color.
False color in the arts
This section needs expansion. You can help by adding to it. (August 2012)
While artistic rendition lends to subjective expression of color, Andy Warhol (1928–1987) has become a culturally significant figure of the modern art movement by creating false-color paintings with screen printing techniques. Some of Warhol's most recognizable prints include a replication of Marilyn Monroe, her image based on a film frame from the movie Niagara. The subject was a sex symbol and film noir starlet whose death in 1962 influenced the artist. A series of prints were made with endearment but expose her persona as an illusion through his assembly line style of art production which are non-erotic and slightly grotesque.[17] Using various ink color palettes, Warhol immersed himself in a process of repetition that serves to compare personas and everyday objects to the qualities of mass production and consumerism.[18] The colors of ink were selected through experimentation of aesthetics and do not correlate to false-color rendering of the electromagnetic spectrum employed in remote sensing image processing. For years the artist continued screen printing false-color images of Marilyn Monroe, perhaps his most referenced work being Turquoise Marilyn[19] which was bought in May 2007 by a private collector for 80 million US dollars.[20]
↑ GDSC, Nationaal Lucht- en Ruimtevaartlaboratorium (National Laboratory of Air and Space Transport), Netherlands. "Band combinations". GDSC, Nationaal Lucht- en Ruimtevaartlaboratorium (National Laboratory of Air and Space Transport), Netherlands. Archived from the original on 17 August 2012.{{cite web}}: CS1 maint: multiple names: authors list (link)
↑ Setchell, C. J.; Campbell, N. W. (July 1999). "Using colour Gabor texture features for scene understanding". 7th International Conference on Image Processing and its Applications. Vol.1999. pp.372–376. doi:10.1049/cp:19990346. ISBN0-85296-717-9. S2CID15972743.
This page is based on this Wikipedia article Text is available under the CC BY-SA 4.0 license; additional terms may apply. Images, videos and audio are available under their respective licenses.