Richland County, North Dakota

Last updated

Richland County
Richland County Courthouse Wahpeton.jpg
RichlandCountyNDlogo.png
Map of North Dakota highlighting Richland County.svg
Location within the U.S. state of North Dakota
North Dakota in United States.svg
North Dakota's location within the U.S.
Coordinates: 46°15′55″N96°56′17″W / 46.265219°N 96.93796°W / 46.265219; -96.93796
CountryFlag of the United States.svg United States
StateFlag of North Dakota.svg North Dakota
FoundedJanuary 4, 1873 (created)
November 25, 1873 (organized)
Named after Morgan T. Rich
Seat Wahpeton
Largest cityWahpeton
Area
  Total
1,445.340 sq mi (3,743.41 km2)
  Land1,435.674 sq mi (3,718.38 km2)
  Water9.666 sq mi (25.03 km2)  0.67%
Population
 (2020)
  Total
16,529
  Estimate 
(2024)
16,658 Increase2.svg
  Density11.603/sq mi (4.480/km2)
Time zone UTC−6 (Central)
  Summer (DST) UTC−5 (CDT)
Area code 701
Congressional district At-large
Website co.richland.nd.us

Richland County is a county in the far southeast corner of the U.S. state of North Dakota. As of the 2020 census, the population was 16,529, [1] and was estimated to be 16,658 in 2024. [2] The county seat and the largest city is Wahpeton. [3]

Contents

Richland County is part of the Wahpeton, ND–MN Micropolitan Statistical Area, which is also included in the Fargo-Wahpeton, ND-MN Combined Statistical Area.

History

The Dakota Territory legislature created the county on January 4, 1873, with area partitioned from Pembina County. It was named for Morgan T. Rich, who settled on the site of the future Wahpeton in 1869. The county organization was completed on November 25 of that same year. Its boundaries were altered in 1883 and 1885. It has maintained its present configuration since 1885. [4] [5]

In 2022, strong winds known as a derecho, more than 70 mph, produced 34 tornadoes, including one that passed through Richland County near LeMars. [6]

Outline map of Richland County, North Dakota, 1897 Map of Richland County, N.D., 1897.jpg
Outline map of Richland County, North Dakota, 1897

Geography

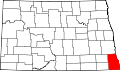
Richland County lies at the southeastern corner of North Dakota. Its eastern boundary line abuts the western boundary line of the state of Minnesota (across the Red River), and its southern boundary line abuts the northern boundary line of the state of South Dakota. The Red River flows northerly along its eastern boundary line on its way to the Hudson Bay. The Wild Rice River flows easterly and then northerly through the county, discharging into the Red River north of Richland County, in Cass County. The Sheyenne River flows northeasterly through the NW corner of the county, also discharging into the Red in Cass County.

The Richland County terrain is primarily flat, with rolling hills in the southwest and northwest. It is largely devoted to agriculture. [7] The terrain slopes to the north and east, with its highest point near its SW corner, at 1,220 ft (370 m) ASL. [8]

According to the United States Census Bureau, the county has a total area of 1,445.340 square miles (3,743.41 km2), of which 1,435.674 square miles (3,718.38 km2) is land and 9.666 square miles (25.03 km2) (0.67%) is water. [9] It is the 18th largest county in North Dakota by total area. [10]

Major highways

Adjacent counties

National protected area

Lakes [7]

  • Bisek Lake
  • Grass Lake
  • Gullys Slough
  • Kreiser Lake
  • Lueck Lake
  • Moran Lake
  • Park Lake
  • Silver Lake
  • Stacks Slough
  • Swan Lake
  • Willows Pond
  • Lake Elsie

Demographics

Historical population
CensusPop.Note
1880 3,597
1890 10,751198.9%
1900 17,38761.7%
1910 19,65913.1%
1920 20,8876.2%
1930 21,0080.6%
1940 20,519−2.3%
1950 19,865−3.2%
1960 18,824−5.2%
1970 18,089−3.9%
1980 19,2076.2%
1990 18,148−5.5%
2000 17,998−0.8%
2010 16,321−9.3%
2020 16,5291.3%
2024 (est.)16,658 [11] 0.8%
U.S. Decennial Census [12]
1790–1960 [13] 1900–1990 [14]
1990–2000 [15] 2010–2020 [2]

As of the fourth quarter of 2024, the median home value in Richland County was $188,177. [16]

As of the 2023 American Community Survey, there are 6,764 estimated households in Richland County with an average of 2.24 persons per household. The county has a median household income of $72,524. Approximately 10.9% of the county's population lives at or below the poverty line. Richland County has an estimated 65.3% employment rate, with 25.0% of the population holding a bachelor's degree or higher and 94.9% holding a high school diploma. [2]

The top five reported ancestries (people were allowed to report up to two ancestries, thus the figures will generally add to more than 100%) were English (97.7%), Spanish (1.0%), Indo-European (0.9%), Asian and Pacific Islander (0.2%), and Other (0.2%).

The median age in the county was 38.0 years.

Richland County, North Dakota – racial and ethnic composition
Note: the US Census treats Hispanic/Latino as an ethnic category. This table excludes Latinos from the racial categories and assigns them to a separate category. Hispanics/Latinos may be of any race.

Race / ethnicity (NH = non-Hispanic)Pop. 1980 [17] Pop. 1990 [18] Pop. 2000 [19] Pop. 2010 [20] Pop. 2020 [21]
White alone (NH)18,832
(98.05%)
17,595
(96.95%)
17,337
(96.33%)
15,351
(94.06%)
14,703
(88.95%)
Black or African American alone (NH)9
(0.05%)
21
(0.12%)
62
(0.34%)
110
(0.67%)
155
(0.94%)
Native American or Alaska Native alone (NH)249
(1.30%)
400
(2.20%)
297
(1.65%)
302
(1.85%)
433
(2.62%)
Asian alone (NH)21
(0.11%)
82
(0.45%)
44
(0.24%)
88
(0.54%)
123
(0.74%)
Pacific Islander alone (NH)6
(0.03%)
7
(0.04%)
19
(0.11%)
Other race alone (NH)28
(0.15%)
4
(0.02%)
3
(0.02%)
10
(0.06%)
23
(0.14%)
Mixed race or multiracial (NH)126
(0.70%)
182
(1.12%)
499
(3.02%)
Hispanic or Latino (any race)68
(0.35%)
46
(0.25%)
123
(0.68%)
271
(1.66%)
574
(3.47%)
Total19,207
(100.00%)
18,148
(100.00%)
17,998
(100.00%)
16,321
(100.00%)
16,529
(100.00%)

2024 estimate

As of the 2024 estimate, there were 16,658 people and 6,764 households residing in the county. There were 7,620 housing units at an average density of 5.31 per square mile (2.1/km2). The racial makeup of the county was 92.8% White (90.0% NH White), 1.3% African American, 3.1% Native American, 0.6% Asian, 0.1% Pacific Islander, _% from some other races and 2.1% from two or more races. Hispanic or Latino people of any race were 3.7% of the population. [22]

2020 census

As of the 2020 census, there were 16,529 people, 6,710 households, and 4,174 families residing in the county. [23] The population density was 11.5 inhabitants per square mile (4.4/km2). There were 7,501 housing units at an average density of 5.22 per square mile (2.0/km2). The racial makeup of the county was 89.99% White, 0.94% African American, 2.83% Native American, 0.77% Asian, 0.14% Pacific Islander, 1.48% from some other races and 3.86% from two or more races. Hispanic or Latino people of any race were 3.47% of the population. [24]

2010 census

As of the 2010 census, there were 16,321 people, 6,651 households, and 4,171 families residing in the county. The population density was 11.4 inhabitants per square mile (4.4/km2). There were 7,503 housing units at an average density of 5.23 per square mile (2.0/km2). The racial makeup of the county was 95.01% White, 0.67% African American, 2.02% Native American, 0.54% Asian, 0.06% Pacific Islander, 0.41% from some other races and 1.29% from two or more races. Hispanic or Latino people of any race were 1.66% of the population.

In terms of ancestry, 53.0% were German, 31.2% were Norwegian, 7.0% were Irish, and 2.3% were American.

There were 6,651 households, 28.3% had children under the age of 18 living with them, 51.6% were married couples living together, 7.1% had a female householder with no husband present, 37.3% were non-families, and 30.9% of all households were made up of individuals. The average household size was 2.31 and the average family size was 2.91. The median age was 39.4 years.

The median income for a household in the county was $47,131 and the median income for a family was $64,636. Males had a median income of $42,597 versus $28,284 for females. The per capita income for the county was $24,342. About 5.2% of families and 10.7% of the population were below the poverty line, including 8.8% of those under age 18 and 11.6% of those age 65 or over.

Population by decade

Richland County, North Dakota

Communities

Cities

Unincorporated communities

Source: [7]

  • Blackmer
  • Enloe
  • Galchutt
  • La Mars
  • Lithia
  • Tyler

Townships

Politics

Richland County voters have traditionally voted Republican. In only one national election since 1936 has the county selected the Democratic Party candidate (as of 2024).

United States presidential election results for Richland County, North Dakota [25]
Year Republican Democratic Third party(ies)
No.%No.%No.%
1900 2,06758.46%1,39939.56%701.98%
1904 2,42066.50%1,11630.67%1032.83%
1908 1,86454.17%1,50243.65%752.18%
1912 1,03431.95%1,38042.65%82225.40%
1916 2,09753.25%1,77245.00%691.75%
1920 5,48379.46%1,33919.41%781.13%
1924 3,23548.84%76911.61%2,62039.55%
1928 4,25153.89%3,60445.68%340.43%
1932 2,30428.16%5,66369.20%2162.64%
1936 2,38631.41%3,79249.92%1,41818.67%
1940 5,10258.42%3,58441.04%480.55%
1944 4,40257.74%3,19241.87%300.39%
1948 3,44848.73%3,41348.24%2143.02%
1952 6,02269.78%2,54129.44%670.78%
1956 4,97160.96%3,17138.89%120.15%
1960 4,71154.04%4,00345.92%40.05%
1964 3,42543.05%4,52556.88%50.06%
1968 4,22454.38%3,09839.89%4455.73%
1972 5,19460.23%3,36739.04%630.73%
1976 4,99151.01%4,59246.93%2022.06%
1980 5,71161.17%2,69828.90%9289.94%
1984 5,98065.48%3,04733.36%1061.16%
1988 4,67056.44%3,52342.58%810.98%
1992 3,87346.66%2,68832.38%1,74020.96%
1996 3,34547.32%2,89040.88%83411.80%
2000 4,99962.37%2,49031.07%5266.56%
2004 5,26464.08%2,82134.34%1301.58%
2008 3,90051.57%3,51346.45%1501.98%
2012 4,22955.55%3,19842.01%1862.44%
2016 4,76762.79%2,06427.19%76110.02%
2020 5,07264.93%2,51032.13%2302.94%
2024 5,57667.50%2,47329.94%2122.57%

Education

School districts include: [26]

Circle of Nations Wahpeton Indian School is a tribally controlled school affiliated with the Bureau of Indian Education (BIE).

See also

References

  1. "Explore Census Data". United States Census Bureau . Retrieved June 2, 2025.
  2. 1 2 3 "U.S. Census Bureau QuickFacts: Richland County, North Dakota". www.census.gov. Retrieved June 2, 2025.
  3. "Find a County". National Association of Counties . Retrieved June 2, 2025.
  4. "Dakota Territory, South Dakota, and North Dakota: Individual County Chronologies". publications.newberry.org. The Newberry Library. 2006. Retrieved June 2, 2025.
  5. "County History". www.nd.gov. State of North Dakota. Retrieved June 2, 2025.
  6. Jackson, William (2024). North Dakota Tornadoes Twisters & Cyclones. Dickinson, ND: Valley Star Publications. p. 104. ISBN   979-8-89480-378-4.
  7. 1 2 3 "Richland County, North Dakota". Google Maps . Retrieved April 27, 2024.
  8. ""Find an Altitude/Richland County ND" Google Maps (accessed February 24, 2019)". Archived from the original on May 21, 2019. Retrieved February 25, 2019.
  9. "2024 County Gazetteer Files – North Dakota". United States Census Bureau . Retrieved June 2, 2025.
  10. "U.S. Census Bureau QuickFacts: Richland County, North Dakota". www.census.gov. Retrieved June 2, 2025.
  11. "County Population Totals and Components of Change: 2020-2024" . Retrieved June 2, 2025.
  12. "U.S. Decennial Census". United States Census Bureau. Retrieved July 20, 2014.
  13. "Historical Census Browser". University of Virginia Library. 2007. Archived from the original on December 12, 2009. Retrieved July 20, 2014.
  14. Forstall, Richard L. (April 20, 1995). "Population of Counties by Decennial Census: 1900 to 1990". United States Census Bureau. Archived from the original on February 19, 1999. Retrieved July 20, 2014.
  15. "Census 2000 PHC-T-4. Ranking Tables for Counties: 1990 and 2000" (PDF). United States Census Bureau. Archived (PDF) from the original on March 27, 2010. Retrieved July 20, 2014.
  16. "County Median Home Price". National Association of Realtors . Retrieved June 2, 2025.
  17. "Richland County, North Dakota — Population by Race". CensusScope. Retrieved June 2, 2025.
  18. "1990 Census of Population: General Population Characteristics North Dakota" (PDF). www.census.gov. October 6, 2022. p. 20. Retrieved June 2, 2025.
  19. "P004: Hispanic or Latino, and Not Hispanic or Latino by Race – 2000: DEC Summary File 1 – Richland County, North Dakota". United States Census Bureau . Retrieved June 2, 2025.
  20. "P2: Hispanic or Latino, and Not Hispanic or Latino by Race – 2010: DEC Redistricting Data (PL 94-171) – Richland County, North Dakota". United States Census Bureau . Retrieved June 2, 2025.
  21. "P2: Hispanic or Latino, and Not Hispanic or Latino by Race – 2020: DEC Redistricting Data (PL 94-171) – Richland County, North Dakota". United States Census Bureau . Retrieved June 2, 2025.
  22. "County Population by Characteristics: 2020-2023". www.census.gov. United States Census Bureau. Retrieved June 2, 2025.
  23. "US Census Bureau, Table P16: Household Type". United States Census Bureau. Retrieved June 2, 2025.
  24. "How many people live in Richland County, North Dakota". USA Today. Retrieved June 2, 2025.
  25. Leip, David. "Atlas of US Presidential Elections". uselectionatlas.org. Retrieved April 13, 2018.
  26. "2020 Census - School District Reference Map: Richland County, ND" (PDF). United States Census Bureau. Archived (PDF) from the original on July 24, 2022. Retrieved July 24, 2022. - Text list - 2010 map - 2010 text list