| ||||||||||||||||||||||||||||||||||||||||||||||||||||||||||||||||||||||||||||||||||||||||||||||||||||||||||||
60 seats 31 seats seats needed for a majority | ||||||||||||||||||||||||||||||||||||||||||||||||||||||||||||||||||||||||||||||||||||||||||||||||||||||||||||
|
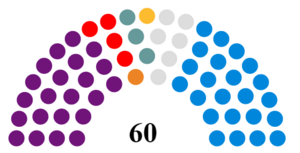
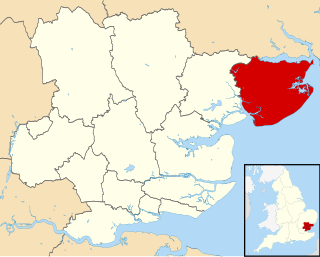
The 2015 Tendring District Council election took place on 7 May 2015 to elect members of Tendring District Council in England. [1] This was on the same day as other local elections.
England is a country that is part of the United Kingdom. It shares land borders with Wales to the west and Scotland to the north-northwest. The Irish Sea lies west of England and the Celtic Sea lies to the southwest. England is separated from continental Europe by the North Sea to the east and the English Channel to the south. The country covers five-eighths of the island of Great Britain, which lies in the North Atlantic, and includes over 100 smaller islands, such as the Isles of Scilly and the Isle of Wight.
As of 7 April 2017, the Council Composition (following two by-elections) is:
24 Conservative
22 UKIP
5 Independent Group
3 Holland-On-Sea Residents Association
1 Lib Dem
1 Tendring First .
The Conservative Party, officially the Conservative and Unionist Party, is a centre-right political party in the United Kingdom. Presently led by Theresa May, it has been the governing party since 2010. It presently has 314 Members of Parliament in the House of Commons, 249 members of the House of Lords, and 18 members of the European Parliament. It also has 31 Members of the Scottish Parliament, 12 members of the Welsh Assembly, eight members of the London Assembly and 9,008 local councillors. One of the major parties of UK politics, it has formed the government on 45 occasions, more than any other party.
Tendring First is a local political party operating throughout Tendring, Essex, England. They field candidates for Tendring District Council Frinton and Walton Town Council and Essex County Council. They currently have 1 district councillor on Tendring District Council and hold 10 seats on Frinton & Walton Town Council. They had 1 county councillor on Essex County Council between 2013 and 2016. They do not operate in parliamentary or European elections.
The by-elections saw one UKIP GAIN from Conservative. The other a Conservative GAIN from UKIP.
After the election the composition of the council is:
Party | Seats | Gains | Losses | Net gain/loss | Seats % | Votes % | Votes | +/− | |
---|---|---|---|---|---|---|---|---|---|
Conservative | 23 | 2 | 12 | 37.4 | 43,039 | ||||
UKIP | 22 | 22 | 0 | 23.3 | 26,832 | ||||
Independent | 6 | 2 | 1 | 7.8 | 9,023 | ||||
Labour | 4 | 1 | 5 | 16.8 | 19,366 | ||||
Holland Residents | 3 | 0 | 0 | 4.2 | 4,812 | ||||
Tendring First | 1 | 0 | 7 | 7.1 | 8,198 | ||||
Liberal Democrat | 1 | 0 | 1 | 1.7 | 1,995 | ||||
Green | 0 | 0 | 0 | 0.0 | 1.6 | 1,894 | |||
Party | Candidate | Votes | % | ± | |
---|---|---|---|---|---|
Liberal Democrat | Gary Scott | 828 | 68.8 | -6.1 | |
Conservative | Angela Rothwell | 265 | 22.0 | +5.9 | |
Labour | Terry Ripo | 110 | 8.4 | +0.5 | |
Majority | |||||
Turnout | 72.7 | ||||
Liberal Democrat hold | Swing | ||||
Party | Candidate | Votes | % | ± | |
---|---|---|---|---|---|
UKIP | Peter Cawthorn | 794 | 25.7 | N/A | |
UKIP | Alex Porter | 641 | 20.7 | N/A | |
Labour Co-op | Graham Caines | 465 | 15.0 | -13.4 | |
Labour Co-op | Delia Aldis | 455 | 14.7 | -15.1 | |
Conservative | Mary Mersh | 400 | 12.9 | -9.7 | |
Conservative | Brian Mersh | 340 | 11.0 | -8.2 | |
Majority | |||||
Turnout | 50.3 | ||||
UKIP gain from Labour Co-op | Swing | ||||
Party | Candidate | Votes | % | ± | |
---|---|---|---|---|---|
Conservative | Neil Stock | 985 | 77.4 | +23.3 | |
Labour | Pamela Watson | 288 | 22.6 | N/A | |
Majority | |||||
Turnout | |||||
Conservative hold | Swing | ||||
Party | Candidate | Votes | % | ± | |
---|---|---|---|---|---|
Conservative | Daniel Land | 902 | 67.2 | +24.1 | |
UKIP | Chris Cotter | 272 | 20.3 | N/A | |
Labour | Alan Roebuck | 169 | 12.6 | N/A | |
Majority | |||||
Turnout | |||||
Conservative gain from Independent | Swing | ||||
Party | Candidate | Votes | % | ± | |
---|---|---|---|---|---|
UKIP | John Chittock | 1,180 | 27.5 | N/A | |
UKIP | Ted Whitmore | 869 | 20.2 | N/A | |
Conservative | Siggy Challinor | 815 | 19.0 | -0.4 | |
Conservative | Stuart Morgan | 724 | 16.8 | -0.8 | |
Labour | Colin Watson | 362 | 8.4 | -3.3 | |
Labour | Fiona Hayes | 349 | 8.1 | -2.6 | |
Majority | |||||
Turnout | |||||
UKIP gain from Liberal Democrat | Swing | ||||
UKIP gain from Conservative | Swing | ||||
Party | Candidate | Votes | % | ± | |
---|---|---|---|---|---|
Conservative | Zoe Fairley | 723 | 51.8 | -6.6 | |
UKIP | Mark Morsley | 399 | 28.6 | N/A | |
Labour | Graham Ford | 273 | 19.6 | N/A | |
Majority | |||||
Turnout | |||||
Conservative hold | Swing | ||||
Party | Candidate | Votes | % | ± | |
---|---|---|---|---|---|
Independent | Jayne Chapman | 2,451 | 21.6 | +0.5 | |
Independent | Graham Steady | 2,185 | 19.3 | -1.8 | |
Independent | Karen Yallop | 1,520 | 13.4 | +1.1 | |
Conservative | Alan Goggin | 1,473 | 13.0 | -0.9 | |
Conservative | Vivien Chapman | 1,197 | 10.6 | +0.5 | |
Conservative | Elizabeth Edey | 786 | 6.9 | +0.4 | |
Green | Bev Maltby | 633 | 5.6 | N/A | |
Labour | Carol Carlsson Browne | 633 | 5.6 | -2.4 | |
Labour | Rebecca Collins | 464 | 4.1 | N/A | |
Majority | |||||
Turnout | |||||
Independent hold | Swing | ||||
Independent gain from Conservative | Swing | ||||
Party | Candidate | Votes | % | ± | |
---|---|---|---|---|---|
UKIP | Mick Skeels | 531 | 41.6 | N/A | |
Conservative | Pam Sambridge | 520 | 40.7 | -15.3 | |
Labour | Wayne Tearle | 146 | 11.4 | -8.6 | |
Green | Chris Southall | 80 | 6.3 | -1.9 | |
Majority | |||||
Turnout | |||||
UKIP gain from Conservative | Swing | ||||
Party | Candidate | Votes | % | ± | |
---|---|---|---|---|---|
Conservative | Giles Watling | 1,269 | 29.8 | -0.6 | |
Conservative | Nick Turner | 1,137 | 26.7 | -1.5 | |
Tendring First | Terry Allen | 701 | 16.4 | -3.5 | |
UKIP | Jack Parsons | 681 | 16.0 | N/A | |
Labour | Susan Morley-Souter | 246 | 5.8 | +1.8 | |
Labour | Mark Morley-Souter | 230 | 5.4 | +1.7 | |
Majority | |||||
Turnout | |||||
Conservative hold | Swing | ||||
Party | Candidate | Votes | % | ± | |
---|---|---|---|---|---|
UKIP | Kevin Watson | 1,185 | 27.6 | N/A | |
UKIP | Roy Raby | 1,135 | 26.5 | N/A | |
Labour Co-op | Dan Casey | 618 | 14.4 | -9.1 | |
Labour Co-op | Nick Brown | 508 | 11.8 | -7.7 | |
Conservative | Beverly Moule | 425 | 9.9 | -9.5 | |
Conservative | Anne Alexander | 412 | 9.8 | -6.4 | |
Majority | |||||
Turnout | |||||
UKIP gain from Labour Co-op | Swing | ||||
Party | Candidate | Votes | % | ± | |
---|---|---|---|---|---|
Independent | Tom Howard | 405 | 36.8 | N/A | |
Conservative | Steve Harris | 319 | 29.0 | -10.3 | |
UKIP | Andy Erskine | 261 | 23.7 | +6.0 | |
Labour | John McAllister | 166 | 10.5 | N/A | |
Majority | |||||
Turnout | |||||
Independent gain from Tendring First | Swing | ||||
Party | Candidate | Votes | % | ± | |
---|---|---|---|---|---|
Conservative | Lynda McWilliams | 785 | 64.4 | -3.5 | |
Liberal Democrat | Robert Taylor | 304 | 24.9 | -7.2 | |
Labour | Louise Armstrong | 130 | 10.6 | N/A | |
Majority | |||||
Turnout | |||||
Conservative hold | Swing | ||||
Party | Candidate | Votes | % | ± | |
---|---|---|---|---|---|
UKIP | Anne Davis | 917 | 21.7 | N/A | |
Conservative | Mark Platt | 829 | 19.6 | -4.5 | |
Conservative | Vanda Watling | 761 | 18.0 | -3.3 | |
UKIP | Christopher Shepherd | 652 | 15.4 | N/A | |
Tendring First | Iris Johnson | 504 | 11.9 | -9.4 | |
Tendring First | Paul Clifton | 341 | 8.1 | -9.4 | |
Labour | Bryan Whitcomb | 229 | 5.4 | -2.6 | |
Majority | |||||
Turnout | |||||
UKIP gain from Tendring First | Swing | ||||
Conservative hold | Swing | ||||
Party | Candidate | Votes | % | ± | |
---|---|---|---|---|---|
Labour | Ivan Henderson | 686 | 65.0 | +5.9 | |
Conservative | Angela Purbrick | 370 | 35.0 | +9.7 | |
Majority | |||||
Turnout | |||||
Labour hold | Swing | ||||
Party | Candidate | Votes | % | ± | |
---|---|---|---|---|---|
Labour | Garry Calver | 946 | 24.7 | +0.9 | |
Conservative | Barry Brown | 758 | 19.8 | -0.1 | |
Labour | Dave McLeod | 757 | 19.7 | -0.8 | |
Conservative | Robert Day | 698 | 18.2 | -0.2 | |
UKIP | Simon Ashley | 678 | 17.7 | +6.7 | |
Majority | |||||
Turnout | |||||
Labour hold | Swing | ||||
Conservative gain from Labour | Swing | ||||
Party | Candidate | Votes | % | ± | |
---|---|---|---|---|---|
Conservative | Ricky Callender | 865 | 19.1 | -3.6 | |
UKIP | John Brown | 779 | 17.5 | N/A | |
Labour | Pamela Morrison | 761 | 17.1 | -4.0 | |
Conservative | Sean Fay | 710 | 15.9 | -2.6 | |
Labour | John Hawkins | 673 | 15.1 | -3.9 | |
UKIP | John Thurlow | 668 | 15.0 | N/A | |
Majority | |||||
Turnout | |||||
Conservative hold | Swing | ||||
UKIP gain from Labour | Swing | ||||
Party | Candidate | Votes | % | ± | |
---|---|---|---|---|---|
Labour | Jo Henderson | 1,206 | 31.1 | +6.9 | |
Labour | Maria Fowler | 988 | 25.5 | N/A | |
Conservative | Darrell Howard | 921 | 22.7 | +2.3 | |
Conservative | Susannah Marie | 880 | 19.6 | +2.6 | |
Majority | |||||
Turnout | |||||
Labour hold | Swing | ||||
Labour gain from Conservative | Swing | ||||
Party | Candidate | Votes | % | ± | |
---|---|---|---|---|---|
Holland Residents | Joy Broderick | 1,041 | 80.2 | +9.5 | |
Conservative | Andrea Cossens | 257 | 19.8 | -9.5 | |
Majority | |||||
Turnout | |||||
Holland Residents hold | Swing | ||||
Party | Candidate | Votes | % | ± | |
---|---|---|---|---|---|
Conservative | Mark Cossens | 956 | 20.1 | +1.6 | |
Tendring First | Robert Bucke | 850 | 17.9 | -10.6 | |
UKIP | Richard Everett | 820 | 17.2 | N/A | |
Conservative | Pamela Walford | 766 | 16.1 | -2.4 | |
UKIP | Karl Whillier | 617 | 13.0 | N/A | |
Tendring First | Chris Keston | 476 | 10.0 | -17.2 | |
Labour | Dave Bolton | 274 | 5.8 | -1.6 | |
Majority | |||||
Turnout | |||||
Conservative gain from Tendring First | Swing | ||||
Tendring First hold | Swing | ||||
Party | Candidate | Votes | % | ± | |
---|---|---|---|---|---|
UKIP | Laurie Gray | 583 | 52.2 | N/A | |
Conservative | Mick Page | 535 | 47.8 | +1.2 | |
Majority | |||||
Turnout | |||||
UKIP gain from Conservative | Swing | ||||
Party | Candidate | Votes | % | ± | |
---|---|---|---|---|---|
Conservative | Val Guglielmi | 1,190 | 31.4 | +5.7 | |
Conservative | Andy Baker | 1,143 | 30.2 | +8.3 | |
Labour | Richard Kenny | 580 | 15.3 | -0.8 | |
Labour | Jo Richardson | 476 | 12.6 | -1.9 | |
Green | Eleanor Gordon | 399 | 10.5 | -0.5 | |
Majority | |||||
Turnout | |||||
Conservative hold | Swing | ||||
Party | Candidate | Votes | % | ± | |
---|---|---|---|---|---|
UKIP | Jeffrey Bray | 984 | 22.6 | N/A | |
Conservative | Mike Brown | 897 | 20.6 | +0.9 | |
Conservative | Anita Bailey | 836 | 19.2 | 0.0 | |
UKIP | Sandy White | 710 | 16.3 | N/A | |
Tendring First | Pete De-Vaux Balbirnie | 494 | 11.4 | -8.9 | |
Tendring First | Mavis De-Vaux Balbirnie | 430 | 9.9 | -8.0 | |
Majority | |||||
Turnout | |||||
UKIP gain from Tendring First | Swing | ||||
Conservative hold | Swing | ||||
On 10 May 2015, UKIP's Jeff Bray resigned from the party and now sits as an independent.
Party | Candidate | Votes | % | ± | |
---|---|---|---|---|---|
Conservative | Alan Coley | 1,299 | 32.5 | +6.4 | |
Conservative | Carlo Guglielmi | 1,245 | 31.1 | +6.2 | |
Green | Duncan Gordon | 782 | 19.6 | +5.6 | |
Labour | Cameron Scott | 675 | 16.9 | N/A | |
Majority | |||||
Turnout | |||||
Conservative hold | Swing | ||||
Party | Candidate | Votes | % | ± | |
---|---|---|---|---|---|
UKIP | Lis Bennison | 836 | 24.4 | N/A | |
UKIP | Andrew Pemberton | 679 | 19.8 | N/A | |
Conservative | Gwen Mitchell | 652 | 19.0 | -2.6 | |
Conservative | Sara Richardson | 538 | 19.0 | -1.7 | |
Labour | Joseph Freebody | 360 | 10.5 | -1.9 | |
Liberal Democrat | Rob Harper | 252 | 7.3 | -11.1 | |
Majority | |||||
Turnout | |||||
UKIP gain from Conservative | Swing | ||||
Party | Candidate | Votes | % | ± | |
---|---|---|---|---|---|
Conservative | Paul Honeywood | 618 | 18.6 | -2.1 | |
UKIP | Mohammad Khan | 609 | 18.3 | N/A | |
UKIP | Graham Townley | 607 | 18.2 | N/A | |
Conservative | Sue Honeywood | 591 | 17.8 | -3.8 | |
Labour | Wendy Davidson | 473 | 14.2 | +1.8 | |
Labour | Gary McNamara | 432 | 13.0 | +2.2 | |
Majority | |||||
Turnout | |||||
Conservative hold | Swing | ||||
UKIP gain from Conservative | Swing | ||||
Party | Candidate | Votes | % | ± | |
---|---|---|---|---|---|
Conservative | Tanya Ferguson | 390 | 36.9 | ||
UKIP | Anthony Colbourne | 388 | 36.8 | ||
Labour | Charlie Powell | 278 | 26.3 | ||
Majority | 2 | ||||
Turnout | |||||
Conservative hold | Swing | ||||
Party | Candidate | Votes | % | ± | |
---|---|---|---|---|---|
UKIP | Mary Newton | 870 | 26.0 | N/A | |
UKIP | Leonard Sibbald | 751 | 22.5 | N/A | |
Conservative | Danny Mayzes | 540 | 16.2 | -8.2 | |
Conservative | Andy Wood | 439 | 13.1 | -10.2 | |
Labour | Pia Smith | 385 | 11.5 | -7.1 | |
Labour | Steve Smith | 357 | 10.7 | -6.4 | |
Majority | |||||
Turnout | |||||
UKIP gain from Conservative | Swing | ||||
Party | Candidate | Votes | % | ± | |
---|---|---|---|---|---|
Holland Residents | Colin Winfield | 1,903 | 40.3 | +2.8 | |
Holland Residents | K.T. King | 1,868 | 39.5 | +3.8 | |
Conservative | Alan Bailey | 553 | 11.7 | -3.1 | |
Conservative | Lizi Ninnim | 403 | 8.5 | -3.5 | |
Majority | |||||
Turnout | |||||
Holland Residents hold | Swing | ||||
Party | Candidate | Votes | % | ± | |
---|---|---|---|---|---|
UKIP | Martin Hughes | 933 | 23.8 | N/A | |
Conservative | Chris Griffiths | 848 | 21.6 | -7.6 | |
Conservative | Maurice Alexander | 770 | 19.6 | -7.8 | |
UKIP | Teresa O'Hara | 741 | 18.9 | N/A | |
Labour | Denis Barry-Smith | 385 | 9.8 | 0.0 | |
Independent | Tony Fawcett | 244 | 6.2 | N/A | |
Majority | |||||
Turnout | |||||
UKIP gain from Conservative | Swing | ||||
Conservative hold | Swing | ||||
Party | Candidate | Votes | % | ± | |
---|---|---|---|---|---|
UKIP | John Hones | 1,081 | 25.0 | N/A | |
UKIP | Mark Stephenson | 973 | 22.5 | N/A | |
Conservative | Richard Bleach | 593 | 17.8 | -1.1 | |
Conservative | Eileen Sills | 580 | 13.7 | -1.6 | |
Labour | Clive Baker | 465 | 10.8 | -2.3 | |
Labour | Norman Jabobs | 435 | 10.1 | -2.6 | |
Majority | |||||
Turnout | |||||
UKIP gain from Conservative | Swing | ||||
UKIP gain from Tendring First | Swing | ||||
Party | Candidate | Votes | % | ± | |
---|---|---|---|---|---|
Independent | Michael Talbot | 1,159 | 28.5 | ||
Independent | John White | 1,059 | 26.0 | ||
Conservative | Rita Bailey | 635 | 15.6 | ||
Conservative | Kristian Brown | 579 | 14.2 | ||
Labour | Tracey Osben | 362 | 8.9 | ||
Labour | Jon Salisbury | 273 | 6.7 | ||
Majority | |||||
Turnout | |||||
Independent hold | Swing | ||||
Party | Candidate | Votes | % | ± | |
---|---|---|---|---|---|
UKIP | John Mooney | 944 | 20.2 | ||
Conservative | Andy Massey | 838 | 17.9 | ||
Tendring First | Pierre Oxley | 766 | 16.4 | ||
UKIP | Mike Vaughan-Chatfield | 760 | 16.3 | ||
Tendring First | Ann Oxley | 754 | 16.1 | ||
Conservative | Jonathan Norman | 611 | 13.1 | ||
Majority | |||||
Turnout | |||||
UKIP gain from Tendring First | Swing | ||||
Conservative gain from Tendring First | Swing | ||||
Party | Candidate | Votes | % | ± | |
---|---|---|---|---|---|
Conservative | Rosemary Heaney | 1,613 | 37.1 | ||
Conservative | Fred Nicholls | 1,502 | 34.5 | ||
Labour | Janet Smith | 625 | 14.4 | ||
Liberal Democrat | Rosemary Smith | 611 | 14.0 | ||
Majority | |||||
Turnout | |||||
Conservative hold | Swing | ||||
Party | Candidate | Votes | % | ± | |
---|---|---|---|---|---|
UKIP | Bridget Poonian | 759 | 20.5 | ||
Conservative | Margaret Miles | 618 | 16.7 | ||
UKIP | Ben Smith | 544 | 14.7 | ||
Conservative | Antony Pugh | 459 | 12.3 | ||
Labour | Gary Henderson | 338 | 9.1 | ||
Tendring First | David Oxley | 337 | 9.1 | ||
Tendring First | Jack Robertson | 327 | 8.8 | ||
Labour | Keith Henderson | 325 | 8.8 | ||
Majority | |||||
Turnout | |||||
UKIP gain from Conservative | Swing | ||||
Conservative hold | Swing | ||||
Tendring is a local government district in north east Essex, England. It extends from the River Stour in the north, to the coast and the River Colne in the south, with the coast to the east and the town of Colchester to the west. Its council is based in Clacton-on-Sea. Towns in the district include Frinton-on-Sea, Walton-on-the-Naze, Brightlingsea and Harwich. Large villages in the district include St Osyth and Great Bentley.
The 2008 Tandridge District Council election took place on 1 May 2008 to elect members of Tandridge District Council in Surrey, England. One third of the council was up for election and the Conservative party stayed in overall control of the council.
Thanet District Council in Kent, England is elected every four years.
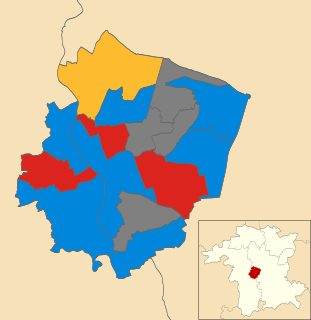
The 2007 Worcester City Council election took place on 3 May 2007 to elect members of Worcester District Council in Worcestershire, England. One third of the council was up for election and the Conservative party stayed in overall control of the council.
The 2012 Adur District Council elections took place on 3 May 2012 to elect members of Adur District Council in West Sussex, England. Half of the council was up for election, and the Conservative Party remained in overall control of the council.
The Norfolk County Council election took place across Norfolk on 2 May 2013, coinciding with local elections for all county councils in England. The results were announced the following day, Friday 3 May 2013. The result brought to an end 12 years of Conservative administration, who finished three seats short of a majority after losing 20 seats, leaving the Council in no overall control (NOC). UKIP and the Labour Party both made gains of 14 and 11 seats respectively. The Liberal Democrats and the Green Party both lost three seats each, whilst an independent won a single seat in North Norfolk.
The 2014 St Albans City and District Council election took place on 22 May 2014 to elect members of St Albans District Council in Hertfordshire, England. One third of the council was up for election and the council stayed under no overall control.
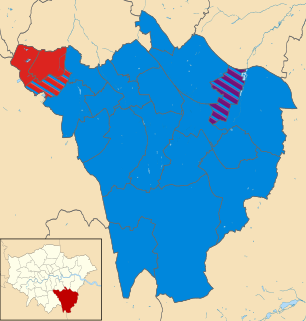
Elections to Bromley Council were held on 22 May 2014.
The 2014 Basingstoke and Deane Borough Council election took place on 22 May 2014 to elect members of Basingstoke and Deane Borough Council in England. This was on the same day as other local elections.
The 2014 Havant Borough Council election took place on 22 May 2014 to elect members of Havant Borough Council in Hampshire, England. One third of the council was up for election and the Conservative party stayed in overall control of the council.
The 2010 Huntingdonshire District Council election took place on 6 May 2010 to elect members of Huntingdonshire District Council in Cambridgeshire, England. One third of the council was up for election and the Conservative party stayed in overall control of the council.
The 2014 Huntingdonshire District Council election took place on 22 May 2014 to elect members of Huntingdonshire District Council in Cambridgeshire, England. One third of the council was up for election and the Conservative party stayed in overall control of the council.
The 2014 Harlow District Council election took place on 22 May 2014 to elect members of Harlow District Council in Essex, England. One third of the council was up for election and the Labour party stayed in overall control of the council.
The 2015 Breckland District Council election took place on 7 May 2015 to elect members of Breckland District Council in England. This was on the same day as other local elections.
Elections to Cannock Chase District Council took place on 7 May 2015, in line with other local elections in the United Kingdom which were held on the same day as the general election. A total of 15 councillors were elected from all 15 of the council's wards as a third of the council was up for election.
The 2015 Colchester Borough Council election took place on 7 May 2015 to elect one third of the members of Colchester Borough Council in England. This was the same day as other local elections and as the General Election. Colchester Borough Council is made up of 60 councillors: 20 councillors were up for election.
Elections to Colchester Borough Council took place on 5 May 2016. Colchester Borough Council normally elects one third of its councillors each year, however, due to boundary changes, the whole council is up for election.
Elections to Cannock Chase District Council took place on 3 May 2018 on the same day as other local elections in England. A third of the council was up for election, meaning a total of 13 councillors were elected from all but two of the council's wards.
The 2018 City of Bradford Metropolitan District Council took place on 3 May 2018 to elect members of Bradford District Council in England. This was on the same day as other local elections. One councillor was elected in each ward for a four-year term so the councillors elected in 2018 last stood for election in 2014. Each ward is represented by three councillors, the election of which is staggered, so only one third of the councillors were elected in this election. Before the election there was a Labour majority and afterwards Labour had increased their majority.
The 2018 Sunderland City Council election took place on 3 May 2018 to elect members of Sunderland City Council in England. The election took place on the same day as other local elections.