Texas's 32nd congressional district

Last updated

Texas's 32nd congressional district
Texas US Congressional District 32 (since 2021).tif
Texas's 32nd congressional district
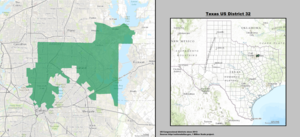
Interactive map of district boundaries since January 3, 2023
Representative
Distribution
  • 99.85% urban [1]
  • 0.15% rural
Population (2023)762,001 [2]
Median household
income
$70,159 [2]
Ethnicity
Cook PVI D+13 [3]

Texas's 32nd congressional district of the United States House of Representatives serves a suburban area of northeastern Dallas County and a sliver of Collin and Denton counties. The district was created after the 2000 United States census, when Texas went from 30 seats to 32 seats. It was then modified in 2011 after the 2010 census. The current representative is Democrat Julie Johnson.

Contents

Prior to 2022 redistricting, the district included part of the North Dallas neighborhood of Preston Hollow, which has been the home of George W. Bush since the end of his presidency. While it previously contained much of the Western Dallas County area, including Irving, since the 2011–2012 redistricting cycle, [4] the district now covers mostly the Northern and Eastern Dallas County areas, and a small portion of Collin County.

In 2018, civil rights attorney and former NFL player Colin Allred won a heavily contested primary for the Democratic nomination, and defeated Republican incumbent Pete Sessions in the November 6 election. [5] The district, like most suburban districts in Texas, had long been considered solidly Republican. However, its pre-2022 configuration was considered more of a swing district as a result of changing demographics, along with antipathy towards former President Donald Trump in suburban areas. [6] After 2022, the district was reconfigured to be solidly Democratic to protect Republicans in adjacent districts, re-electing Allred with over 60% of the vote.

Recent election results from statewide races

Current district (2021-2025)

YearOfficeResults [7]
2008 President Obama 56% - 44%
2012 President Obama 56% - 44%
2014 Senate Cornyn 50.4% - 49.6%
Governor Davis 55% - 45%
2016 President Clinton 60% - 34%
2018 Senate O'Rourke 67% - 33%
Governor Valdez 59% - 39%
Lt. Governor Collier 63% - 34%
Attorney General Nelson 64% - 33%
2020 President Biden 66% - 33%
Senate Hegar 61% - 36%
2022 Governor O'Rourke 64% - 34%
Lt. Governor Collier 64% - 33%
Attorney General Mercedes Garza 64% - 33%
Comptroller of Public Accounts Dudding 59% - 37%
2024 President Harris 60% - 37%
Senate Allred 64% - 34%

New district (2025-)

YearOfficeResults [8]
2008 President McCain 60% - 39%
2012 President Romney 64% - 36%
2014 Senate Cornyn 70% - 30%
Governor Abbott 65.5% - 34.5%
2016 President Trump 56% - 39%
2018 Senate Cruz 54% - 45%
Governor Abbott 59% - 39%
Lt. Governor Patrick 54% - 43%
Attorney General Paxton 54% - 44%
2020 President Trump 54% - 44%
Senate Cornyn 56% - 41%
2022 Governor Abbott 57% - 41%
Lt. Governor Patrick 56% - 42%
Attorney General Paxton 55% - 42%
Comptroller of Public Accounts Hegar 60% - 38%
2024 President Trump 58% - 40%
Senate Cruz 55% - 43%

Composition

For the 118th and successive Congresses (based on redistricting following the 2020 census), the district contains all or portions of the following counties and communities: [9]

CollinCounty (2)

Dallas (part; also 3rd, 4th, 5th, 6th, 24th, 30th, and 33rd; shared with Dallas, Denton, Kaufman, and Rockwall counties), Richardson (part; also 24th; shared with Dallas County)

DallasCounty (8)

Addison (part; also 24th), Balch Springs, Carrollton (part; also 24th, 26th, and 33rd; shared with Denton County), Dallas (part; also 3rd, 4th, 5th, 6th, 24th, 30th, and 33rd; shared with Collin, Denton, Kaufman, and Rockwall counties), Farmers Branch (part; also 24th and 33rd), Garland (part; also 5th), Mesquite (part; also 5th), Richardson (part; also 24th; shared with Collin County)

DentonCounty (2)

Carrollton (part; also 24th and 26th and; shared with Dallas County), Dallas (part; also 3rd, 4th, 5th, 6th, 24th, 30th, and 33rd; shared with Collin, Dallas, Kaufman, and Rockwall counties)

List of members representing the district

MemberPartyYearsCong
ess
Electoral historyCounties represented
District established January 3, 2003
Pete Sessions.jpg
Pete Sessions
(Dallas)
Republican January 3, 2003 –
January 3, 2019
108th
109th
110th
111th
112th
113th
114th
115th
Redistricted from the 5th district and re-elected in 2002.
Re-elected in 2004.
Re-elected in 2006.
Re-elected in 2008.
Re-elected in 2010.
Re-elected in 2012.
Re-elected in 2014.
Re-elected in 2016.
Lost re-election.
2003–2005
United States Congressional Districts in Texas, 2003 - 2004.tif
Southeastern Collin, Northeastern Dallas
2005–2013
TX32 109.gif
Southeastern Collin, Northeastern Dallas
2013–2023
Texas US Congressional District 32 (since 2013).tif
Southeastern Collin, Northeastern Dallas [10]
Colin Allred, official portrait, 117th Congress.jpg
Colin Allred
(Dallas)
Democratic January 3, 2019 –
January 3, 2025
116th
117th
118th
Elected in 2018.
Re-elected in 2020.
Re-elected in 2022.
Retired to run for U.S. Senator.
2023–present
Texas US Congressional District 32 (since 2021).tif
Southern Collin, Northeastern Dallas, and Southeastern Denton [11]
Rep. Julie Johnson Official Portrait.jpg
Julie Johnson
(Farmers Branch)
Democratic January 3, 2025 –
present
119th Elected in 2024.

Recent elections

2004

In the 2004 election, Martin Frost, the Democratic representative from Texas's 24th congressional district, who had been redistricted out of his district in Fort Worth, Arlington, and parts of Dallas, decided to run against Sessions rather than challenge Kenny Marchant or Joe Barton. Sessions benefited from President George W. Bush's endorsement to win in this Republican-leaning district.

US House election, 2004: Texas District 32
PartyCandidateVotes%±%
Republican Pete Sessions (incumbent) 109,859 54.3 −14.8
Democratic Martin Frost 89,03044.0+13.7
Libertarian Michael Needleman3,3471.7+0.6
Majority 20,82910.3
Turnout 202,236
Republican hold Swing -14.2

2006

In 2006, Dallas lawyer (and cousin of U.S. Senator Mark Pryor) Will Pryor unsuccessfully challenged Sessions, and lost by a large margin.

US House election, 2006: Texas District 32
PartyCandidateVotes%±%
Republican Pete Sessions (incumbent) 71,461 56.4 +2.1
Democratic Will Pryor52,26941.3−2.7
Libertarian John B. Hawley2,9222.3+0.6
Majority 19,19215.1+4.8
Turnout 126,562−75,584
Republican hold Swing +2.4

2008

In 2008, Sessions successfully faced a challenge by Democrat Eric Roberson and was reelected to another term. [12]

US House election, 2008: Texas District 32
PartyCandidateVotes%±%
Republican Pete Sessions (incumbent) 116,165 57.2 +0.8
Democratic Eric Roberson82,37540.6−0.7
Libertarian Alex Bischoff4,4102.2−0.1
Majority 33,79016.6+1.5
Turnout 202,950+76,298
Republican hold Swing +0.8

2010

In 2010, Sessions successfully faced a challenge by Democrat Grier Raggio and Libertarian John Jay Myers. Sessions was reelected to another term. [13]

US House election, 2010: Texas District 32
PartyCandidateVotes%±%
Republican Pete Sessions (incumbent) 79,433 62.6 +5.4
Democratic Grier Raggio44,25834.9−5.7
Libertarian John Jay Myers3,1782.5+0.3

2012

In 2012, Sessions successfully faced a challenge by Democrat Katherine Savers McGovern and Libertarian Seth Hollist. Sessions was reelected to his 9th term. [14]

US House election, 2012: Texas District 32
PartyCandidateVotes%±%
Republican Pete Sessions (incumbent) 146,129 58.29 −4.31
Democratic Katherine Savers McGovern98,86739.44+4.54
Libertarian Seth Hollist5,6642.25−0.25

2014

In 2014, Sessions successfully faced a challenge by Democrat Frank Perez and Libertarian Ed Rankin. Sessions was reelected to his 10th term.

US House election, 2014: Texas District 32
PartyCandidateVotes%±%
Republican Pete Sessions (incumbent) 96,420 61.8 +3.51
Democratic Frank Perez55,28135.4−4.04
Libertarian Ed Rankin4,2712.7+0.45
Majority 41,13926.4−12.96
Turnout 155,972−94,688

2016

In 2016, Sessions won an election contested only by third party candidates, as the Democrats did not nominate a challenger. Sessions was reelected to his 11th term.

United States House of Representatives elections, 2016: Texas District 32
PartyCandidateVotes%±%
Republican Pete Sessions (incumbent) 162,868 71.07 +9.25
Libertarian Ed Rankin43,49018.98+16.24
Green Gary Stuard22,8139.95+9.95
Total votes229,171 100
Republican hold Swing

2018

United States House of Representatives elections in Texas, 2018: District 32
PartyCandidateVotes%±%
Democratic Colin Allred 144,067 52.27 +52.27
Republican Pete Sessions (incumbent)126,10145.75−25.32
Libertarian Melina Baker5,4521.98−17.00
Total votes275,620 100.0
Democratic gain from Republican Swing

2020

United States House of Representatives elections in Texas, 2020: District 32 [15]
PartyCandidateVotes%
Democratic Colin Allred (incumbent) 178,542 52.0
Republican Genevieve Collins157,86745.9
Libertarian Christy Mowrey Peterson4,9461.4
Independent Jason Sigmon2,3320.7
Total votes343,687 100.0
Democratic hold

2022

2022 United States House of Representatives elections in Texas: District 32
PartyCandidateVotes%
Democratic Colin Allred (incumbent) 116,005 65.3
Republican Antonio Swad61,49434.6
Total votes177,499 100.0
Democratic hold

2024

2024 United States House of Representatives elections in Texas: District 32
PartyCandidateVotes%
Democratic Julie Johnson 140,536 60.45
Republican Darrell Day85,94136.97
Libertarian Kevin A. Hale5,9872.58
Total votes232,464 100.0
Democratic hold

See also

References

  1. "Congressional Districts Relationship Files (State-based)". U.S. Census Bureau. Archived from the original on April 2, 2013.
  2. 1 2 Center for New Media & Promotion (CNMP), US Census Bureau. "My Congressional District". www.census.gov.
  3. "2025 Cook PVI℠: District Map and List (119th Congress)". Cook Political Report. Retrieved April 5, 2025.
  4. Ross Ramsey (March 5, 2012). "In Redistricting, Race is the Limit to GOP Majority". The Texas Tribune. Retrieved August 8, 2012.
  5. "Democrat Colin Allred grabs Dallas-area U.S. House seat from GOP's Pete Sessions". Dallas News. November 7, 2018.
  6. "Role reversal: Architect of 2010 GOP House takeover in trouble". Politico .
  7. https://davesredistricting.org/maps#viewmap::1c2c1e0d-2fd1-43a8-a039-73e7023124d1
  8. "DRA 2020". davesredistricting.org. Retrieved August 18, 2025.
  9. https://www2.census.gov/geo/maps/cong_dist/cd118/cd_based/ST48/CD118_TX32.pdf
  10. "District Population Analysis with County Subtotals | CONGRESSIONAL DISTRICTS - PLANC2100" (PDF). Capitol Data Portal. Texas Legislative Council. August 26, 2021. Archived (PDF) from the original on June 27, 2022. Retrieved January 1, 2023.
  11. "District Population Analysis with County Subtotals | CONGRESSIONAL DISTRICTS - PLANC2193" (PDF). Capitol Data Portal. Texas Legislative Council. October 17, 2021. Archived (PDF) from the original on December 25, 2022. Retrieved January 1, 2023.
  12. U.S. News & World Report (November 10, 2008). "2008 US Congressional Race Results". USA Today. Retrieved May 6, 2009.
  13. The New York Times (November 10, 2009). "Election 2010". The New York Times. Retrieved August 8, 2012.
  14. Texas Office of the Secretary of State (November 9, 2012). "2012 General Election Results". Office of the Secretary of State. Retrieved November 29, 2012.
  15. "Texas Election Results - Official Results". Texas Secretary of State. Retrieved November 26, 2020.

Sources

32°55′13″N96°39′13″W / 32.92028°N 96.65361°W / 32.92028; -96.65361